Analyst Day Presentation - March 2021 - Electric Last Mile ...
←
→
Page content transcription
If your browser does not render page correctly, please read the page content below
Analyst Day Presentation
        March 2021
Disclaimer
Important Disclosures
This investor presentation (the “presentation”) is for information purposes only to assist interested parties in making their own evaluation with respect to the possible transaction (the “Transaction”) between Forum Merger III Corporation (“Forum”) and Electric Last Mile, Inc. (“ELMS”). The information contained herein does not purport to be all-inclusive and none of Forum, ELMS or their
respective directors, officers, stockholders, affiliates or advisers or any other person makes any representation or warranty, express or implied, as to the accuracy, completeness or reliability of the information contained in this presentation or any other written or oral communication to the recipient in the course of the recipient's evaluation of Forum or ELMS. The information contained
herein is preliminary and is subject to change and such changes may be material. The information in this presentation assumes that the Transaction is consummated on the terms contemplated by the Agreement and Plan of Merger (“Merger Agreement”) entered into by Forum and ELMS.

This presentation does not constitute (i) a solicitation of a proxy, consent or authorization with respect to any securities or in respect of the Transaction or (ii) an offer to sell, a solicitation of an offer to buy, or a recommendation to purchase any security of Forum, ELMS, or any of their respective affiliates (and there shall not be any sale of securities in any jurisdiction in which the offer,
solicitation or sale would be unlawful prior to the registration or qualification under the securities laws of any such jurisdiction). You should not construe the contents of this presentation as legal, tax, accounting or investment advice or a recommendation. You should consult your own counsel and tax and financial advisors as to legal and related matters concerning the matters described, and
by accepting this presentation, you confirm that you are not relying upon the information contained herein to make any decision.

No securities commission or securities regulatory authority in the United States or any other jurisdiction has in any way passed upon the merits of the Transaction or the accuracy or adequacy of this presentation.

Forward-Looking Statements
This presentation includes “forward-looking statements” within the meaning of the “safe harbor” provisions of the Private Securities Litigation Reform Act of 1995. Forum and ELMS’s actual results may differ from their expectations, estimates and projections and consequently, you should not rely on these forward-looking statements as predictions of future events. Words such as “expect,”
“estimate,” “project,” “budget,” “forecast,” “anticipate,” “intend,” “plan,” “may,” “will,” “could,” “should,” “believes,” “predicts,” “potential,” “continue,” and similar expressions are intended to identify such forward-looking statements. These forward-looking statements include, without limitation, Forum’s and ELMS’s expectations with respect to future performance and anticipated
financial impacts of the Transaction, the satisfaction of the closing conditions to the Transaction, the size, demands and growth potential of the markets for ELMS’s products and ELMS’s ability to serve those markets, ELMS’s ability to develop innovative products and compete with other companies engaged in the commercial delivery vehicle industry and/or the electric vehicle industry,
ELMS’s ability to attract and retain customers, the estimated go to market timing and cost for ELMS’s products, the implied valuation of ELMS and the timing of the completion of the Transaction. These forward-looking statements involve significant risks and uncertainties that could cause the actual results to differ materially from the expected results. Most of these factors are outside
Forum’s and ELMS’s control and are difficult to predict. Factors that may cause such differences include, but are not limited to: (1) the occurrence of any event, change or other circumstances that could give rise to the termination of the Merger Agreement or could otherwise cause the Transaction to fail to close; (2) the inability of ELMS to (x) execute transaction agreements with SF Motors,
Inc. (d/b/a SERES) that are in form and substance acceptable to Forum (at Forum’s sole discretion), (y) acquire a leasehold interest or fee simple title to the Indiana manufacturing facility or (z) secure key intellectual property rights related to its proposed business; (3) the outcome of any legal proceedings that may be instituted against Forum or ELMS following the announcement of the
Transaction; (4) the inability to complete the Transaction, including due to failure to obtain approval of the stockholders of Forum or other conditions to closing in the Merger Agreement; (5) the receipt of an unsolicited offer from another party for an alternative business transaction that could interfere with the Transaction; (6) the inability to obtain the listing of the common stock of the
post-acquisition company on the Nasdaq Stock Market or any alternative national securities exchange following the Transaction; (7) the risk that the announcement and consummation of the Transaction disrupts current plans and operations; (8) the inability to recognize the anticipated benefits of the Transaction, which may be affected by, among other things, competition and the ability of
the combined company to grow and manage growth profitably and retain its key employees; (9) costs related to the Transaction; (10) changes in applicable laws or regulations; (11) the possibility that ELMS may be adversely affected by other economic, business, and/or competitive factors; (12) the impact of COVID-19 on the combined company’s business; and (13) other risks and
uncertainties indicated from time to time in the proxy statement filed relating to the Transaction, including those under the “Risk Factors” section therein, and in Forum’s other filings with the Securities and Exchange Commission. Some of these risks and uncertainties may in the future be amplified by the COVID-19 outbreak and there may be additional risks that Forum considers immaterial
or which are unknown. Forum cautions that the foregoing list of factors is not exclusive. Forum cautions readers not to place undue reliance upon any forward-looking statements, which speak only as of the date made. ELMS is currently engaged in limited operations only and its ability to carry out its business plans and strategies in the future (in each case, as described in this presentation)
are contingent upon the closing of the proposed Transaction. The consummation of the Transaction is subject to, among other conditions, (i) the execution and effectiveness of transaction agreements by ELMS with SF Motors, Inc. (d/b/a SERES) that are each in form and substance acceptable to Forum (at Forum’s sole discretion), (ii) the acquisition by ELMS of a leasehold interest or fee
simple title to the Indiana manufacturing facility prior to the Transaction, and (iii) the securing by ELMS of key intellectual property rights related to its proposed business (collectively, the “Carveout Transaction”) . All statements in this presentation regarding the anticipated business of ELMS assumes the completion of the Carveout Transaction. Forum does not undertake or accept any
obligation or undertaking to release publicly any updates or revisions to any forward-looking statements to reflect any change in its expectations or any change in events, conditions or circumstances on which any such statement is based.

Industry and Market Data
In this presentation, we rely on and refer to information and statistics regarding market participants in the sectors in which ELMS expects to compete and other industry data. We obtained this information and these statistics from a variety of publicly available sources, including reports by market research firms and other public company filings. No representation is made as to the
reasonableness of the assumptions made within or the accuracy or completeness of any projections or modeling or any other information contained herein. Any data on past performance or modeling contained herein is not an indication as to future performance.

Trademarks
This presentation may contain trademarks, service marks, trade names and copyrights of other companies, which are the property of their respective owners. Solely for convenience, some of the trademarks, service marks, trade names and copyrights referred to in this presentation may be listed without the TM, SM, © or ® symbols, but Forum and ELMS will assert, to the fullest extent under
applicable law, the rights of the applicable owners, if any, to these trademarks, service marks, trade names and copyrights.

Additional Information and Where to Find It
Forum has filed with the U.S. Securities and Exchange Commission (“SEC”) a preliminary proxy statement in connection with its business combination with ELMS and other matters. Forum’s stockholders and other interested persons are advised to read the preliminary proxy statement and any amendments thereto and, when available, the definitive proxy statement, in connection with
Forum’s solicitation of proxies for its special meeting of stockholders to be held to approve, among other things, the proposed business combination, because these documents contain important information about Forum, ELMS and the proposed business combination. Forum’s stockholders may also obtain a copy of the preliminary proxy statement and the definitive proxy statement, once
available, as well as other documents filed with the SEC by Forum, without charge, at the SEC’s website located at www.sec.gov or by directing a request to: Forum Merger III Corporation, 1615 South Congress Avenue, Suite 103, Delray Beach, FL 33445. The information contained on, or that may be accessed through, the websites referenced in this presentation is not incorporated by
reference into, and is not a part of, this presentation.

Participants in the Solicitation
Forum and its directors and executive officers may be considered participants in the solicitation of proxies with respect to the business combination. Information about the directors and executive officers of Forum and a description of their interests in Forum are set forth in the preliminary proxy statement, which was filed on February 16, 2021 with the SEC, and definitive proxy statement,
when it is filed with the SEC, in connection with the proposed business combination. These documents can be obtained free of charge from the sources indicated above. ELMS and its directors and executive officers may also be deemed to be participants in the solicitation of proxies from the stockholders of Forum in connection with the business combination. A list of the names of such
directors and executive officers and information regarding their interests in the business combination are set forth in the preliminary proxy statement, which was filed on February 16, 2021 with the SEC, and definitive proxy statement, when it is filed with the SEC, in connection with the proposed business combination. These documents can be obtained free of charge from the sources
indicated above.

No Offer or Solicitation
This presentation shall not constitute a solicitation of a proxy, consent or authorization with respect to any securities or in respect of the Transaction. This presentation shall also not constitute an offer to sell or the solicitation of an offer to buy any securities, nor shall there be any sale of securities in any states or jurisdictions in which such offer, solicitation or sale would be unlawful prior to
registration or qualification under the securities laws of any such state or jurisdiction.

Use of Projections
This presentation also contains certain financial forecasts of ELMS. Neither Forum’s nor ELMS’s independent auditors have studied, reviewed, compiled or performed any procedures with respect to the projections for the purpose of their inclusion in this presentation, and accordingly, neither of them has expressed an opinion or provided any other form of assurance with respect thereto for
the purpose of this presentation. These projections are for illustrative purposes only and should not be relied upon as being necessarily indicative of future results. In this presentation, certain of the above-mentioned projected information has been provided for purposes of providing comparisons with historical data. The assumptions and estimates underlying the prospective financial
information are inherently uncertain and are subject to a wide variety of significant business, economic and competitive risks and uncertainties that could cause actual results to differ materially from those contained in the prospective financial information. Projections are inherently uncertain due to a number of factors outside of Forum’s and ELMS’s control. Accordingly, there can be no
assurance that the prospective results are indicative of future performance of the combined company after the Transaction or that actual results will not differ materially from those presented in the prospective financial information. Inclusion of the prospective financial information in this presentation should not be regarded as a representation by any person that the results contained in
the prospective financial information will be achieved. Further, the inclusion of valuation multiples and enterprise value of other companies is solely for illustrative purposes, and no assurance can be given that ELMS will be valued at comparable multiples and ELMS's valuations and projected results may differ materially from comparable companies.

Use of Non-GAAP Financial Measures
This presentation includes non-GAAP financial measures, including EBITDA. Forum and ELMS believe that these non-GAAP measures are useful to investors for two principal reasons: 1) these measures may assist investors in comparing performance over various reporting periods on a consistent basis by removing from operating results the impact of items that do not reflect core operating
performance; and 2) these measures will be used by ELMS’s management and board of directors to assess its performance and may (subject to the limitations described below) enable investors to compare the expected performance of ELMS and the combined company to its competition. Forum and ELMS believe that the use of these non-GAAP financial measures provides an additional tool
for investors to use in evaluating ongoing operating results and trends. These non-GAAP measures should not be considered in isolation from, or as an alternative to, financial measures determined in accordance with GAAP. Other companies may calculate these non-GAAP measures differently, and therefore such measures may not be directly comparable to similarly titled measures of other
companies. This presentation includes financial forecasts, including, but not limited to, with respect to ELMS’s future EBITDA. A reconciliation of these forward-looking non-GAAP financial measures to the most directly comparable GAAP financial measures is not provided in this presentation because neither Forum nor ELMS is able to provide such reconciliation without unreasonable effort.

                                                                                                                                                                                                             2
Transaction Summary
ELMS Founders Transaction Highlights
Forum Merger III Corp (NASDAQ: FIII) is a publicly listed special acquisition company
Jason Luo that has signed a definitive merger agreement on December 10, 2020 with Electric
Founder, Executive Chairman Last Mile, Inc. (“ELMS”), a commercial EV company; carveout to occur
ELMS Overview simultaneously with the merger.
Former President and CEO of Key Safety Systems (now Joyson Safety Systems).
Raised ~$155M PIPE in connection with the merger(1), in addition to ~$250M in
Following Key Safety Systems, Jason served as Chairman and CEO of Ford China. He is
currently a Senior Advisor and Operating Executive at Crestview Partners.
SPAC trust
James Taylor
Founder, CEO $1,195M enterprise value at closing(2)
ELMS Valuation
Represents attractive entry multiples relative to peer group metrics
More than 30 years at General Motors, serving as the President of Cadillac and CEO of
Hummer. Former Chairman and CEO of Workhorse. Prior to his role as CEO of SERES, he
was at Karma Automotive as Chief Revenue Officer.
ELMS Team expected to have close to ~$345M of cash(3) to fund operations and
Forum Merger III Corp Founders growth
Capital Structure
Marshall Kiev No additional capital requirements expected after close to achieve positive cash
Co-CEO, President & Director flow
Forum Merger III Corp
Over 28 years of alternative investing experience. Previously a Director of Cohen Private
Ventures and Chief of Staff at S.A.C. Capital Advisors. Former Partner at Main Street
Resources, a middle-market private equity firm.
~62.8% existing shareholders(4), ~19.6% public shareholders of Forum Merger III
Pro Forma Ownership(4) Corp, ~5.4% Forum Merger III Corp sponsors, ~12.2% PIPE investors(5)
David Boris
Co-CEO, CFO & Director
Forum Merger III Corp
30 years of Wall Street experience in mergers and corporate finance and has been
Forum Views ELMS As A Unique Opportunity To Invest In an Innovative Vehicle Solutions Platform
involved in more than 15 SPAC transactions. Former Senior Managing Director and Head With A Proven Management Team
of Investment Banking at Pali Capital.
(1) Includes $25 million in convertible notes issued by ELMS (which will be converted into common stock at the closing). (2) Assumes no redemptions. Enterprise value estimate based on $10.00 per share. Enterprise value includes 14.2 million shares to be reserved under the management incentive plan and excludes 5.0 million earnout shares to be issued post-closing upon $14/$16
stock price targets being hit and 15.0 million shares underlying earnout restricted stock unit grants to be made post-closing, which vest upon $14/$16 stock price targets being hit. (3) After estimated transaction fees and expenses and $35 million of payments related to the Carveout Transaction. (4) Includes 5.0 million shares of common stock proposed to be paid to SERES for
strategic cooperation, consulting and technical advice provided by SERES to ELMS. (5) Includes 2.8 million shares to be issued to ELMS convertible noteholders (excluding shares issuable for accrued interest).
3
World-Class Proven Leadership Team Focused on Execution

              Jason Luo                 James Taylor                    Jerry Hu                  Justin Prann                 Kev Adjemian                        Albert Li                  Benjamin Wu
           Executive Chairman,             CEO, Founder                     COO                          CCO                            CTO                            CFO                             GC
                Founder

         CEO of Key Safety Systems,      CEO of Workhorse and        Safety expert, global     National VP of Sales and     Global Head of Battery Cells    CFO of EV startup Byton and        Chief Legal Officer and
          Ford China and Accuride.      executive at Karma. 30+    operation leadership and      Service for Mahindra       at Fiat Chrysler Automobiles    Ford China, senior positions      Administration head for
        Senior Advisor and Operating     years of experience at     Asia head for Key Safety  Automotive North America,     and VP of Powertrain and EV      at Bombardier in charge of      Meridian, with extensive
            Executive at Crestview     General Motors, serving as    Systems, commercial     senior positions within BMW     Systems, including OTA, at       aerospace operations in         experience in M&A and
         Partners. Deep experience President of Cadillac and CEO     leadership and other      North America for parts      Karma. Fuel cell, battery and              China                  international corporate
          spanning automotive and             of Hummer           management at Accuride and    logistics and after-sales     electric powertrain R&D                                      transactions for both private
        private equity with history of                                    Volkswagen                                             leadership at Nissan                                          and public companies
          generating strong returns

                  25+                          35+                         25+                          15+                            20+                            20+                             15+
          Years of Experience          Years of Experience         Years of Experience          Years of Experience           Years of Experience             Years of Experience            Years of Experience

                                                                                                          4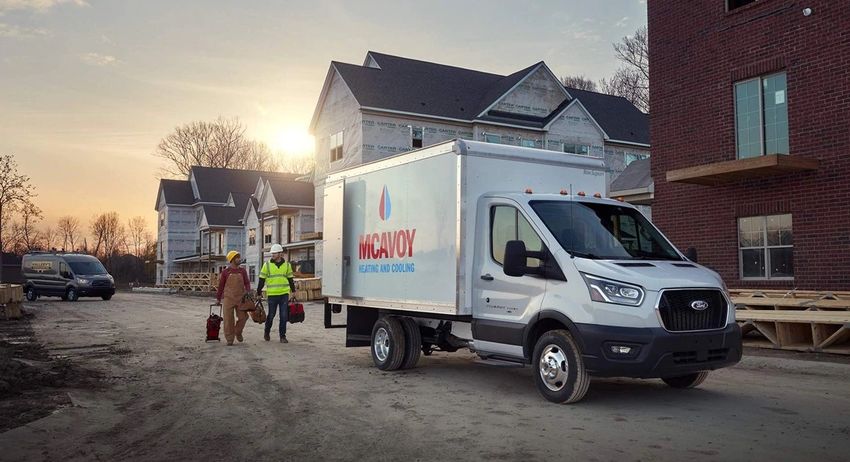
Seasoned Board of Directors Nominees Aligned with the Go-Forward Business Strategy

           Richard Peretz              Shauna McIntyre                Brian Krzanich                  Neil Goldberg                        Jason Luo                   James Taylor                     David Boris
             Former CFO, UPS            CEO, Sense Photonics             CEO, CDK Global               Chairman & CEO,                 Executive Chairman,            CEO, Founder, ELMS            Co-CEO and CEO, Forum
                                                                                                     Raymour & Flannigan                 Founder, ELMS                                                  Merger III Corp

            Fortune 50 Financial       Operating Executive at the      Leadership Across the         Experienced Retailer and        Leader in Automotive Safety    Seasoned Leader of Global      SPAC Pioneer with Significant
         Leadership and Global Last    Intersection of Technology   Technology Ecosystem and in       Real Estate Developer             with Proven Record of          Automotive Brands              Financial and Capital
           Mile Delivery Expertise            and Mobility           Manufacturing and Supply                                        Shareholder Value Creation                                        Markets Experience
                                                                               Chain                   45 years of retailing,                                         CEO of Workhorse and
         Retired CFO and member of       CEO of LiDAR solutions                                     merchandising and general        CEO of Key Safety Systems,      executive at Karma. 30+          30 years of Wall Street
              UPS management            provider Sense Photonics.   CEO of automotive dealer         management experience.           Ford China and Accuride.        years of experience at       experience in mergers and
         committee. Former CFO UPS     Former Google automotive       software provider CDK           Leading one of largest         Deep experience spanning       General Motors, serving as      corporate finance and has
         International and Corporate     services program lead.     Global. More than 30 years     furniture retailers in the U.S.     automotive and private      President of Cadillac and CEO   been involved in more than
           Treasurer and Controller        Leadership roles at      experience at Intel, serving                                        equity with history of             of Hummer                  15 SPAC transactions.
                                       Honeywell and Ford. Board         as CEO and COO                                               generating strong returns
                                        member of Lithia Motors

                   35+                          25+                           35+                             45+                              25+                            35+                             30+
           Years of Experience          Years of Experience           Years of Experience            Years of Experience               Years of Experience           Years of Experience             Years of Experience

                                                                                                                5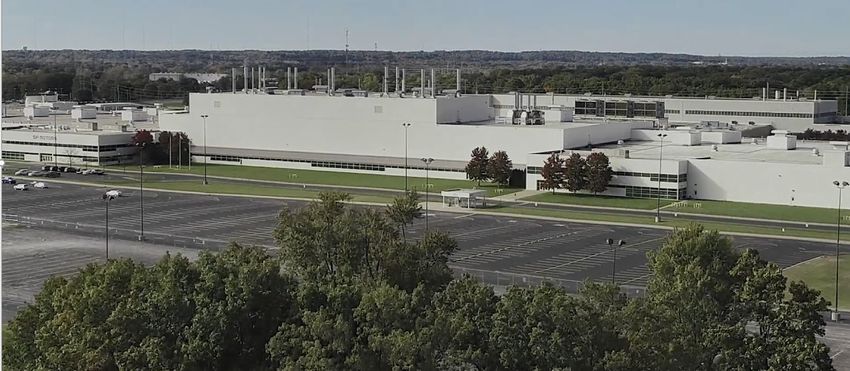
ELMS Believes it Can Deliver the Most Efficient Last Mile Solutions

                                                      Most Efficient
                                                    Last Mile Solutions

                             LOWEST COST OF
                                                            CONNECTED     CUSTOMIZED
                               OWNERSHIP

                                          CROSSOVER EV PRODUCT STRATEGY

                              EXISTING AND PROVEN PLATFORMS AND SYSTEMS

                                                                6
A Differentiated Business Model to Deliver Efficient, Connected and Customized Last Mile Solutions
OEMs Tier-1 Suppliers (1)
• License For Existing, Proven Platforms, Subsystems and Components
• Initial Launch Vehicle Platform To Be Provided by Sokon Group • Validated Electric Systems, Motors, Batteries and Vehicle Parts
Data Providers (2) Safety & Homologation Vehicle Integration Upfitters (3)
Low Cost Customization
Software & IoT
Reliable
Connected
Customized
EPT Engineering Manufacturing,
• Telematics and Data “Made-in-USA” • Customization to End-Use Case
Dealers & Service CUSTOMER SOLUTIONS Manufacturing
45,000+ Pre-Orders to Date
(4)
• Multiple Sales Channels, Active Discussions With Additional Dealers
• Flexible Service Model with National Coverage • Capital-Efficient Light, Final Vehicle Assembly
(1) Signed agreements with Contemporary Amperex Technology and Jing-Jin Electric North America. (2) Signed agreement with Geotab Inc. (3) Upfitter logos represent companies with whom ELMS is currently in discussions. (4) As of March 16, 2021. Figure refers to signed pre-orders. Pre-Orders do not bind potential customers to purchase vehicles. Actual purchase orders
require a separate binding commitment by a customer, following ELMS’ demonstration that the vehicle satisfies the customer’s requirements. 7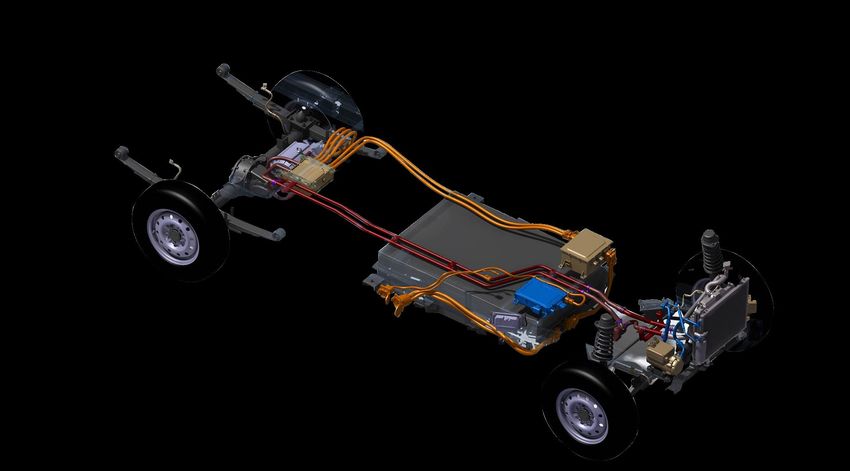
Investment Highlights Summary – ELMS Positioned to Provide Most Efficient Last Mile Solutions
Significant Market Opportunity Driving Explosive Demand for Delivery Vehicles
$1 Trillion North American eCommerce Market has Driven the Need for Lower Cost Delivery and Fleet Efficiency
Favorable Environment Given Government and Corporate Green / Sustainability Initiatives
ELMS Positioned to Deliver Efficient Last Mile Solutions
ELMS To Offer Class 1 to 3 With Lower TCO and Space Advantages
Poised to Deliver First Electric Class 1 Vehicle – SOP Late Q3 2021
Lower TCO Includes Both Acquisition Price and Operating Costs
Proven Product Market Fit To Meet Last Mile Demands (1)
Product Design Leverages Existing, Proven and Reliable EV Platforms and Subsystems
(1)
30,000+ Platform EVs Sold in Asia – Over 1.5 Million Miles Driven Daily
(1)
Excellent Warranty Experience Based on Existing Field Data
Vehicle Integration Underway and Supply Chain of Key Systems in Place
Efficient Solution: Vehicle + Data/Software + Customization
Established and Agile Plant with a History of Quality Production and Experienced, Trained Workforce
90% Ready for Production, With Over 100k Production Capacity and Agile Vehicle Assembly Flexibility to Build Several Models
Re-Tooled for EV Production and Low Capital Required for Launch – Estimated $45M Investment in Plant
Light Assembly, Low Complexity Enables Low-Cost EV’s on Accelerated Timeframe
(2)
Large Pipeline of 45,000+ Pre-orders From Diverse Group of Customers
(2)
Verified Customer Interest with 45,000+ Pre-Orders Representing $1B+ of Anticipated Revenue
Integrated Upfitting Model Means Vehicles are Tailored and Customized to Customer Needs Inside Assembly Plant, Saving Time and Money
Finalizing Specific Use Case Solutions – Configurations, Data, Customization
Differentiated and Capital Efficient Business Model (3)
Estimated $160M to Launch With Short Timeline to Expected Profitability (Q4 2022) and Low Break-Even Volume (18,000 Units)
(3)
Attractive Valuation at $1.2B EV – 2.6x 2024 Estimated EBITDA, .6x 2024 Estimated Revenue
Experienced Leadership Team with Track-Record of Success and Execution
Deep Experience Across Global OEMs, EV Start-Ups and Technology Providers, With Proven Ability to Design, Develop and Commercially Produce At Scale
Co-Founder & CEO James Taylor Brings 30 Years at GM as President, Cadillac and CEO, Hummer; Co-Founder Jason Luo Formerly CEO of KSS and Ford China
(1) Refers to platform vehicles sold by Sokon Group. (2) As of March 16, 2021. Figure refers to signed pre-orders. Pre-Orders do not bind potential customers to purchase vehicles. Actual purchase orders require a separate binding commitment by a customer, following ELMS’ demonstration that the vehicle satisfies the customer’s requirements. (3) Based on current
business model and financial projections. 8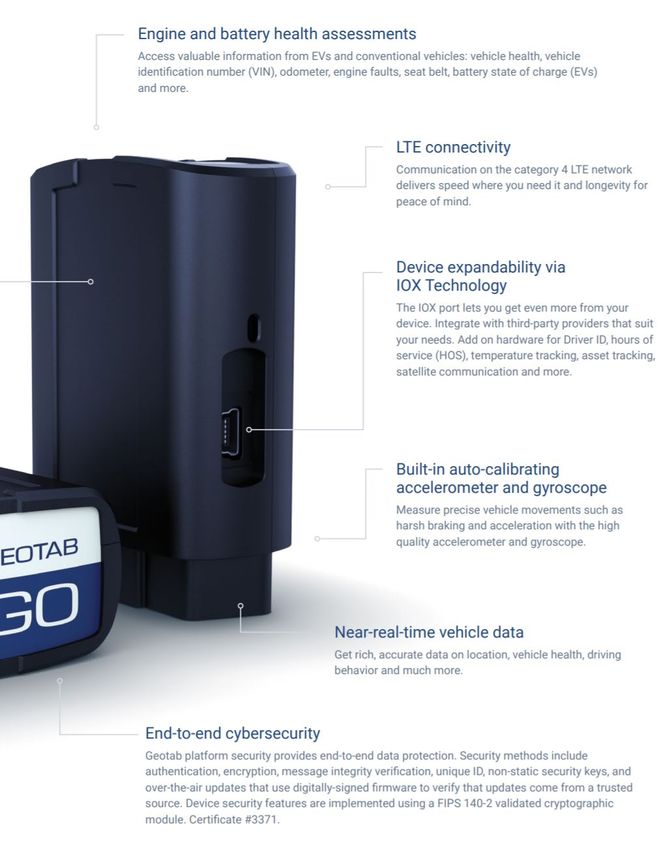
Highlights As We Execute Against Our Business Plan
Company Growth Sales, Distribution and Service
New 31,000 Square Foot Global Corporate Headquarters, Tech Hub and Prototype Center in Troy, MI Strong Value Proposition Driven Pre-Orders Surpass 45,000
Growing Team With World-Class Board Nominees and Experts From Leading Mobility Companies Identified and In Discussions With Regional Mega-Dealers for National Sales and Service Reach
Representative Company Experience of
Board Nominees and Team: In Discussions with Partner for National Service Strategy
(1)
45,000+ PRE-ORDERS
Vehicle Integration, Homologation & Supplier Readiness
Production Readiness
Supply Agreements with CATL and JJE For Electric Powertrain and Geotab for Telematics Plant Evaluations and Walk-Throughs With Potential Partners and Customers
Baseline & Gap Analysis Complete, Continuing Progress to Meet FMVSS/U.S. Requirements Operations Plan Developed With Upfitting Ecosystem Identified
Urban Utility Program Kicked Off Secured Conditional Incentive Package From Indiana Economic Development Corporation. Applying
for DOE Loan
(1) As of March 16, 2021. Figure refers to signed pre-orders. Pre-Orders do not bind potential customers to purchase vehicles. Actual purchase orders require a separate binding commitment by a customer, following ELMS’ demonstration that the vehicle satisfies the customer’s requirements.
9
Last Mile Landscape
Shift To Online And Consumer Desire For Immediacy Is Fueling Massive Demand For Delivery Vehicles
Targeting Last Mile Delivery
North America eCommerce market expected to be $1 trillion by 2025 (1)
13% CAGR
($ in Billions) $51.0
$45.1 (2)
$39.9
$35.3
$31.3
Last Mile Delivery Services growing in tandem to over $50 billion by 2022 (2)
2018 2019 2020E 2021E 2022E
(3)
($ in Thousands)
Delivery Van Segment 11% CAGR
Medium Utility Segment
1,231 1,359 1,489
982 1,105
476
Delivery vehicles market growing to 1.5 million units by 2025 408 441
(3)
350 378
823 918 1,013
632 727
2021E 2022E 2023E 2024E 2025E
(4)
Over 50% of costs in the delivery cycle incurred in last mile portion (4)
ELMS Well-Positioned as Anticipated First Mover in Class 1 EV in Underserved Market
(1) eMarketer. (2) TechNavio. (3) eMarketer, Automotive Fleet and Management Estimates. (4) Strategy& PwC Analysis
11Last Mile Use Cases
Transportation / e-Commerce Industrial Municipalities
Communications Small Business Utilities
ELMS Expects To Fulfill The Requirements For A Broad Universe Of Commercial Customers With Customized Solutions
12U.S. Commercial Delivery EV Market Landscape(1)
Category EV Announcements Pickup
CONVERSION
COMPANIES
Ford F-150 2022
CLASSES 4 – 8
Lordstown Endurance 2021
Nikola One TBC Tesla Semi 2021 Daimler Freightliner 2022
CLASS 3 Tesla Cybertruck 2021
10,001-14,000 Lb.
Workhorse C650/C1000 Amazon/Rivian 2022 Canoo TBD
Urban Utility - 2022
Rivian R1T 2021
CLASS 2
6001-10,000 Lb.
Ford eTransit 2022MY GM/BrightDrop EV600 2021
Ram Pickup TBD
CLASS 1 *ELMS Anticipated First EVU.S. Commercial Delivery Market By Weight Class(1)
Gross Vehicle
EV Announcements Gas Entries Currently In Market
Weight
CLASS 3 Workhorse C650/C1000 Amazon/Rivian 2022MY
10,001-14,000 Lb.
Ford Transit 350 GMC Savana 3500 Ram Promaster 3500
Canoo TBD
Urban Utility - 2022
CLASS 2
6001-10,000 Lb.
Ford eTransit 2022MY GM/BrightDrop EV600 2021 Ram Promaster Ford Transit Chevrolet Mercedes
Express Sprinter
CLASS 1 Urban Delivery - 2021
Canoo MPDV 2023Crossover Strategy Offering Superior Cargo Room and Cost Alternatives
13+%
+35% space More Space Cost Savings
Cargo Space
~125 Cu. Ft. 170 – 218 Cu. Ft. 240 – 500 Cu. Ft. 400 – 600 Cu. Ft. ~450 – 750+ Cu. Ft.
Class 1 Class 2 Class 3
MSRP: ~$25,000 $25,000 ~$30,000 - $44,000 $35,000 ~$40,000 – $50,000
Ford Transit – 247–487
Urban Delivery (2021) – 170
Ford Transit Connect – 104–127 Ford Transit 350
Urban Utility – 2022
Ram Promaster – 259–463
Ram Promaster City – 132
Urban Delivery (2022) – 218 Urban Utility Variant
GMC Savana 3500
Nissan NV – 264–323
Same Price as Gas More or Equivalent
Vehicle / 35% More Cargo Space / EV /
Cargo Space Cost Effective
Nissan NV 200 – 123 Chevrolet Express – 240-284 Ram Promaster 3500
Source: Public sources. Price of ELMS vehicles net of $7,500 Federal Tax Credit. Urban Delivery and Urban Utility specifications based on current designs.
15ELMS’ Business Model Enables Short Time To Market
SOP Q3 2021 SOP H2 2022 Launch Timeline for the Urban Delivery
2021 2022
(1)
(2)
Key Work Streams Timing: Q1 Q2 Q3 Q4
Urban Delivery Urban Utility
Engineering Program
Requirement Complete
Homologation Compliance
Plan (Component Level)
Engineering Change
Manufacture Process
Development
(1) (1)
SPECIFICATIONS SPECIFICATIONS
Manufacture Process Freeze
Wheelbase 120 inches Wheelbase 134 inches
Manufacture Jigs & Tools
L*W*H 177*66*78 L*W*H 215*74*81
First Pilot
GVWR 5,732 lbs. GVWR 10,050 LBS.
Curb Pre - Testing Vehicle Build
3,329 lbs. Curb Weight 4950 lb.
Weight
Max Pre - Regulatory Testing
2,403 lbs. Max Payload 5100 lb.
Payload
Pre - Production
Cargo Capacity 170 cu.ft. Cargo Capacity 450-600 cu.ft.
Battery Size 60-90 kW
Final Regulatory Testing
Battery Size 42 kW
Range 150 miles Range 175–225 miles SOP
Anticipated SOP: Q3
(1) Specifications based on current designs and subject to change based on homologation needs. (2) Timeline Representative of projected Urban Delivery milestones.
16Solutions to Customer Requirements
Customers’ Purchase Decisions Based on Value

                                                                        Where ELMS Plans to Win

                                                                                   Crossover Product                                 Customization
                                                                                                                                  Integrated         Capability
                                                                                                                                                Customization
                                     Low   TCO– –
                                      Low TCO                                                                                            Specific Use Cases
                                 Acquisition   Price
                                  Acquisition Price &&                                  Strategy                                   For Specific Use Cases –
                                                                                                                                  With a Simple Acquisition Process
                                    Operating Costs
                                  Operating Costs                                                                                       Under One Roof

           Reliability
          Reliability    –
                      – With                             Data & Connectivity
                                                            Reliability – With                            Product
                                                                                                            ProductThat   Achieves
                                                                                                                    That Achieves                                       Parts
                                                                                                                                                                      Parts    & Service
                                                                                                                                                                            & Service Support
        Competitive Warranty
      Competitive     Warranty                            Competitive
                                                              for FleetsWarranty                       Green / /Sustainability
                                                                                                         Green                    Targets
                                                                                                                 Sustainability Targets                                     Support

                                                                                          18
ELMS Anticipates the Lowest Total Cost of Ownership (TCO)(1) vs. Segment Leading Gas Vehicles
Vehicle Cost Operating Cost
Class 1 ELMS Urban Class 2
Leader Delivery Leader
ELMS Urban Annual Energy Costs $2,500 $1,050 $3,676
Class 1 Leader Class 2 Leader
Delivery Maintenance $1,500 $500 $1,500
$25,000 $25,000* $34,510 Total $4,000 $1,550 $5,200
TCO Lowest TCO
Class 1 Leader ELMS Urban Delivery Class 2 Leader
TCO per Mile $0.26 $0.17 $0.35
Cu.ft.: $ per 100 miles $0.21 $0.10 $0.14
(1) vs. Class 1 and 2 gas vehicles in market. Management statements and assumptions on this page based on data and vehicle specifications from public sources and/or management estimates. Figures subject to change based on
final design. *Price net of $7,500 Federal Tax Credit; 25,000 miles per year; $2.50 / gal. $0.13 / kWatt; Differential Maintenance Costs of Brake Service, Engine and Transmission Oil Changes
19ELMS’ Full Vehicle System Integration Capabilities Paired with In-Market Technologies For Reliable Solutions
Safety & Homologation
(2)
E-Motor & Inverter
ELMS Urban Delivery
In-Market 100kW
E-Motor Technology
Battery
Software
• ELMS to Develop In-House Control Software
Reliable LFP Chemistry (Battery Management System, Vehicle Control
Unit, etc.)
Comprehensive Testing & Validation (1)
(1) Representative testing and validation conducted by CATL. (2) Representative of U.S. regulatory requirements.
20ELMS AIR Suite Of Digital Solutions to be Tailored to Customer Needs
ELMS to Partner with Geotab, One of The Largest Commercial Telematics Provider With Over 2.2 Million Subscribers
(1)
Powered by
(2)
(1)
Expected to be First OTA-Enabled Class 1 EV
(1) Graphics and capabilities from Geotab GO9+ brochure (2) Anticipated Solutions and Capabilities
21Current Vehicle Upfitting Process is Inefficient And Costly(1)
Time – Dealer Order to Delivery(2)
Ram Promaster City: 137 Days
Transit Connect: 130 Days
Chevrolet Express: 128 Days
DEALER OEM UPFITTER(S) FINAL DELIVERY
Processes Customer Dealer Completes
CUSTOMER
Order to OEM OEM Prioritizes Orders Many Locations Transaction / Delivery
and Builds Vehicle Each Have Product Specialties
CUSTOMER
FMCs
Aligned with FMCs/ OEMs/
Dealers
Vehicles Typically Built In At Least 2 Stages And Require Use Of Franchised Dealers For Ordering And Delivery
(1) Source: Public sources and/or management estimates.
(2) Source: AutomotiveFleet – 2019 Data.
22ELMS’ Disruptive, Integrated Upfitting Model Tailors Vehicles To Customer Needs
Integrated Customization Inside Assembly Plant
Upfitting integrated into
Customer Orders from ELMS assembly line and end of line Completed Vehicle To Customer Specifications Without The Need
Leading Upfitters (1) For A Second Stage
CUSTOMER BENEFITS(2)
Time Quality Cost
~25% Order-to-Delivery Time One Warranty ELMS Single Point- Total Vehicle Upfitter Value Chain
Reduction Time, Under 100 Days of-Contact For Customer Costs Reduced By 5+%
Source: Public sources including AutomotiveFleet 2019 data and management estimates. (1) Upfitter logos represent companies with whom ELMS is currently in discussions. (2) Expected benefits based on business model in place.
23Efficient and Flexible Service Model
Locate
Technicians Regional
Inside Fleet Integrated Responsive Mobile
Companies Technicians
Depots
ELMS
National Service
Center
at Plant
Over-the-Air
Dealerships System For
Local Cloud Software
Updates
National
National Service Partner
ELMS Will Service Vehicles Using Best Mode To Meet Customers Needs
24Customers
ELMS B2C Sales Process Provides Solutions for End-Customer Needs

                                                         Customer Use Cases
                                                     Technical Specifications:
                           In-depth discovery process directly with Customer supported by FMCs, Dealers, Upfitters

                                                                  Match:
                                              Finalize specifications, volume, pricing and timing

                                                          Testing & Buy-Off:
                                              Customer-specific duty cycle testing and validation

                                                   Direct           FMCs            Upfitters

                                                                Firm Order,
                                                            Transaction Papered

                                                            CUSTOMER DELIVERY

                                                                       26
Engagements and Pre-Orders (1)
Sales
Direct
Channels
Fleet Management
Companies
Dealers / Distributors
Upfitters
(1) As of March 16, 2021, companies on this page are either a) customers with whom ELMS or its distributing partners are currently in discussions, and/or b) signed pre-order customers. Pre-Orders do not bind potential customers to purchase vehicles. Actual purchase orders require a separate binding commitment by a customer, following ELMS’
demonstration that the vehicle satisfies the customer’s requirements.
27Manufacturing & Customization
ELMS’ Agile Manufacturing & Customization Strategy

        ELMS Believes its Strategy Will Enable it to Provide Low-Cost, Customized EV’s at an Accelerated Timeframe

                        Minimal                                       Customization Capability
                         Low TCO –                                   Light,  Final Vehicle                                     Connectivity to Support
                                                                                                                                Integration of
                   Capital/Engineering
                     Acquisition Price &                                 Specific Use Cases                                   Their Fleet Management
                                                                           Assembly
                                                                  With a Simple Acquisition Process                          Upfitting    Operations
                                                                                                                                       System
                        Spending
                       Operating Costs

                                           Existing or Readily-
                                                                                                     Product That Achieves
                                            Available, Trained                                             EV ReadyTargets
                                                                                                  Green / Sustainability
                                                Workforce

                                                                                29
Target Plant for ELMS Manufacturing and Customization Footprint – Mishawaka, Indiana
Manufacturing Drivers (1)
Plant has Been Converted for EV Assembly Estimated $45M Plant Investment Required to Launch the Urban Delivery
Pilot EV completed, Led by Experienced Workforce Supply Chain Identified
U.S. Localization Plan for Major Systems
Assembly Customization
Target Plant Key Capabilities
History of High-Quality Vehicle Assembly for Global OEMs (Hummer H2) State / Federal Incentives
and Mercedes-Benz (R-Class) Favorable Labor Agreement
Production Capacity of 100K+, 675k sq. ft Ability to Integrate Upfitter for Customization
(1) Investment figures based on management estimates. 30Low-Complexity Manufacturing for Vehicle Launch
Typical OEM / EV Start-Up:
(1)
New Product, New Plant
Capital Intensive Capital Efficient
$1.5B+ for clean sheet new product and a greenfield plant, including Estimated $160M required to create business at scale, including
typically $150M for plant tooling estimated $45M for Plant Launch
Funds
Need high volume to generate return on investment Low break-even volume
High Complexity Reduced Complexity
Require Stamping, Body Shop, Painting and Assembly No Stamping, Welding, Painting Required At Launch
Assembly Typically 60 Stations Approximately 20 Assembly Stations Due to Modules of Subsystems,
Production Process
Ground-Up Assembly Process Design Required Not Parts, Being Received
Heavy Ramp
Light Ramp
Large Hiring Ramp Required for Launch Light Re-Calls and Hiring For Initial Ramp
Significant and High-Complexity Training Required Modular Assembly Lowers Complexity of Training for Urban Delivery
Numerous Manufacturing Risk Variables and High Degree of Tuning Assembly
Ramp Up Required for First Builds
(1) Based on public sources and management estimates.
31Financials
By Conservatively Targeting ~5% Of The Urban Delivery And Urban Utility Markets, ELMS Could Grow To
$3 Billion In Revenue By 2025
Urban Delivery Segment (Class 1 & 2) Urban Utility Segment (Class 3)
Total Segment (in thousands) Total Segment (in thousands)
ELMS Volume ELMS Volume
ELMS Segment Share ELMS Segment Share
476
441 25
408 18
1,014 378 5%
10 4%
901 58 4
801 2%
37
712 1%
25 6%
633 16 4%
4 3%
2% 451
1% 398 423
956 374
864
697 776
629
2021E 2022E 2023E 2024E 2025E 2022E 2023E 2024E 2025E
Path to $3B Revenue Assuming Conservative Volumes and Models
Expected Increase In Operating Leverage As The Business Scales
Revenue EBITDA(1)
$3,046
EBITDA Margin (1)
$791
$1,906 21% 24% 26%
$1,177 2%
$465
$613
$122
$248
2021E 2022E 2023E 2024E 2025E
(82%)
Volume (K) 4.0 19.1 35.0 55.0 83.0 ($101) $15
Average Sales
$30,610 $32,119 $33,634 $34,661 $36,696
Price
2021E 2022E 2023E 2024E 2025E
Source: Public sources and management estimates.
(1) EBITDA and EBITDA margin are non-GAAP metrics and based on current management estimates and current budget model.
33Financial Projections
Projected Financials Commentary
($ in Millions) 2020E 2021E 2022E 2023E 2024E 2025E
Total Units Sold 0 4,000 19,100 35,000 55,000 83,000
No Additional Capital Expected to be
Required After Merger Close to fund
Revenue $0 $122 $613 $1,177 $1,906 $3,046 initial product launches
% Growth - - 401% 92% 62% 60% Projected to Be Cash Flow Positive in
Q4 2022
Cost of Goods Sold $0 ($96) ($477) ($849) ($1,351) ($2,154)
Estimated 83,000 Units by 2025,
Gross Profit $0 $26 $137 $328 $555 $891 Representing ~5% of U.S. Market
% Margin na 21% 22% 28% 29% 29% Revenue Projected to Reach $3 Billion
(1) and EBITDA estimated at $791 Million by
EBITDA $0 ($101) $15 $248 $465 $791
end of 2025
% Margin na (82%) 2% 21% 24% 26%
CapEx $0 ($45) ($30) ($27) ($75) ($25)
% Revenue na 37% 5% 2% 4% 1%
(1) EBITDA and EBITDA margin are non-GAAP metrics and based on current management estimates and current budget model.
34Pro Forma Equity Ownership
($ in Millions, except per share amount)
Pro Forma Valuation Sources and Uses
Share Price $10.00
(1) Forum Merger III Corp Shares $806 67%
Pro Forma Shares Outstanding (ex. earnout) 128.3 (4)
Equity Value (ex. earnout) $1,283 Estimated Cash Held in Trust 250 21%
Shares to be Reserved under Incentive Plan 14.2 PIPE Proceeds 130 11%
Equity Value (ex. earnout) w/Incentive Plan Shares (9) $1,425 Pre-PIPE Proceeds (5)
25 2%
Plus: Debt (2) 115
Total Sources $1,211 100%
Less: Cash to Balance Sheet (345)
Enterprise Value (ex. earnout) $1,053
Enterprise Value (ex. earnout) w/Incentive Plan Shares(9) $1,195 Equity Consideration to Existing ELMS Shareholders $806 67%
Transaction Multiples Metric Cash to Balance Sheet 345 28%
Pro Forma EV / 2024E Revenue (9) $1,906 0.6x Estimated Fees & Expenses 25 2%
Pro Forma EV / 2025E Revenue (9) 3,046 0.4x (8)
Payments Related to Carveout Transaction 35 3%
Pro Forma EV / 2024E EBITDA (9) 465 2.6x
Pro Forma EV / 2025E EBITDA
(9)
791 1.5x Total Uses $1,211 100%
(3)
Commentary Pro Forma Ownership
All ELMS equity holders will receive stock in public company (no cash paid to ELMS shareholders at (4)
closing) (7) Forum's Public Stockholders, 19.6%
ELM Securityholders, 62.8%
Proceeds from the transaction will be used to capitalize balance sheet for full development and (6)
ELMS Convertible Note Holders, 2.1%
commercialization of ELMS’ Urban Delivery and Urban Utility vehicles and to pay transaction expenses
Completion of the transaction is expected to occur in the second quarter PIPE Investors, 10.1%
Sponsor, 5.4%
(1) Based on proposed Transaction, pro forma share count assumes no redemptions and includes 25.1 million shares to be held by public shareholders of Forum Merger III Corp., 13.0 million shares to be issued to PIPE investors, 2.8 million shares to be issued to ELMS convertible note holders, 6.9 million shares to be issued to Forum Merger III Corp.’s sponsor, officers and directors, 80.6 million shares to be issued to the ELMS stockholders in the
merger transaction (including 5.0 million shares proposed to be paid to SERES for strategic cooperation, consulting and technical advice provided by SERES to ELMS). Excludes 14.2 million shares to be reserved under management incentive plan, shares underlying warrants ($11.50 strike price), 15.0 million shares underlying earnout restricted stock unit grants to be made post-closing (which vest following the Transaction upon $14/$16 stock price
targets being hit ), and 5.0 million earnout shares to be issued following the transaction upon $14/$16 stock price targets being hit. (2) Represents $115 million expected to be paid in connection with the purchase of the plant. The total purchase price is expected to be $145 million, with $30 million to be paid at the closing of the plant purchase. (3) Pro Forma Ownership based on proposed Transaction. (4) Assumes no redemptions. (5) Proceeds
from $25.0 million of convertible notes issued by ELMS that will convert into common stock at the closing. (6) Includes investors in ELMS’ convertible notes, which will convert into common stock at the closing (does not account for accrued interest under the convertible notes, which will also be converted into common stock). (7) Includes 5.0 million shares of common stock proposed to be paid to SERES for strategic cooperation, consulting and
technical advice provided by SERES to ELMS. (8) Payments contemplated under the SERES Term Sheet ($30.0 million paid at closing of transactions contemplated by the Existing SERES Asset Purchase Agreement and additional payment of $5.0 million pursuant to the SERES Term Sheet). The terms of the payments are subject to finalization and execution of definitive documentation and therefore could change. (9) Each of equity value and
enterprise value (A) include 14.2 million shares to be reserved under the management incentive plan and (B) exclude 5.0 million earnout shares to be issued post-closing upon $14/$16 stock price targets being hit and 15.0 million shares underlying earnout restricted stock unit grants to be made post-closing, which vest upon $14/$16 stock price targets being hit..
35Enterprise Value Benchmarking
Enterprise Value / Forward Revenue
Recent EV and Automotive Technology SPACs or Emerging Growth Players Established OEMs
’23E Median: 1.8x ’21E Median: 10.7x
’24E Median: 0.8x ’22E Median: 8.1x
’25E Median: 1.2x 15.2x 12.8x
12.4x
8.9x 8.3x 7.9x
5.2x
3.0x 3.4x
2.9x
2.4x
2.0x 1.7x 1.7x 1.9x
1.0x 1.1x 1.2x 1.3x
0.6x 0.4x 0.3x 0.8x 0.5x
0.4x NA NA 0.3x NA
’23E ’24E ’25E ’23E ’24E ’25E ’23E ’24E ’25E ’23E ’24E ’25E ’23E ’24E ’25E ’23E ’24E ’25E ’23E ’24E ’25E ’21E ’22E ’21E ’22E ’21E ’22E ’21E ’22E
Enterprise Value ($M):
$1,196 $15,316 $2,844 $5,678 $1,753 $1,789 $2,097 $4,794 $84,516 $67,237 $661,286
Enterprise Value / Forward EBITDA
Recent EV and Automotive Technology SPACs or Emerging Growth Players Established OEMs
’23E Median: 10.2x
’24E Median: 4.3x 23.4x
’25E Median: 5.4x 20.6x
15.1x 14.2x 14.1x
13.7x
8.2x 9.2x
4.8x 4.7x 5.4x 6.0x
2.6x 2.8x 2.1x 2.9x 3.0x
1.5x
NA NM NA NA NM NM NM NM NM NM NM
’23E ’24E ’25E ’23E ’24E ’25E ’23E ’24E ’25E ’23E ’24E ’25E ’23E ’24E ’25E ’23E ’24E ’25E ’23E ’24E ’25E ’21E ’22E ’21E ’22E ’21E ’22E ’21E ’22E
Source: Capital IQ, company filings, company presentations and select Wall Street research. Market data as of 3/12/2021.
Note: Multiples 50.0x are deemed not meaningful or “NM”. Multiples that are not available are denoted as “NA”. EBITDA is a non-GAAP metric.
Multiples for SPAC business combinations are pro forma for public company transactions that may not have closed and may include new shares issued for target and/or PIPE investors as disclosed in third-party investor presentations. Pro forma share count assumes no SPAC share redemptions for transactions that have not closed.
36ELMS Estimated Valuation Provides Opportunistic Entry Point At A Discount Relative To Peers
Enterprise Value Sensitivity
Transaction Value Comparable Valuation Sensitivity Analysis
$3.7B
$3.1B $3.0B
Midpoint
Indicative $2.8B
Enterprise
$2.3B Value
$1.2B
0.4x 2024E Revenue
0.6x 2024E Revenue 1.5x 2024E EBITDA
2.6x 2024E EBITDA(1)
Post-Money Enterprise Value 1.2x – 1.6x applied to 6.0x – 8.0x applied to
2024E Revenue of $1,906M 2024E EBITDA(1) of $465M
(1) EBITDA and EBITDA margin are non-GAAP metrics and based on current management estimates and current budget model.
37ELMS Has Multiple Potential Growth Vectors to Drive Long-Term Value Creation for Shareholders
Future Upside
Opportunities VOLUME • Increase Volume Ramp
• Mine and Monetize Data and Services • Broaden Customization Capabilities • Rental or Subscription Models
SOLUTIONS • Data to Reduce Fleet Insurance Costs • M&A • ZEV Credits
TECHNOLOGY • EPT Technology Development • Autonomous Solutions • Solid State Battery
PORTFOLIO
• Variances for Specific Applications
EXPANSION
GEOGRAPHIC • Accelerate Plan to Enter Markets in • Plan to Launch Vehicle for European • Manufacture and Distribute ELMS
EXPANSION Mexico and Canada Market Branded Vehicles in China
38Investment Highlights Summary – ELMS Positioned to Provide Most Efficient Last Mile Solutions
Significant Market Opportunity Driving Explosive Demand for Delivery Vehicles
$1 Trillion North American eCommerce Market has Driven the Need for Lower Cost Delivery and Fleet Efficiency
Favorable Environment Given Government and Corporate Green / Sustainability Initiatives
ELMS Positioned to Deliver Efficient Last Mile Solutions
ELMS To Offer Class 1 to 3 With Lower TCO and Space Advantages
Poised to Deliver First Electric Class 1 Vehicle – SOP Late Q3 2021
Lower TCO Includes Both Acquisition Price and Operating Costs
Proven Product Market Fit To Meet Last Mile Demands (1)
Product Design Leverages Existing, Proven and Reliable EV Platforms and Subsystems
(1)
30,000+ Platform EVs Sold in Asia – Over 1.5 Million Miles Driven Daily
(1)
Excellent Warranty Experience Based on Existing Field Data
Vehicle Integration Underway and Supply Chain of Key Systems in Place
Efficient Solution: Vehicle + Data/Software + Customization
Established and Agile Plant with a History of Quality Production and Experienced, Trained Workforce
90% Ready for Production, With Over 100k Production Capacity and Agile Vehicle Assembly Flexibility to Build Several Models
Re-Tooled for EV Production and Low Capital Required for Launch – Estimated $45M Investment in Plant
Light Assembly, Low Complexity Enables Low-Cost EV’s on Accelerated Timeframe
(2)
Large Pipeline of 45,000+ Pre-orders From Diverse Group of Customers
(2)
Verified Customer Interest with 45,000+ Pre-Orders Representing $1B+ of Anticipated Revenue
Integrated Upfitting Model Means Vehicles are Tailored and Customized to Customer Needs Inside Assembly Plant, Saving Time and Money
Finalizing Specific Use Case Solutions – Configurations, Data, Customization
Differentiated and Capital Efficient Business Model (3)
Estimated $160M to Launch With Short Timeline to Expected Profitability (Q4 2022) and Low Break-Even Volume (18,000 Units)
(3)
Attractive Valuation at $1.2B EV – 2.6x 2024 Estimated EBITDA, .6x 2024 Estimated Revenue
Experienced Leadership Team with Track-Record of Success and Execution
Deep Experience Across Global OEMs, EV Start-Ups and Technology Providers, With Proven Ability to Design, Develop and Commercially Produce At Scale
Co-Founder & CEO James Taylor Brings 30 Years at GM as President, Cadillac and CEO, Hummer; Co-Founder Jason Luo Formerly CEO of KSS and Ford China
(1) Refers to platform vehicles sold by Sokon Group. (2) As of March 16, 2021. Figure refers to signed pre-orders. Pre-Orders do not bind potential customers to purchase vehicles. Actual purchase orders require a separate binding commitment by a customer, following ELMS’ demonstration that the vehicle satisfies the customer’s requirements. (3) Based on current
business model and financial projections. 39Appendix: Forum Track Record
Case Study: Forum Merger I / ConvergeOne
Financial Overview (1)
($ in millions)
Company Overview
Revenue
ConvergeOne is a leading IT services provider of collaboration and technology solutions for large and Adj. EBITDA margin $160
medium enterprises
$139
Approximately 90%+ services renewal rate for Managed, Cloud and Maintenance (MC&M)
9,000+ customers and 2,700+ employees
Experienced management team with 25+ years of industry experience including public company experience
$88
$70
$59
Transaction Overview
$1.3 billion enterprise value representing ~8.3x 2018E adj. EBITDA vs. median comparable valuations >10.0x
Transaction funded through combination of newly issued Forum shares and cash including $144 million $492 $601 $816 $919 $1,500
raised from common stock private placement (“PIPE”) from institutional investors
2014 2015 2016 2017 2018E
Pre-existing ConvergeOne stockholders led by PE Sponsor Clearlake Capital (“Sellers”) retained approximately
55% at closing
Sellers and Forum Management had the potential to receive earnouts if certain criteria were met Investment Thesis
PF adj. EBITDA targets were $144 million, $155 million and $165 million in 2018, 2019 and 2020, respectively Industry with a large and growing total addressable market
─ Earnout consisted of 9.9 million shares and $99 million in cash, of which 100% had been earned by Company with history of growth and recurring revenue model
9/30/18
Company with large cap and deeply entrenched clients
─ Earnout included catch up payments for prior earnouts if the later earnouts were achieved
─ ConvergeOne was acquired for $1.8 billion by CVC Capital nine months after the merger, or $12.50 per Able to utilize company as a platform for future mergers and acquisitions
share, netting a return of 43.5% to investors who purchased units in Forum I’s IPO(2) Significant retained ownership by seller
Note: Adj. EBITDA margin is a non-GAAP metric.
(1) Source: ConvergeOne website (https://investor.convergeone.com/home/default.aspx) and Forum Merger/ConvergeOne SEC filings. 2018E Revenue and EBITDA represents midpoint of ConvergeOne’s 2018 financial expectations
(https://www.sec.gov/Archives/edgar/data/1697152/000119312518158306/d583890dex991.htm).
(2) Based on share purchased for $12.50, right for 1/10th share worth $1.25 and ½ warrant tendered for $0.60 in Forum I’s warrant tender.
41Case Study: Forum Merger II / Tattooed Chef
Financial Overview (1)
Company Overview ($ in millions)
Tattooed Chef is a leading plant-based food company with operations in the United States and Italy, offering Revenue
a broad portfolio of innovative plant-based food products Adj. EBITDA margin $31
Growth strategy includes expansion into supermarkets through existing and new retail customers for both
private label and branded products, development of innovative product offerings, and partnerships
opportunities in foodservice
$17
Transaction Overview
$482 million enterprise value representing 2.2x Tattooed Chef’s estimated 2021 net sales of $222 million, or
$7
15.6x Tattooed Chef’s estimated 2021 Adjusted EBITDA of $30.8 million
NM
Transaction funded through SPAC IPO proceeds. Pre-existing Tattooed Chef stockholders will be paid $75 $48 $85 $148 $222
million in cash consideration and roll-over shares are valued at approximately $344 million
2018 2019 2020E 2021P
Pre-existing Tattooed Chef stockholders retained approximately 80% of their equity, which will convert into
60% of the outstanding shares of the combined company at closing, assuming no redemptions by Forum’s Investment Thesis
public stockholders
Strong product positioning aligned with major consumer trends including plant-based, cleaner label, protein-
PF adj. EBITDA targets were $17.2 million and $30.8 million in 2020 and 2021, respectively rich, and organic
The ~$207mm in cash held in Forum’s trust account will be used to pay cash consideration to current Provides Tattooed Chef to strengthen balance sheet and continue to pursue attractive growth prospects
shareholders of Tattooed Chef and transaction expenses, with the remainder staying on the balance sheet to
fund the combined company’s growth and for general corporate purposes
Note: Adj. EBITDA margin is a non-GAAP metric.
42You can also read