Take Solutions Ltd. Initiating Coverage - Embracing change, TAKE a leap towards growth !! - Axis Direct
←
→
Page content transcription
If your browser does not render page correctly, please read the page content below
Initiating Coverage

                      Take Solutions Ltd.

Embracing change, TAKE a leap towards growth !!
                                          19 Dec 2018
19 Dec 2018 Company Report
BUY
Target Price: 178
CMP : Rs. 136
Potential Upside : 31%
MARKET DATA
No. of Shares : 14.79Cr.
Market Cap : 2011Cr
Take Solutions
Free Float : 727 Cr
Avg. daily vol (6mth) : 13970
52-w High / Low : Rs127/308
Bloomberg : TAKE:IN
Life Sciences Outsourcing
Promoter holding : 66.8%
Embracing change, TAKE a leap towards growth !!
Price performance
200
160
120
80
Dec-17 Mar-18 Jun-18 Sep-18 Dec-18
BSE Sensex Take Solutions
Financial Summary Shareholding pattern
Y/E Sales EBITDA PAT EPS Change RoCE DPS Sep-18 Q-o-Q Change Jun-18
P/E (x) RoE (%)
March (Rs Cr) (Rs Cr) (Rs Cr) (Rs) (%) (%) (Rs) Promoters 66.8 0.00 66.8
FY17 1345 262 146 11.2 6.9 - 19.1 20.7 1.0 FPIs 13.78 1.00 12.78
FY18 1587 306 160 12.2 9.3 - 14.1 16.9 1.5 MFs / AIF 1.44 (0.04) 1.48
FY19E 1996 397 214 14.6 19.4 9.2 14.9 18.5 1.5 Banks / FIs 0.2 0.02 0.17
FY20E 2404 474 264 17.8 22.0 7.5 15.6 19.8 2.0 Public 7.52 (0.49) 8.01
FY21E 2941 574 331 23.6 32.9 5.7 17.5 22.1 3.0 Others 10.27 (0.49) 10.76
Source: Company, Axis Securities CMP as on 18 Dec 2018
Kumar Nihal – Manager - Research | kumar.nihal@axissecurities.in | (+91 22 4267 1747) 2
19 Dec 2018         Company Report

                                                                                                              Take Solutions Ltd.
Investment Rationale                                                                                          Sector: Life Sciences Outsourcing

Incorporated in 2000, Take Solutions Limited(TSL) is a globally recognized technology service provider with distinct expertise across
Life Sciences (LS) and select niches in Supply Chain Management (SCM). In the fast-growing Life Sciences space, TSL offers services
ranging from Clinical Trials for innovative drugs, Bioavailability and bioequivalence (BA-BE) studies for generics drugs, regulatory
submissions and post marketing safety monitoring (Pharmocovigilance) backed by IP-based technology expertise. Headquartered in
Chennai, India with a global footprint spanning America, Europe and the APAC, TSL brings together the capabilities of a full-service
CRO (Contract Research Organization), a technology-led Life Sciences services provider, and expertise in analytics and data
sciences under its Life Sciences brand Navitas Life Sciences. TSL serves 9 out of top 10 Pharma Companies. It is represented by
1500+ professionals across 16 offices in 7 countries.

 We estimate revenue to grow at CAGR of 23% over FY18-FY21E and PAT to grow at CAGR of 30% over FY18-FY21E driven by:

                              Growth trajectory in Life Sciences segment following restructuring of TSL and focus on developing niche in Life
                              Sciences via domain expertise

                              Huge gamut of opportunity lying in Clinical business as development spending for R&D in the phase I - IV during
                              CY18 is estimated to be $93bn (~39% being outsourced)
   Take Solutions
  growth would be             Frequent changes in regulatory requirements leading to 11.5% CAGR over CY17-21E in regulatory submissions
     driven by                being outsourced

                              End-to-end BA & BE services to fast track in achieving client’s first to market strategy with its state-of-the art
                              USFDA compliant facilities in Manipal, Mangaluru, Bengaluru and Chennai

                              Focus on expansion with organic as well as inorganic growth, tangible assets addition is expected to be
                              Rs 200 Cr by FY20

    We initiate coverage with “BUY” rating with a target price of Rs 178 i.e. 31% upside (implies 10x FY20E)

                                                                                                                                                   3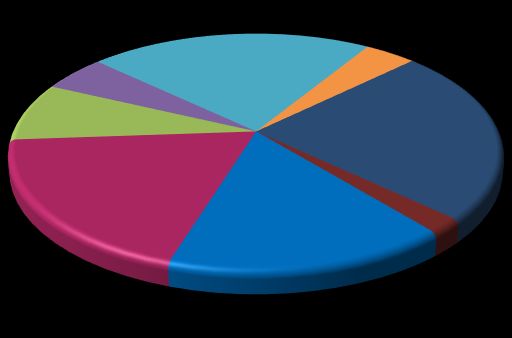
19 Dec 2018       Company Report

                                                                                    Take Solutions Ltd.
Investment Rationale                                                                Sector: Life Sciences Outsourcing

      Large addressable market                  Robust revenue growth               Patent expiry to drive Clinical Trials

The global Life Sciences R&D             TSL has grown at strong CQGR of           Global drug sales at risk is expected
expenditure is growing at 3.1%           8%+ for the last 12 quarters led by       to be $ 251 bn over CY18-24 due
CAGR and expected to reach $204          growing LS vertical (91% of Q2FY19        to patents expiration. Pharma
bn by CY24. R&D spend for the            revenue). Management expects 22-          companies are increasing R&D
CY18 is estimated to be $172 bn. In      24% annual revenue growth in this         spend to replenish the sales and
this gamut, development spending in      segment for next two financial years      bring new patent drug, thereby
the phase I to IV stands at $93bn as     which would be slightly offset by de-     increasing the need for Clinical
per Industry Standard Research           growth in SCM as TSL has                  Trials. Expiry of patent drugs and
(ISR), the business presence of TSL is   strategically exited two parts of SCM     government’s thrust for cost efficient
in outsourcing space which is ~39%       business and are in talks for getting     drug would generate demand for
of development spending i.e. $36         suitable deals for its last part, post    BA-BE studies to bring more generic
bn for CY18 Joseph
               and estimated to reach    which it will   be 100% LS business
                                                     Joseph                                    Josephbuilt the credentials to
                                                                                   drugs. TSL has
at $44bnHeading
            by CY21, representing a                Heading
                                         with strong  EBITDA margin of ~20%.                 Heading
                                                                                   help generics    client achieve first to
large addressable market for TSL.        TSL’s order book for Q2FY18 stood         market strategy with its state-of-the
                                         at $ 228 Mn, a growth of 48.5 %           art USFDA compliant facilities at
                                         YoY, pipeline visibility is expected to   multiple locations.
                                         be more than double the order book
                                         which may get reflected in order
                                         book in the next 3-4 months.

                                                                                                                          4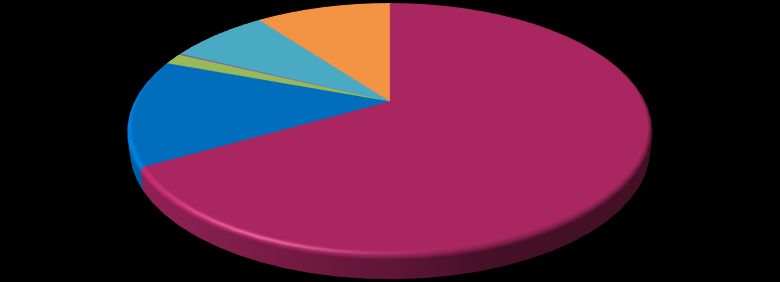
19 Dec 2018 Company Report
Take Solutions Ltd.
Investment Rationale Sector: Life Sciences Outsourcing
Domain Expertise Expansion
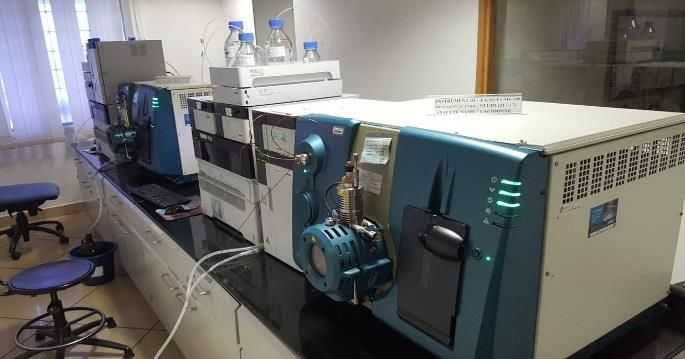
TSL has deep domain expertise in TSL’s focus is in on expanding Clinical
the LS segment with respect to sites and Lab infrastructure such as
consulting, technology (own as well investment in Liquid chromatography–
as third-party software mass spectrometry (LCMS) to serve
implementation) and outsourcing the growing demand from Life
services. A total of 30+ Sciences companies. Total tangible
experienced executives at senior asset addition is expected to be Rs
position were brought on board this 200 crore by FY20. Technology &
year. TSL has always relied on a automation is the differentiating factor
technology-driven approach and for the company and they are
investing on developing Intellectual
workforce include domain experts in
Joseph property. The
Josephexpansion plan would
clinical trials and drug development
Heading include Heading
organic growth via
process comprising Medical
investments as well as inorganic
doctors, PhDs or Bio-statisticians.
growth via acquisition. TSL is in talks
This results in higher quality work
for acquisition in North America
and sticky revenues which region, funding for which would be
differentiates TSL from a BPO done by internal accruals and is
company which relies on low-cost expected to be completed by the end
labour. of FY19.
5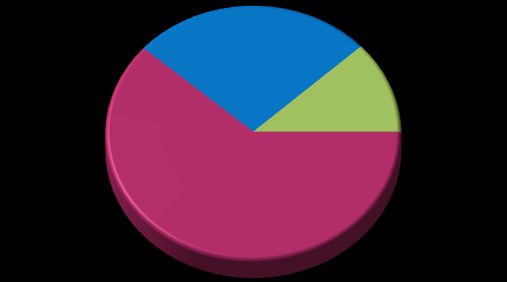
19 Dec 2018 Company Report
Take Solutions Ltd.
Global Life Sciences Industry Outlook Sector: Life Sciences Outsourcing
Worldwide total prescription drug sales 2011-2024
1200
1000
800 828
785
In $ bn
749
600 706
631 663
576 583 608
590 572 569 581 565
400
200 216 240 262
138 151 169 192
77 82 88 94 100 112 125
66 67 70 76 78 80 81 84 89 95 100 104 109 114
0
2011 2012 2013 2014 2015 2016 2017 2018 2019 2020 2021 2022 2023 2024
Source: EvaluatePharma Generics Orphan Presciption (exc. Generics)
Worldwide prescription drug sales
Worldwide prescription drug sales are expected to be US$1.2
New Molecule entities (NMEs) FDA approvals in
trillion in CY24.Global sales are forecast to grow at 6.4% CAGR 55
2017, rebounding from 27 in 2016
over CY17-24. This growth is in contrast to the 1.2 % CAGR in
CY11-17 Additional sales in 2024 from orphan drugs
$124bn
(commercially undeveloped)
With the arrival of the fourth industrial revolution, the life sciences
sector continues to embark on a transformative technology journey
2017-2024 CAGR for oncology
Companies, today, are preparing for the future by embracing +12%
Key (tumours studies/treatment))
these technologies and building a patient-centric culture. Strategic Drivers
alliances and new operating models are also contributing to $5bn Additional sales in 2024 from advanced therapies
overall growth in the sector
6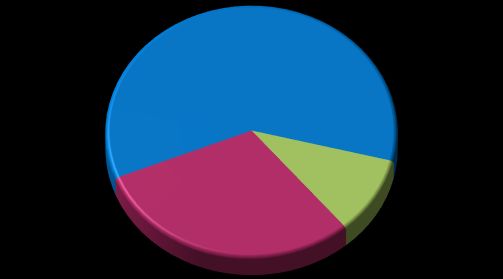
19 Dec 2018 Company Report
Take Solutions Ltd.
Growing R&D spend Sector: Life Sciences Outsourcing
Global pharma R&D to grow at 3.1% CAGR over CY17-24 NMEs approvals indicating increase in productivity
250 25% 60 35
21%
19% 17%
200 20% 50 30
25
150 15% 40
In $ bn
20
In $ bn
100 10% 30
15
20
50 5% 10
199
129
137
136
138
159
165
172
177
183
188
144
149
204
194
10 5
29
37
26
35
38
28
25
31
35
26
35
44
35
51
56
55
0 0%
0 0
2010
2011
2012
2013
2014
2015
2016
2017
2018
2019
2020
2021
2022
2023
2024
2002
2003
2004
2005
2006
2007
2008
2009
2010
2011
2012
2013
2014
2015
2016
2017
Global Pharma R&D spend (LHS) R&D as % of drug sales (RHS) New Molecule Entities(NMEs) USA sales 5yrs Post Launch ($bn)
(LHS) (RHS)
Worldwide pharmaceutical R&D spend totalled $165bn in 2017 Following the drop in CY16 NME approvals, CY17 suggests a
representing an increase of +3.9% on the previous year return to form in industry R&D productivity
Worldwide pharmaceutical and biotech R&D is forecast to grow at R&D value creation seems to be at an all-time high with total USA
3.1% CAGR over CY17-24, slightly lower than the 3.6% CAGR sales 5 years post launch for products approved in CY17 reaching $
over CY10-17. Total R&D spend is expected to reach US$204 33.2 bn
billion in CY24, compared to US$165 billion in CY17 Significant innovation is coming from small niche companies focused
The industry is increasingly looking towards employing big data on discovering new drugs. Less than 25% of drugs discovered are
and predictive analytics to improve R&D efficiency brought to market by the big pharmaceutical companies
Source: EvaluatePharma, Axis Securities
719 Dec 2018 Company Report
Take Solutions Ltd.
Technology accelerating R&D Sector: Life Sciences Outsourcing
The use of big data for evidence generation could vastly improve the speed and outcomes of clinical
development. Artificial Intelligence, real-world evidence (RWE), and robotic and cognitive automation are
expected to bring transformational change to R&D. These emerging technologies can improve study design,
physician and patient recruitment, and in-trial decision making as well as increase efficiency and accuracy in
repetitiveoftasks
Application RWE all the way through to regulatory filings.
in R&D
Support evidence generation across a product lifecycle
Understand
Help understand the burden of the disease, illuminate any unmet needs & provide
rare diseases epidemiological data
Reduce the cost and time it takes to execute a trial
Serving as a control
Demonstrate improvements in outcomes that are of interest to health plans and health
arm in clinical trial care providers
Supporting Compare before and after drug treatment data with clinical trial data to determine
label expansion any other potential indications
Expediting patent Ability to better track and connect with patients, allowing patient enrollment to occur
enrolment at the point of care
Expediting the development Potential to expedite assessment when there is no time or opportunity to conduct a
of life-saving treatments randomized clinical trial
819 Dec 2018 Company Report
Take Solutions Ltd.
Growing need for Outsourcing Sector: Life Sciences Outsourcing
Clinical Services Outsourced Vs In-house ratio 2017 Advantages of Outsourcing to Life Sciences Company
100%
(Sponsor)
18% 20% 0%
80% 40% 38% 28%
55% 55% 45%
60% Increased management bandwidth:
60%
100% To focus on core activities
40% 82% 80% 72%
60% 62% 55%
20% 40% 45% 45%
0% Reduced cost of drug development:
To remain competitive in the market
Lab Services
PDS
Regulatory
Late Stage CT
Stage CT
Trial Supplies
Staffing
management
Clinical
Biostatistics
Clinical
Affairs
Early
Central
Clinical
IT
Data
Reduced time to market:
Enables quick turn around time
Outsourced In-house
Source: PAREXEL biopharmaceutical sourcebook 2016/17
Outsourcing to take larger pie in increasing drug development market Growing Outsourcing Market Size
50
43.9
Safety (PV): 13.8 % CAGR 45 41.1
38.8
$ 1.94 bn (CY17) to $ 3.25 bn (CY21) 40 36.8
34.3
$ 34 bn 35 31.6
Regulatory: 11.5 % CAGR
(2017) $ 2.76 bn (CY17) to $ 4.2 bn (CY21) 30
in $ bn
25
Clinical: 5.2 % CAGR $ 44 bn
$ 29.7 bn (CY17) to $ 36.3 bn (CY21) 20
Clinical Trial (2021)
15
Regulatory Submission 10
PV 5
0
CY16 CY17 CY18 CY19 CY20 CY21
Source: ISR, Axis Securities Source: ISR, Axis Securities
919 Dec 2018 Company Report
Take Solutions Ltd.
Take Solutions Sector: Life Sciences Outsourcing
Introduction Shareholding (Sep-18)
Incepted in 2000, Take Solutions Limited (TSL) delivers domain- 7.52% 10.27%
0.2%
intensive, technology-led services in Life Sciences Industry(91%, 1.44%
Q2FY19) and Supply Chain Management(9%)
13.78%
Life Sciences: The company offers IP-based solutions in clinical, 66.8%
regulatory, safety and consulting processes to global Life
sciences companies across multiple therapeutic areas. Global
clients include large and small innovator biopharmaceutical
companies as well as generics manufacturers. TSL brings Promoters FPIs MFs / AIF Banks / FIs Public Others
together the capabilities of a full-service Contract Research Source: Company, Axis Securities
Organisation (CRO), a technology-led Life Sciences services Revenue Concentration by Segments
provider, and expertise in analytics and data sciences under its 100%
17% 12%
Life Sciences brand Navitas Life Sciences across North 29% 23%
80% 39%
America, Europe, Asia, and South America region.
60%
Supply Chain Management: TSL focuses on niches in 88%
40% 77% 83%
71%
engineering services, and supply chain collaboration. However 61%
20%
Company has decided to exit this business to focus on its
0%
expertise as niche service provider for Life Sciences.
FY14 FY15 FY16 FY17 FY18
Life Sciences Supply Chain Management
Source: Company, Axis Securities
1019 Dec 2018 Company Report
Take Solutions Ltd.
Global presence: 16 offices in 7 countries Sector: Life Sciences Outsourcing
Revenue contribution by region over FY16-18
FY16 FY17 FY18 FY16 FY17 FY18 FY16 FY17 FY18
74 % 79.3% 80.1% 9% 7.4% 6.5% 17% 13.3% 13.4%
01 America Europe 02 03 Asia Pacific
USA HQ: Princeton, NJ Europe HQ: Frankfurt, Germany APAC HQ: Chennai, India
Clinical, Regulatory & Safety consulting Major trial operations centre in Germany Clinical Operations (Incl. Generics) in
and technology centers. and sites through Europe in UK, Sweden, Bangalore, Chennai, Mangalore and
Trial operations through strategic Germany, Poland, Denmark, Russia and Manipal Regulatory & Safety operations
partnerships other locations hub in Chennai & Bengaluru
LATAM Delivery Centre: Bogota,
Columbia Regulatory & Safety support
across 9+ countries in region
Source: Company, Axis Securities
1119 Dec 2018 Company Report
Take Solutions Ltd.
Management Expertise & Industry Recognition Sector: Life Sciences Outsourcing
Mr. Ram Yeleswarapu Industry Recognition, Awards & Accolades
- A widely acknowledged industry thought leader, Ram Yeleswarapu co- - The Company’s domain centricity was recognized in the form of a
founded the organization’s Life Sciences business and has been a key
contributor to its growth. He leverages deep domain expertise from listing as ‘Leader’ in the prestigious IDC MarketScape: Drug Safety
over 25years of industry experience with large global pharmaceutical Services 2018 Vendor Assessment as one of only eight vendors
organizations
selected based on the MarketScape’s stringent research and due
Mr. Srinivasan HR diligence process.
- Gartner recognized TSL amongst Top 20 Global Solution Providers in
- Founder of TSL. He brings over 3 decades of leadership and has held
its Market Guide for Track-and-Trace and Serialization Software
significant leadership positions in organizations including the Shriram
Group, Sembcorp Logistics and Temasek Capital Providers for Life Sciences Companies
- Award-winning talent management practices continued to receive
Mr. D.V. Ravi accolades in the form of the Best Employer Brand for the second
- Co-founder of TSL. He is also the Managing Director of Shriram consecutive year at the World HRD Congress 2018, where it also
Capital, a financial services conglomerate with USD15 Billion AUM. ranked 3rd in the Times Ascent presents Dream Companies to Work For
His portfolio of expertise includes key areas of Corporate Strategy,
Finance and Leadership Development. He has an exemplary track category
record of value creation across several enterprises - Earned a place in the Great Place to Work global listing, the global
authority on building, sustaining and recognizing exemplary workplace
Mrs. Subhasri Sriram
culture and best practices
- Has over 25 years of experience in Financial Services and has served - ISO 9001:2015 for Quality management systems, ISO 27001:2013
in key leadership positions in the Shriram Group. She was the CFO of
for Information Security Management, NABL (ISO 15189:2012)
the USD2.4 Billion Shriram City Union Finance. She has expertise in
setting up strong governance systems and transparent processes. She accreditation for clinical laboratory
was recognized as one of the most influential CFOs in India by
Chartered Institute of Management Accountants in 2016
Source: Company, Axis Securities
1219 Dec 2018 Company Report
Take Solutions Ltd.
Evolution from Supply Chain to Life Sciences Sector: Life Sciences Outsourcing
Successfully exited from
two SCM units, a 100%
TAKE Solutions was
owned unit in the US and a
founded in Chennai,
Middle East Joint venture
India as a software
Acquired UK-based WCI Consulting Group, a with the WJ Towell Group
products company
Acquired Ecron
leading patient safety and compliance advisor to the in Oman
focused on Supply Acunova, a full-
Chain Management Life Sciences industry service CRO with TSL would be 100% Life
Launched SafetyReady to increase the efficiency of Clinical & BA/BE Sciences Outsourcing
Inaugurated North
Oracle Argus Safety Suite for Life Sciences capabilities Company post its exit from
American headquarters
its APA engineering Joint
at Princeton, New Recognized as a Leader in IDC MarketScape: 100th pharmaRea- Venture
Jersey, USA Worldwide Life Sciences R&D IT Outsourcing 2011 dy customer win
2000-04 2007-10 2011-14 2015 2016 2017 2018
Acquired OnSphere Corporation, North Carolina, USA, Launched cdsnet, a proprietary Consolidated Life Sciences businesses under the
an IP-driven leader in regulatory compliance for Life industry network on Clinical Data brand Navitas Life Sciences to provide full
Sciences Strategy services across Clinical, Regulatory and Safety
Launched OneSCM, a multi-tenant SaaS platform to Launched India’s first propriety Launched Labeling Assessment Express to
improve enterprise supplier management industry network on improve End-to-End labeling for Life Sciences
pharmacovigilance, pvindia
Acquired ClearOrbit, a Supply Chain Management Celebrated the landmark 15th year of proprietary
software company in Austin, Texas, USA Life Sciences industry network forums
Registered a successful IPO and listed on BSE & NSE
1319 Dec 2018 Company Report
Take Solutions Ltd.
Life Sciences drug development landscape Sector: Life Sciences Outsourcing
Manufacturing: Approved drugs
Mfg.
are mass produced & sold to the
Regulatory Submission
public
Safety of drug in monitored
Safety Monitoring
and reported regularly as
long as drug is in the market
Safety Monitoring: The molecule is
monitored and adverse events are
reported at each stage ~ 1/10000 identified
compounds are approved
Human Trials
Regulatory Submission: The
findings are submitted to the Phase I 10s Volunteers
CT
regulator for approval at each Phase II 100s Patients
stage Phase III & IV 1000s Patients
Animal Trials
CT
Clinical Trials (CT): The molecule
is tested for its safety & efficacy
Research
Basic Research: Molecule
formulation is identified to combat
a disease
1419 Dec 2018 Company Report
Take Solutions Ltd.
Role of Take Solution in Life Sciences business Sector: Life Sciences Outsourcing
Take Solutions’ Business presence
Manufacturing: Approved drugs
Mfg.
are mass produced & sold to the
public
Regulatory Submission
Safety Monitoring
Industry Growth
Size 2021
2017 (CAGR%)
Safety Monitoring: The molecule is Safety
monitored and adverse events are $1.9bn $3.2bn (13.8)
monitoring
reported at each stage
Regulatory
$2.8bn $4.3bn(11.5)
submissions
Regulatory Submission: The Clinical
$29.7bn $36.4bn (6%)
Trial
findings are submitted to the
CT
regulator for approval at each
stage
CT
Clinical Trials (CT): The molecule
is tested for its safety & efficacy
Research
Basic Research: Molecule
formulation is identified to combat
a disease
Source: ISR, Axis Securities
1519 Dec 2018 Company Report
Take Solutions Ltd.
Take Solution Service Mix Sector: Life Sciences Outsourcing
TSL Revenue breakup (FY18) Supply Chain Management (SCM)
TSL started as a software products company focused on Supply
Chain Management (SCM). SCM lacked differentiation despite
presenting growth and better pricing was difficult to come by, so
TSL strategically decided to exit this business. SCM contributed
59% 29% 12% to the FY18 revenues which has come down to 9% for
12% 88%
H1FY19 and is expected to be phased out by end FY19
11%
SCM business has three parts and TSL have successfully exited from
two of them and are in the process of a finding a suitable
transaction for the third one
Regulatory & PV Clinical
Life Sciences Supply Chain Management
Nets & Consulting
Life Sciences (LS)
Source: Company, Axis Securities Clinical Trial services Regulatory Offerings Safety Services /PV
TSL moving towards 100% Life Sciences
Strategic clinical Regulatory consulting Strategic Safety
100% consulting Global submission Consulting
17% 17% 14% 13% 12% 9% 9% 9% Full service Clinical management and Safety Industry
80% trials report publishing Networks
60% Medical Imaging Medical writing End-to-End
87% 88% 91% 91% 91% Services License maintenance Pharmacovigilance
40% 83% 83% 86%
Bioavalibility & for marketed product (PV) Services
20% Bioequivalence Application Pharmacovigilance
Studies management services Technology
0%
Biologics & Industry networks:
Q3FY17
Q4FY17
Q1FY18
Q2FY18
Q3FY18
Q4FY18
Q1FY19
Q2FY19
Biosimilars Studies CCDS, labeling, and
Non-interventional artwork
Studies
Clinical data Sevices
Life Sciences Supply Chain Management
One Clinical platform
Source: Company, Axis Securities
1619 Dec 2018 Company Report
Take Solutions Ltd.
Extensive Expertise in Life Sciences Sector: Life Sciences Outsourcing
250+ 8% All 20+ Non- 10 Unique
350+ Validated Submission interventional proprietary Life
Clinical Bioanalytical to USFDA Studies Sciences Industry
Trials Methods in 2017 annually networks
1000+ 120,000+ 300+ Safety 7% of all Biosimilars 120 members
BABE Lab Submissions with Consulting studies in India in in Network
Studies 0 refusal to file Engagements 2017 forums
Life Sciences driving the growth: 8%+ CAQR growth for last 12 quarters
TSL has always relied on a
250 221 OneClinical technology-driven approach
190 and workforce include domain
200
151 pharmaREADY experts in clinical trials and
141 141
In USD Mn
150 134 drug development process,
Unique comprising Medical doctors,
traceREADY
100 64 64 67 technology PhDs or Bio-statisticians. This
47 50 55
50 IPs labelREADY results in higher quality work
driving Life and sticky revenues which
0 affiliateREADY differentiates TSL from a BPO
Q1FY18 Q2FY18 Q3FY18 Q4FY18 Q1FY19 Q2FY19 Sciences company which relies on low-
safetyREADY cost labour
LS order book LS revenue
Source: Company, Axis Securities
1719 Dec 2018 Company Report
Take Solutions Ltd.
TSL to leverage opportunity created from Patent Expiration Sector: Life Sciences Outsourcing
Drug Sales at Risk from Patent Expiration Patent drugs: R&D spend to replenish pipelines
80
6%
7% Global sales at risk from expiry of patent drugs is expected to
70 6% be $ 251bn over CY18-24. Global pharma companies are
5% 5%
60 increasing R&D spend for new patent drugs to replenish lost
5%
50
4% sales
4%
In $ bn
40
2% 2% 2%
3% Small niche companies leading the innovation on discovering
30
2% new drugs. Less than 25% of drugs discovered are brought to
20
market by the big pharmaceutical companies
10 1%
39 26 43 23 17 19 17 15 41 15 67 22 27 19
0 0% TSL would leverage on these tailwinds providing full fledged
2018 2019 2020 2021 2022 2023 2024
outsourcing services for faster and cost effective clinical trials to
Total Sales at Risk Expected Sales Lost % Market at Risk sponsor companies
Source: EvaluatePharma, Axis Securities
World-class bioequivalence facilities State-of-the art Generics: Large gamut of opportunity
Bio analytical capabilities
TSL’s would also benefit as patent expiry along with government
48 bed clinical thrust for cost efficient drug would generate demand for BA-BE
Pharmacology Unit
studies
Bioanalytical Lab
Manipal Bioanalytical Lab
Bangalore TSL has the ability to help generics client achieve first to market
strategy with its state-of-the art USFDA compliant facilities at
Mangalore multiple locations
TSL Conducted 7% of All Biosimilars Trials in India in 2017
80 bed clinical Chennai 80 bed clinical
Pharmacology Unit Pharmacology Unit
Source: Company, Axis Securities
1819 Dec 2018 Company Report
Take Solutions Ltd.
Increasing share of Clinical business to continue Sector: Life Sciences Outsourcing
Revenue breakup of Life Sciences business
80% of the outsourcing growth
FY16 FY17 FY18 FY21E opportunity lies within Clinical
business; being highly
27% 29% 60% underpenetrated, entry barriers
5%
15% like multiple regulatory
12% 11% requirements and high domain
knowledge positions TSL to reap
the benefits of growing pie
10%
80% 61% 59% The margins in Clinical business
30%
is healthy at 16-18%, though
lower than regulatory & PV
segments
Regulatory & PV Clinical Nets & Consulting
Clinical business would continue to grow its share in revenue and management plans to have ~60% revenue share from Clinical Trials by FY21E
OneClinical: Patent technology TSL presence across 20+ therapeutic areas to increase further
20% Top Drug sales by growth (2017-24 CAGR)
Optimized eClinical and Analytics Clinical Trials Management Platform
16%
Offers Comprehensive Trial Oversight and Enables Faster Decisions
12%
8%
OneClinical 4%
0%
Reduces Cost of Lower risk of trial quality
Trial by 25% issue by 20%
Owing to lower feet on With early detection and
ground monitoring mitigation
TSL is present in 4 of the top 5 therapy areas by growth
1919 Dec 2018 Company Report
Take Solutions Ltd.
Domain expertise in Regulatory Submissions & Pharmacovigilance (PV) Sector: Life Sciences Outsourcing
Regulatory Submissions and PV are high margin (22-25%) business segments for TSL due to in-depth subject matter expertise, competencies and
technology enabling them being cost efficient
Technology Solutions
Regulatory Submissions Pharmacovigilance
A fully integrated web-based A next generation mobility platform Affiliate compliance, An accelerated solution for
eDMSand eCTD Submissions that enables easy implementation oversight and implementation, upgrade and
with over 150 clients of SOPs and audit readiness with dashboarding tools migration for Oracle’s Argus
accurate data at all times Services Safety suite
Frequent changes in regulatory requirements leading to 11.5% CAGR in Pharmacovigilance Market will register 13%+ CAGR
regulatory submissions being outsourced over CY17-21 to touch $8 billion by CY24
Regulatory Submissions & PV market to continue uptrend Expertise led by qualified personnel mix
Computer Science Engineering
4%
TSL enables almost 50% of the global regulatory submissions 5% 22%
Engineering Graduates
for a top global pharma company and 8% of the total MBA Graduates
regulatory submissions to USFDA (between 2012 and 2017) 8%
24%
were through TSL Others
19% Pharma Graduates
The global pharmacovigilance market is expected to rise 16% Science Engineering Graduates
significantly due to compulsory pharmacovigilance activities 2% Arts & Science Graduates
that are being rigorously implemented
CA's
Source: Company (FY17), Axis Securities
2019 Dec 2018 Company Report
Take Solutions Ltd.
Proprietary Industry Networks developed to be the key differentiator Sector: Life Sciences Outsourcing
TSL has built strong moat for itself through its proprietary networking forums (NETS), a subscription based platforms for senior life sciences
professionals to discuss Industry wide issues. These NETS are difficult to replicate providing TSL’s competitive advantage with respect to access
to over 16 years of industry benchmark data and global client acquisitions
For Heads of Safety of Top 30 Life Sciences companies; invests in thought leadership to help shape future practices
For Heads of Information Technology for PV departments, focused on increasing business value from technology
For Heads of Safety of mid-sized Life Sciences companies with a range of product portfolios including one or more of Pharma,
Biologicals, Consumer, and Medical Devices
For PV leads of Life Sciences companies in the APAC region with Pharma, Consumer, Generics, or mixed portfolios
For Chief Medical Officers; addressing strategic and governance topics within the remit of the CMO
For Labeling Professionals; focused on the full lifecycle of labeling
For Regulatory Information Management(RIM) professionals to develop best practices and leading edge solutions
For Regulatory or Labeling IT Professionals; focused on exploring E2E Labeling technologies to improve processes and
increase business value
For Labeling Leaders of Life Sciences companies with a specific focus on operational aspects of the full lifecycle of E2E
labeling
For Heads of Clinical Operations, focused on sharing best practice to define excellence in delivery of clinical trials
2119 Dec 2018 Company Report
Take Solutions Ltd.
Clients include 9 out of top10 Pharma Companies Sector: Life Sciences Outsourcing
Large Innovators Small/Mid Innovators Generics Others
Generics are bio-pharma companies that Others includes medical devices companies,
Innovators are bio pharma companies that discover new drugs
produce existing drugs after patent expires academia & CROs
Source: Company, Axis Securities
2219 Dec 2018 Company Report
Take Solutions Ltd.
Competitive positioning: No Indian Competitors for LS services Sector: Life Sciences Outsourcing
Leader in IDC market space: Worldwide Life Sciences Technology Peers
R&D BPO Services 2018 Vendor Assessment In terms of Technology TSL has been positioned as leader in
comparison to IT companies by IDC in Life Sciences R&D BPO services
Clinical business Peers
Global CRO peers have EBIT margin of ~12%-15% whereas as TSL
commands ~16-18% margin in its Clinical business enabled by its
patent IP based ‘OneClinical’ near real-time platform enabling faster
decision making and minimizing risks to trial success.
There are no competitors of TSL in India offering full fledged Life
Sciences services
EBIT Margin Comparaison (Global Peers CY17)
24% 18.20%
14.40% 14.80%
16% 11.60% 10.70%
8%
0%
TFS ICON Medpace Parexel Take Solutions
(2016) (2016)
Source: Company, Axis Securities
Global Peers
EPS PE EV/Ebidta RoE EPS
MCAP USD$ Million 1Y Fwd 2Y Fwd 3Y FWD 1Y Fwd 2Y Fwd 3Y FWD 1Y Fwd 2Y Fwd 3Y FWD 1Y Fwd 2Y Fwd 3Y FWD CAGR%
Take Solutions Ltd 277 14.6 17.8 23.6 9.2 7.5 5.7 4.0 2.8 1.8 14.9 15.6 17.4 24.37
IQVIA Holdings Inc 24191 5.52 6.26 7.09 21.65 19.09 16.87 15.43 14.36 13.23 11.83 12.96 15.45 13.28
PRA Health Sciences Inc 6757 4.25 4.91 5.63 24.48 21.18 18.46 17.00 14.99 13.23 26.37 26.83 28.49 15.13
Syneos Health Inc 5153 2.74 3.17 3.63 18.23 15.76 13.76 13.30 12.05 11.02 8.00 9.98 11.88 15.11
Veeva Systems Inc 13238 1.48 1.72 2.00 61.93 53.24 45.77 41.60 34.82 29.15 25.33 20.48 20.35 16.32
Medidata Solutions Inc 4505 1.63 1.84 2.30 45.22 39.99 32.04 28.91 23.58 19.00 18.01 16.77 17.97 18.79
Source: Reuters, Axis Securities
2319 Dec 2018 Company Report
Take Solutions Ltd.
Performance delivery post restructuring Sector: Life Sciences Outsourcing
Revenue (Rs Cr) Growth trajectory led by Life Sciences to continue
4,000
2,941 TSL posted revenue CAGR of 10% over FY11-FY15 as company
3,000 2,404 identified the opportunity in Life Sciences and started building
1,996
In Rs Cr.
1,587 domain expertise
2,000 1,345
816 1,030
1,000 730 TSL started delivering results of restructuring process from Supply
Chain towards Life Sciences by reporting CAGR of 29% over FY15-
0
18 and it is expected to grow at 23% CAGR over FY18-21E
FY14 FY15 FY16 FY17 FY18 FY19E FY20E FY21E
EBITDA & PAT (Rs Cr) Robust EBITDA and PAT led by top line growth
600 574
474 EBITDA/PAT were subdued due to low margin SCM business. Post
450 397 transformation into full service LS business, TSL witnessed robust
306 331
In Rs Cr.
300 213
262
214
264 EBITDA/PAT growth of 27%/31% over FY16-18
147 149 120 146 160
150 58 70
We expect growth opportunity provided in Life Sciences to help TSL
0 grow EBITDA/PAT at 23%/30% over FY18-21E. Robust growth to
FY14 FY15 FY16 FY17 FY18 FY19E FY20E FY21E be slightly offset by de-growth in SCM business as a strategic
EBITDA PAT decision of TSL to sell SCM business
EBITDA & PAT margin Premium margins due to domain expertise
18.1% 20.5% 20.7% 19.5% 19.3% 19.9% 19.7% 19.5% TSL commands premium margins led by Regulatory Submissions and
20% PV segments (22%-25%) due to in-depth subject matter expertise,
15% 11.6% 10.9% competencies and technology enabling them being cost efficient
9.6% 10.1% 10.7% 11.0% 11.3%
10% 7.1%
Clinical business margins are comparatively lower to regulatory &
5% PV segments, however, near real time technology enables TSL earn
FY14 FY15 FY16 FY17 FY18 FY19E FY20E FY21E higher margin(16-18%) over its peers. As clinical business
EBITDA Margin(%) PAT Margin (%) segment’s revenue share increases to over 60% by FY21E we
expect muted growth in margins although growth in absolute
Source: Company, Axis Securities amount would be robust
2419 Dec 2018 Company Report
Take Solutions Ltd.
Key Financials Sector: Life Sciences Outsourcing
Healthy return ratios Reducing Client concentration
25% 23%
22% Both ROCE and ROE have 28%
21% 30% 26% While most of the large
20% been maintained at 24%
18% 23% Pharma companies are
20% 17% healthy levels.
25% 22%
20% 19% TSL’s Client, revenue
After a dip due 20% 18%
14% 16% 16% 15% concentration from top
15% 19% 17% incremental gross asset
15% clients is continuously
15% 16% addition for expansion
14% decreasing.
10% 12% impacting asset turnover, 10% TSL winning more clients
ROE has started to indicates diversification
5% improve as benefit of of risk and low
FY15 FY17 FY19E FY21E restructuring begin to dependence on top
occur clientele
Revenue from Top 5
RoE RoCE
Revenue from Top 10
Operating Cash Flows to increase Receivable days in line with Industry*
TSL has generated strong 250
350 operating cash flow and 200 TSL’s gross receivable
funding for expansion 200 days are well in line with
300
would be met by internal 154
No. of days
135 the industry average
250 accruals 150 122 117 TSL does not seek large
Decline in FY17 was due 90 up-front payments for
200 100 78
In Rs Cr
to acquisition of EAL in studies which increases its
150 FY16 and increase in net working capital
50
working capital led by requirement
100
higher DSO & lower DPO 0 The focus of TSL is on
50 days to support clinical building strong customer
segment relationship which would
0 We expect operating CF bear fruits in coming years
of TSL to grow at a CAGR
of 24% over FY18-21E
Source: Company, Axis Securities * Gross receivable days (Without adjusting for customer advances)
2519 Dec 2018 Company Report
Take Solutions Ltd.
Valuation Charts Sector: Life Sciences Outsourcing
PE Band Valuation
350 We estimate TSL to post revenue growth at a CAGR of 23%
300 and profits at CAGR of 30% over FY18-21E. Given the size of
250 TSL’s revenue compared to global peers, its domain expertise
200
In Rs
and the opportunities available, we feel TSL is a small fish in a
150 big pond
100
50
0 We value TSL at 10x FY20E given the growth prospects to
arrive at a target price of Rs 178 (31 % upside). The valuations
Mar-13
Mar-14
Mar-15
Mar-16
Mar-17
Mar-18
Jul-13
Nov-13
Jul-14
Nov-14
Jul-15
Nov-15
Jul-16
Nov-16
Jul-17
Nov-17
Jul-18
Nov-18
are conservative as TSL is trading at lower valuations compared
to global peer, with coming quarters’ performance at par with
expectations, TSL has the potential to be re-rated at higher
Price 5x 10x 15x 18x multiple
12mth fwd P/E (x) Key Risks and Concerns
20 TSL enjoys patent ‘OneClinical’ technology which enables them
to command premium margins. As competitors comes up with
15 similar technology, it would affect TSL’s USP
10 There are no domestic peers offering full Life Sciences services
but domestic players offering select services are scaling up
5 their services, this along with increasing competition from
global peers would be major challenge for TSL
0
Jul-16
Mar-13
Jul-13
Mar-14
Jul-14
Mar-15
Jul-15
Mar-16
Mar-17
Mar-18
Jul-17
Jul-18
Nov-13
Nov-14
Nov-15
Nov-16
Nov-17
Nov-18
Higher working capital requirements potent risk for TSL
PE Mean Mean+1Stdev Mean-1Stdev
Source: Company, Axis Securities
2619 Dec 2018 Company Report
Take Solutions Ltd.
Financials (Consolidated) Sector: Life Sciences Outsourcing
Profit & Loss (Rs Cr) Balance Sheet (Rs Cr)
YE March FY17 FY18 FY19E FY20E FY21E YE March FY17 FY18 FY19E FY20E FY21E
Net sales 1,345 1,587 1,996 2,404 2,941 Total assets 1,209 1,682 1,933 2,240 2,593
Other operating income 0 0 0 0 0 Net Block 319 349 353 261 170
Total income 1,345 1,587 1,996 2,404 2,941 CWIP 6 1 7 3 3
Cost of revenue 396 457 567 685 841 Goodwill 235 240 240 240 240
Gross margin (%) 70.5% 71.2% 71.6% 71.5% 71.4% Investments 13 13 13 13 13
Other expense 299 377 459 692 850
Wkg. cap. (excl cash) 508 680 836 1,003 1,173
Employee Expense 387 447 573 553 677
Cash / Bank balance 110 341 425 662 937
Operating Profit 262 306 397 474 574
Other income 13 6 22 20 20 Other assets 18 59 59 59 59
PBIDT 275 313 419 494 594 Capital employed 1,209 1,682 1,933 2,240 2,593
Depreciation 87 104 136 146 141
Equity capital 13 15 15 15 15
Interest & Fin Chg. 23 21 23 26 27
Reserves 898 1,314 1,529 1,792 2,141
E/o income / (Expense) 0 0 0 0 0
Pre-tax profit 165 188 260 321 425 Pref. Share Capital 0 0 0 0 0
Tax provision 19 28 44 58 77 Minority Interests 42 8 8 8 8
(-) Minority Interests 3 (1) 0 0 0 Borrowings (Short term
221 308 334 375 376
& Long term)
Associates 0 0 0 0 0
Def tax Liabilities 23 34 43 46 49
Adjusted PAT 143 160 216 263 349
Reported PAT 143 160 216 263 349 Other Liabilities 12 4 4 4 4
Source: Company, Axis Securities
2719 Dec 2018 Company Report
Take Solutions Ltd.
Financials (Consolidated) Sector: Life Sciences Outsourcing
Cash Flow (Rs Cr) Ratio Analysis (%)
YE March FY17 FY18 FY19E FY20E FY21E YE March FY17 FY18 FY19E FY20E FY21E
Sales growth 30.5 18.0 25.7 20.4 22.4
Sources 343 496 313 358 434
OPM 19.5 19.3 19.9 19.7 19.5
Cash profit 256 285 375 436 517
Oper. profit growth 22.9 16.9 29.6 19.2 21.1
(-) Dividends 16 27 27 35 49 COGS / Net sales 29.5 28.8 28.4 28.5 28.6
Retained earnings 240 257 347 401 468 Overheads/Net sales 22.3 23.8 23.0 28.8 28.9
Depreciation / G. block 21.7 19.3 20.0 20.0 18.0
Issue of equity 1.1 1.5 0.0 0.0 0.0
Effective interest rate 8.4 7.9 7.3 7.4 7.3
Change in Oth. Reserves 175 218 0.0 0.0 0.0
Borrowings (19) 6 (20) (20) (10) Net wkg.cap / Net sales 0.30 0.37 0.38 0.38 0.37
Others (54) 14 (15) (23) (24) Net sales / Gr block (x) 3.3 2.9 2.9 3.3 3.8
RoCE 20.7 16.9 18.5 19.8 22.1
Debt / equity (x) 0.24 0.23 0.22 0.21 0.17
Applications 343 496 313 358 434
Effective tax rate 11.4 15.0 17.0 18.0 18.0
Capital expenditure 134 157 146 50 50 RoE 19.1 14.1 14.9 15.5 17.4
Investments (12) 50 0 0 0 Payout ratio (Div/NP) 10.7 17.2 12.7 13.3 13.9
EPS (Rs.) 11.2 12.2 14.6 17.8 23.6
Net current assets 270 39 111 106 158
EPS Growth 6.9 9.3 19.4 22.0 32.6
Change in cash (18) 231 56 202 226
CEPS (Rs.) 18.1 17.8 23.7 27.7 33.1
Others (32) 20 0 0 0 DPS (Rs.) 1.0 1.5 1.5 2.0 3.0
Source: Company, Axis Securities
2819 Dec 2018 Company Report
Take Solutions Ltd.
Disclaimer Sector: Life Sciences Outsourcing
Disclosures:
The following Disclosures are being made in compliance with the SEBI Research Analyst Regulations 2014 (herein after referred to as the Regulations).
1. Axis Securities Ltd. (ASL) is a SEBI Registered Research Analyst having registration no. INH000000297. ASL, the Research Entity (RE) as defined in the Regulations, is engaged in the business of
providing Stock broking services, Depository participant services & distribution of various financial products. ASL is a subsidiary company of Axis Bank Ltd. Axis Bank Ltd. is a listed public
company and one of India’s largest private sector bank and has its various subsidiaries engaged in businesses of Asset management, NBFC, Merchant Banking, Trusteeship, Venture Capital,
Stock Broking, the details in respect of which are available on www.axisbank.com.
2. ASL is registered with the Securities & Exchange Board of India (SEBI) for its stock broking & Depository participant business activities and with the Association of Mutual Funds of India (AMFI) for
distribution of financial products and also registered with IRDA as a corporate agent for insurance business activity.
3. ASL has no material adverse disciplinary history as on the date of publication of this report.
4. I/We, Kumar Nihal – Manager, Research, MBA (Finance), author/s and the name/s subscribed to this report, hereby certify that all of the views expressed in this research report accurately reflect
my/our views about the subject issuer(s) or securities. I/We (Research Analyst) also certify that no part of my/our compensation was, is, or will be directly or indirectly related to the specific
recommendation(s) or view(s) in this report. I/we or my/our relative or ASL does not have any financial interest in the subject company. Also I/we or my/our relative or ASL or its Associates may
have beneficial ownership of 1% or more in the subject company at the end of the month immediately preceding the date of publication of the Research Report. Since associates of ASL are
engaged in various financial service businesses, they might have financial interests or beneficial ownership in various companies including the subject company/companies mentioned in this
report. I/we or my/our relative or ASL or its associate does not have any material conflict of interest. I/we have not served as director / officer, etc. in the subject company in the last 12-month
period.
Any holding in stock – No
5. ASL has not received any compensation from the subject company in the past twelve months. ASL has not been engaged in market making activity for the subject company.
6. In the last 12-month period ending on the last day of the month immediately preceding the date of publication of this research report, ASL or any of its associates may have:
i. Received compensation for investment banking, merchant banking or stock broking services or for any other services from the subject company of this research report and / or;
ii. Managed or co-managed public offering of the securities from the subject company of this research report and / or;
iii. Received compensation for products or services other than investment banking, merchant banking or stock broking services from the subject company of this research report;
ASL or any of its associates have not received compensation or other benefits from the subject company of this research report or any other third-party in connection with this report.
Term& Conditions:
This report has been prepared by ASL and is meant for sole use by the recipient and not for circulation. The report and information contained herein is strictly confidential and may not be altered in
any way, transmitted to, copied or distributed, in part or in whole, to any other person or to the media or reproduced in any form, without prior written consent of ASL. The report is based on the
facts, figures and information that are considered true, correct, reliable and accurate. The intent of this report is not recommendatory in nature. The information is obtained from publicly available
media or other sources believed to be reliable. Such information has not been independently verified and no guaranty, representation of warranty, express or implied, is made as to its accuracy,
completeness or correctness. All such information and opinions are subject to change without notice. The report is prepared solely for informational purpose and does not constitute an offer document
or solicitation of offer to buy or sell or subscribe for securities or other financial instruments for the clients. Though disseminated to all the customers simultaneously, not all customers may receive this
report at the same time. ASL will not treat recipients as customers by virtue of their receiving this report.
2919 Dec 2018 Company Report
Take Solutions Ltd.
Disclaimer Sector: Life Sciences Outsourcing
DEFINITION OF RATINGS
Ratings Expected absolute returns over 12-18 months
BUY More than 10%
HOLD Between 10% and -10%
SELL Less than -10%
NOT RATED We have forward looking estimates for the stock but we refrain from assigning valuation and recommendation
UNDER REVIEW We will revisit our recommendation, valuation and estimates on the stock following recent events
NO STANCE We do not have any forward looking estimates, valuation or recommendation for the stock
Disclaimer:
Nothing in this report constitutes investment, legal, accounting and tax advice or a representation that any investment or strategy is suitable or appropriate to the recipient’s specific circumstances.
The securities and strategies discussed and opinions expressed, if any, in this report may not be suitable for all investors, who must make their own investment decisions, based on their own
investment objectives, financial positions and needs of specific recipient.
This report may not be taken in substitution for the exercise of independent judgment by any recipient. Each recipient of this report should make such investigations as it deems necessary to arrive at
an independent evaluation of an investment in the securities of companies referred to in this report (including the merits and risks involved), and should consult its own advisors to determine the merits
and risks of such an investment. Certain transactions, including those involving futures, options and other derivatives as well as non-investment grade securities involve substantial risk and are not
suitable for all investors. ASL, its directors, analysts or employees do not take any responsibility, financial or otherwise, of the losses or the damages sustained due to the investments made or any
action taken on basis of this report, including but not restricted to, fluctuation in the prices of shares and bonds, changes in the currency rates, diminution in the NAVs, reduction in the dividend or
income, etc. Past performance is not necessarily a guide to future performance. Investors are advice necessarily a guide to future performance. Investors are advised to see Risk Disclosure Document
to understand the risks associated before investing in the securities markets. Actual results may differ materially from those set forth in projections. Forward-looking statements are not predictions and
may be subject to change without notice.
ASL and its affiliated companies, their directors and employees may; (a) from time to time, have long or short position(s) in, and buy or sell the securities of the company(ies) mentioned herein or (b)
be engaged in any other transaction involving such securities or earn brokerage or other compensation or act as a market maker in the financial instruments of the company(ies) discussed herein or
act as an advisor or investment banker, lender/borrower to such company(ies) or may have any other potential conflict of interests with respect to any recommendation and other related information
and opinions. Each of these entities functions as a separate, distinct and independent of each other. The recipient should take this into account before interpreting this document.
ASL and / or its affiliates do and seek to do business including investment banking with companies covered in its research reports. As a result, the recipients of this report should be aware that ASL
may have a potential conflict of interest that may affect the objectivity of this report. Compensation of Research Analysts is not based on any specific merchant banking, investment banking or
brokerage service transactions. ASL may have issued other reports that are inconsistent with and reach different conclusion from the information presented in this report.
Neither this report nor any copy of it may be taken or transmitted into the United State (to U.S. Persons), Canada, or Japan or distributed, directly or indirectly, in the United States or Canada or
distributed or redistributed in Japan or to any resident thereof. If this report is inadvertently sent or has reached any individual in such country, especially, USA, the same may be ignored and brought
to the attention of the sender. This report is not directed or intended for distribution to, or use by, any person or entity who is a citizen or resident of or located in any locality, state, country or other
jurisdiction, where such distribution, publication, availability or use would be contrary to law, regulation or which would subject ASL to any registration or licensing requirement within such
jurisdiction. The securities described herein may or may not be eligible for sale in all jurisdictions or to certain category of investors.
The Disclosures of Interest Statement incorporated in this document is provided solely to enhance the transparency and should not be treated as endorsement of the views expressed in the report. The
Company reserves the right to make modifications and alternations to this document as may be required from time to time without any prior notice. The views expressed are those of the analyst(s)
and the Company may or may not subscribe to all the views expressed therein.
Copyright in this document vests with Axis Securities Limited.
Axis Securities Limited, Corporate office: Unit No. 2, Phoenix Market City, 15, LBS Road, Near Kamani Junction, Kurla (west), Mumbai-400070, Tel No. – 18002100808/022-61480808, Regd.
off.- Axis House, 8th Floor, Wadia International Centre, Pandurang Budhkar Marg, Worli, Mumbai – 400 025. Compliance Officer: Anand Shaha, Email: compliance.officer@axisdirect.in, Tel No:
022-42671582.
30You can also read