2014 Housing Giants Special Report
←
→
Page content transcription
If your browser does not render page correctly, please read the page content below

www.ProBuilder.com
              May 2014                         Powered by HousingZone.com

                         2014
                         Housing
                         Giants
                         Special Report:
                         • In pursuit of capital: the finance gap / 32
                         • The long road to energy efficiency / 38
                         • The resurrection of Orleans Homes / 46
                         • Ranking the nation’s largest builders / 50

          Eric Lipar
  Chairman and CEO
         LGI Homes
                                                                            PHOTO: BEN SKLAR / DBPHOTOAGENCY

2012 JESSE H. NEAL
AWARD WINNER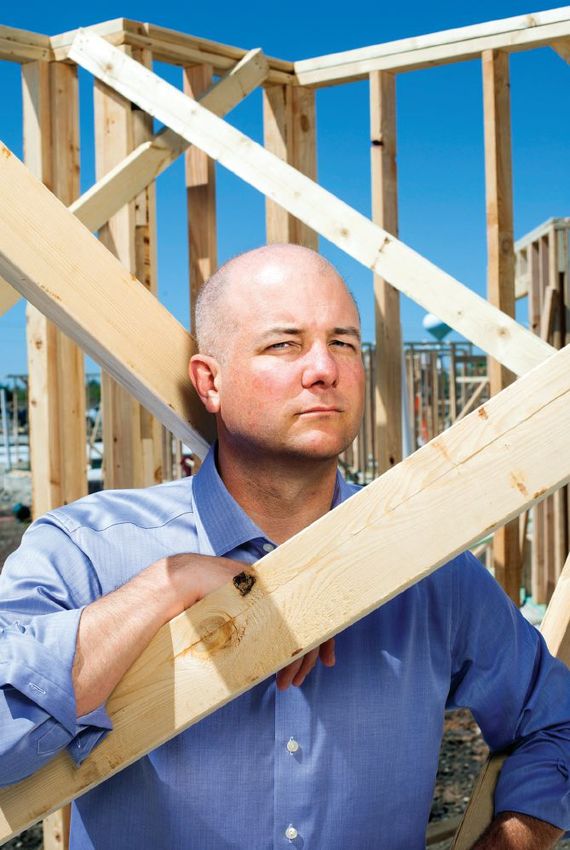
special report:

                                                                   Notching their best year since 2008, the nation’s biggest
                                                                   builders took advantage of an improving economy and
                                                                   a better housing market to find revenue in new places.
                                                                   By Patrick O’Toole, Denise Dersin, Mike Beirne, Kyle Clapham, Scott Sedam

housing giants report contents                                                                      n the more than 40 years this publication has com-
                                                                                                    piled its annual list of the nation’s largest builders—
 special pull-out giants map                                                          28            the Housing Giants—seldom, if ever, have the results
                                                                                                    over time reflected such a deep and prolonged decline
 overview and analysis                                                                29            in revenue and output as the one experienced by
                                                                                                    builders over the past several years.
                                                                                                       In 2008, as builders began reporting their initial de-
 in pursuit of capital                                                                32
                                                                                                    scent, the largest 225 firms tallied $81.4 billion in rev-
                                                                                                    enue on 317,361 closings. At the bottom, in 2011, those
 the long road to energy efficiency                                                   38     figures shrank by nearly half to $42.3 billion on 172,750 clos-
                                                                                             ings. The good news: The 2014 Housing Giants report clearly
 resurrection: the saga of orleans homebuilders                                       46     shows that the downturn has been replaced by a housing
                                                                                             market filled with new opportunities and new challenges.
 housing giants rankings                                                              50        This past year, the largest 225 Housing Giants (of the 293
                                                                                             Giants reporting) made double-digit gains to get within ear-
                                                                                             shot of levels from five years ago and banked $75.4 billion in
methodology                                                                                  revenue on 254,218 closings. On the face of it, their recovery
                                                                                             seems nearly complete. But these gains hide the breadth of
 Professional Builder has been compiling its list of Housing Giants for more than 40         changes underway at the nation’s biggest building firms. The
 years. Firms that wish to submit their information for the list must complete a question-
 naire. In addition, Professional Builder retains the services of researchers who contact
                                                                                             gains also obscure the diversity of approaches required by
 large building firms that have not volunteered information in order to cast the widest      most builders to succeed today. This Housing Giants report,
 net for the biggest home building firms. The rankings are based on new-home revenue         which includes the annual rankings and a heat-map poster of
 only. Firms with fewer than 30 starts cannot be included in the rankings. To learn more
 or to inquire about applying for next year’s list, please contact Professional Builder’s
                                                                                             the United States, as well as deeper discussions of financial
 awards coordinator Heidi Riedl at hriedl@sgcmail.com or (847) 391-1000.                     and energy efficiency strides made by builders plus a profile
                                                                                             of a builder making a comeback, demonstrates that today’s

                                                                                                                www.ProBuilder.com Professional Builder    29
housing giants market share

                                                                                                                                              19%                                       Giants 1 to 20
                                                                                                                                                                                        (14 4,225 CLOSINGS)

                                                                                                                                                                                        Giants 21 to 75
                                                                                                                                                                                        (58,228 CLOSINGS)

                                                                                                                                                          8%
                                                                                                                                                                                        Giants 76 to 150
                                                                                                                                                                                        (36,0 02 CLOSINGS)

                                                                                                                                                          5%
                                                                                                                                                                                        Giants 151 to 225
                                                                                                                                                          2%                            (15,763 CLOSINGS)

                                                                                                                     Non-Giants                                1%                       Giants 226 to 293
total new residential revenue                                                                                          65%                                                              (8,551 CLOSINGS)

                                                                                                               (499,431 COmpLEtIONS)                           baSE: 293
$ b ILLIONS , CO mpaRES t Op 225 h O USING GIaN t S                                                                                                            SOURCE: pROfESSIONaL bUILdER hOUSING GIaNtS REpORt 2014

     $81.4
                                                                                                                                                                                        $75.4

                      317,361
                                                                                                                                                   $53.5
                                                    $48.9
                                                                                                   $42.3                                                                                                254,218
                                                                      196,769                                                                                   207,907
                                                                                                                     172,750

     RE VENUE         C LO S I N G S               RE VENUE           C LO S I N G S               RE VENUE          C LO S I N G S               RE VENUE      C LO S I N G S          RE VENUE        C LO S I N G S

             2008                                            2010                                            2011                                         2012                                  2013
t hE hO U S I NG GI aNtS S UR V E y waS NOt CO NdUC tE d I N 2009 / baSE: 225 / SOU RCE: p ROfESSION aL bU IL d ER h OU SIN G G IaNt S REp OR t 2 0 1 4

housing market is grounded in new and sometimes unfamiliar                                                             job growth, and exhibited an entrepreneurial flair to make it
fundamentals. The new fundamentals have led big builders                                                               happen. This was true from the top of the list to the bottom.
to add new skills and new geographies and, in general, to be                                                             Once focused almost exclusively on starter homes, KB
more nimble and entrepreneurial.                                                                                       Home, No. 8 on this year’s list with $2.1 billion in revenue,
                                                                                                                       now builds 22 percent first move-up and 11 percent second
new fundamentals                                                                                                       move-up. Likewise, Beazer Homes USA, No. 13 on the list
   From the early 1990s until 2007, Housing Giants tended to                                                           with $1.27 billion in revenue, now builds only 50 percent
operate within clearly defined niches—single-family starter,                                                           starter homes, with the rest divided between first and sec-
single-family attached, first move-up, luxury, etc. That is no                                                         ond move-up and active adult. Ranked No. 39, DSLD, with
longer the case today. Due to myriad factors—the availabil-                                                            $300 million in revenue, is expanding its product offering
ity of finished lots to the relative buying strength of some                                                           to reach more move-up buyers. The fundamental reason is
demographic cohorts over others—big builders are working                                                               clear: The market for starter homes is weak. Millennials are
with what the market is giving them, even if it happens to                                                             simply not entering the market for new homes in the same
be very different from what they have done in the past. To                                                             numbers as their parents did.
achieve their gains in 2013, Housing Giants broadened their                                                               Consolidation continues to play a role as builders seek
product offerings, expanded into new markets with better                                                               new geographies and better markets. No. 15 builder David

30       Professional Builder May 2014
biggest challenges anticipated by giants in 2014                                       smaller houses, higher prices

                                                  36%                                             Average
  High material and labor costs                                                                  Sq. Ft. for                                                               %
                                                              52%
                                                                                              Housing Type                          2013                2012           Change
                                             28%
             Availability of land
                                    N/A
                                                                                                     Detached
                                            27%                                                        Starter                      1,781                1,763              1.02%
        Scarcity of skilled labor
                                              31%

                                     14%
       Government regulations                                                              Detached First
                                     14%                                                        Move-Up                            2,367                3,791            -37.56%
                                    13%
         Increased competition                                                                       Detached
                                           20%
                                                                                                       Second
                                                                                                     Move-Up                        3,107               4,908           -36.70%

biggest opportunities anticipated by giants in 2014                                            Median Price
                                                                                                for Housing                                                                %
                                                                                                      Type                          2013                2012           Change
                                                        45%
       Operational efficiencies
                                                       43%
                                                                                                     Detached
                                                 32%                                                   Starter                 185,000              175,000                 5.71%
            Economic recovery
                                                                    59%

                                                 30%
   Niche-market opportunities                                                              Detached First
                                                       41%                                      Move-Up                        270,000             250,000                 8.00%
                                                                    n 2014
                                             28%
             Market expansion                                       n 2013                           Detached
                                                        44%
                                                                                                       Second
                                             28%                base: 293                            Move-Up                   388,975              375,000                 3.73%
               Move-up buyers                                   source: professional

                                    N/A                         builder housing
                                                                giants report 2014     b a se: 2 9 3 / sou rce: profession a l b u il de r hou s i n g g i a n t s r e p or t 2014

Weekley Homes in recent years expanded into Indianapolis                    communities. Shea Homes, ranked No. 16 with $1.1 billion
and Phoenix via acquisition. This is due, in part, to higher                in revenue, opened 73 new communities. This proliferation
prices and higher demand for finished lots in A locations as                of new communities translated directly to more new de-
builders stay away from riskier suburban edge communities.                  signs, more new model homes, and more new design cen-
The No. 5 builder, Toll Brothers, which billed $2.7 billion last            ters. Cincinnati-based Drees Homes, No. 22 on the list with
year, acquired Shapell Homes for $1.6 billion last year. A driv-            $568 million in revenue, said its “single biggest change” last
ing motivation for Toll in seeking that company was its 5,000-              year was to build new models along with a new design cen-
plus entitled lots in coastal regions of California. Ranked No.             ter. Many others did the same.
47 last year, TRI Pointe Homes acquired Weyerhaeuser Real                     This Housing Giants report offers a composite picture of
Estate, the No. 14 builder by revenue, at the very end of 2013              the largest builders—a landscape that is diversified, varied
in a deal valued at $2.7 billion (Weyerhaeuser Real Estate in-              and, above all, growing. For 2014, Lennar is expecting 30
cludes Pardee Homes and Quadrant Homes, among others).                      percent growth; Toll Brothers, 42 percent; Weekley, 10 per-
Separately the company acquired 892 lots in California and                  cent; and Drees, 15 percent, just to name a few. Our sur-
Colorado via a flourish of fourth-quarter transactions.                     vey shows that many companies feel similarly optimistic.
  In 2013, the name of the game also was to actively open                   A year from now, we expect to be reporting another good
new communities to meet pent-up demand. Toll opened 80                      year for big builders. PB

                                                                                                    www.ProBuilder.com Professional Builder                                          31
in pursuit of
By Mike Beirne, Editor

LGI
                Homes would be ready to go public once it          executed contracts, and the even-flow construction sched-
                closed at least 2,000 houses a year, a bench-      ule was managed to finish a house within 45 to 60 days from
                mark that was probably a couple of years away,     breaking ground.
or so Eric Lipar thought. But when Tri Pointe Homes, an Irvine,      On the sales front, LGI blanketed Houston and San Antonio
Calif., builder with 144 closings in 2012, raised $156.3 million   apartment complexes near its subdivisions every five weeks
in net proceeds from its IPO in January 2013, Lipar knew the       with direct mail pieces announcing that it could turn renters
time was right to take his Houston-based company public.           into homeowners through no frills, no down-payment mort-
   “It really was a signal that the market was open to smaller     gages—typically mortgages backed by the Federal Housing
companies because Tri Pointe was essentially a startup,” says      Administration or the U.S. Agricultural Department’s rural
LGI’s chairman and chief executive officer. “Even though (Tri      housing program—that cost less than or were on par with the
Pointe) had a very nice balance sheet with really good equi-       target market’s current monthly rent. Those mailers gener-
ty, they were just starting to get closings into the company.      ated as many as 100 leads a week.
When we saw that, we wanted to get out there before that             “We have a very disciplined and systematic approach to our
window closed.”                                                    sales process, our direct mail, and with our construction staff.
   Before LGI completed its $90-million offering last November,    When you look at our growth strategy, we have the system,
Lipar and his team made several stops at various providers of      we have the process, and all we’re doing is duplicating it and
capital along a journey that started when the company closed       opening stores across the country similar to a franchise con-
its first house in 2003. That trek, in a sense, encapsulates the   cept,” Lipar says.
varied sources of money that home builders are tapping—pri-          The builder had designs in 2006 to grow to 1,000 closings
vate equity, public debt, and the common stock market—ever         by 2012. Then the downturn hit. Banks stopped lending, and
since banks pulled back on credit after the start of the hous-     LGI’s primary source of construction loans announced it was
ing market collapse in 2007.                                       getting out of the Texas market. Without more capital, the
   “Financing has changed in the sense that there is a more        company’s growth plans were in jeopardy.
diverse range of sources available and needed,” says Dave            So LGI’s management team sought friends and family fi-
Ledford, senior vice president of housing finance and regula-      nancing. Lipar set up a private placement memorandum
tory affairs for the National Association of Home Builders. “I     and raised $2.1 million from employees, trade contractors,
think that this will be more than just a temporary sign be-        and friends—17 individual investors in all, kicking in at least
cause community banks are not going to be able to have 80          $100,000 each. They were told that in three-to-five years the
percent of their portfolios in construction and development        return on their investment would be about 20 percent. With
loans going forward. The regulators made that very clear.”         that capital, LGI entered the Dallas/Fort Worth market by
                                                                   acquiring 210 foreclosed lots in the Deer Creek community
the go-go years                                                    and was building houses there by 2009. Still, LGI needed more
  The stretch between 2003 and 2006 was a good one for LGI         capital to reach its next growth phase, particularly since land
as it was for builders in general. Closings for the company        was priced at a bargain thanks to the Great Recession.
steadily increased to 418, and bank credit lines were readily        “In 2009 and going forward, that’s when we saw opportu-
available. LGI had aspirations to be a multiregional builder.      nities to buy distressed finished lots with lower replacement
On the construction side, its business model focused on build-     cost, and that’s when we got really excited about going down
ing entry-level homes with a yard, priced as low as $115,000.      the road to raise private equity and raising friends and family
A steady inventory of move-in ready product was created            capital to do whatever we needed to do to take advantage of
by setting building activity against projected closings, not       those opportunities,” Lipar says.

32   Professional Builder May 2014
capital
                                                                                                          IPO, bond, and private
                                                                                                          equity money flocked to the
                                                                                                          Housing Giants. Is there a
                                                                                                          finance gap for everyone else?

  In March 2010, the builder picked up a $50-million infu-
sion from Golden Tree Insite Partners, a New York-based real
estate investment firm now called GTIS Partners. With that
cash, LGI purchased 175 lots in the Chisholm Spring subdi-
vision in Fort Worth, and 393 lots across the street from its
Canyon Crossing community in San Antonio. The following
year, LGI planted a stake in Phoenix, buying 103 lots in San
Tan Heights, and then Austin, Texas, by purchasing 102 lots
in the Sonterra development. In 2012, LGI launched in Tampa,
and last year in Atlanta, Orlando, Albuquerque, and Tucson.

expansion barriers
  The builder closed over 1,000 homes going into last year,
but pushing even higher created hurdles with private equity.
LGI needed even more upfront capital to develop land and
break into growth markets—an exercise that required more
time than the period private equity investors typically allot
before collecting their 20-plus-percent return on investment.
Banks were not an option, and LGI seemed to be another 1,000
closings and years away from being IPO ready. But after Tri
Pointe became the first home builder to go public since 2004,
LGI quickly followed suit.
  “We went as fast as we could to prepare for it,” Lipar says.
“This was not an exit strategy. This was an event to help us
further grow in the future, so the multiple we went out at, and
the price to earnings ratio we went out at wasn’t important
to us. The important thing was getting out and getting the
capital raised so we could grow the company in the future.”

the public road
  A total of six builders—Taylor Morrison, WCI Communities,
UCP, and William Lyon also completed IPOs—went public last
                                                                  PHOTO: BEN SKLAR / DBPHOTOAGENCY

year. The New Home Company, Aliso Viejo, Calif., finished its
$86-million offering in January and Newport Beach, Calif.-
based City Ventures is scheduled to debut on the public mar-
ket this year. When it does, the industry will have 24 publicly
traded companies that predominantly build detached single-
family homes, the most since 2005.                                                                   Eric Lipar, chairman and CEO
  And why not? Wall Street had an appetite for new invest-                                           LGI Homes, Houston
ment opportunities after sitting on the cash sidelines during

                                                                                                                    www.ProBuilder.com Professional Builder   33
the slow economic recovery. Last year, capital raised by IPOs         in 6.75-percent senior unsecured
from U.S. issuers jumped 40.5 percent to $57.1 billion (201           notes due in 2021. He says that
deals) compared with $40.6 billion (126 deals) in 2012, accord-       a downside with being public is
ing to Thompson Reuters. Top builders that were able to hold          the headline noise that can affect
onto or get access to land and upscale move-up and move-              share price regardless of the com-
down buyers rebounded early last year. When those builders            pany’s performance.
sought to sell common stock in order to raise capital and buy             “I was talking to one of the pub-
                                                                                                                          Doug Bauer
land, investors were eager to get in on the action.                   lic builder CEOs, and he said ‘I’m
   Doug Bauer, Tri Pointe’s chief executive officer, jokes that       growing by 10, 20, 30 percent, and
perhaps he should collect a “finders fee” or some sort of re-         my stock gets dinged because the analysts think that it should
bate as a result of other builders going public after his com-        be growing by 40 percent,’” Shine says. “‘They don’t understand
pany’s IPO. He admits that he would have doubted back in              that growing that fast has a downside, but because they decid-
August 2012 whether there was an IPO market for his compa-            ed that is how fast I should grow, they’re going to ding me for
ny. But $150-million financing from Starwood Capital, a clean         it.’ There are some extremely savvy, smart analysts out there,
balance sheet, and quality management eventually added up             the Ivy Zelmans of the world and a small handful of others.
to a compelling lure for investors. One negative since going          Then there also are some guys out there who call me, they say
public is the company incurs more accounting and legal ex-            stuff, and I scratch my head, and I just go, ‘Really?’”
penses related to compliance with the Sarbanes-Oxley Act—a
cost of equity that the builder didn’t have when it was private.      public debt
But Bauer calls that more of a change than a negative.                   Builders were among the many private and public U.S. com-
   “Frankly, I’d be a public company in any industry, especially      panies that also took advantage of relatively cheap money by
home building,” Bauer says. “It imparts a certain amount of disci-    issuing public debt in 2012 and 2013. Issues in the U.S. invest-
pline that I think makes a company a better operator and a bet-       ment grade market reached $1.02 trillion last year, topping
ter steward of its capital so you can survive the ups and downs.”     the previous all-time high of $1.01 trillion set during the pre-
   After its January IPO, The New Home Company moved on               vious year, per Thomson Reuters. That push was partially the
the $74-million purchase of Arantine Hills, a proposed mas-           result of companies trying to beat rising interest rates during
ter plan development in Corona, Calif. The site is surrounded         the second half of last year after the Federal Reserve Board
by established communities, already sits within a school dis-         signaled that it was considering reducing its monthly bond
trict, and will have somewhere between 1,300 to 1,600 new-            purchases, which had kept rates stable.
home sites. That deal would not have been possible without               Well before that rush, David Weekley Homes, Houston, in
the builder raising money through its January IPO, says Larry         February 2013 issued $200 million of senior unsecured debt due
Webb, chairman and chief executive officer.                           in 2023 at 6-percent interest, one of the more favorable terms
   “I’ve been doing this for 30 years and during most of my ca-       for a private builder. The money was raised through a 144A-for-
reer, during the good times and good market conditions, the           life bond offering, which carries reporting requirements, but
capital was very plentiful for both the private and public build-     the privately held builder only discloses its numbers to inves-
ers,” Webb says. “But coming out of this recession, private build-    tors who are qualified to buy the bonds. That avenue was an
ers have a much more difficult time having access to capital.”        attractive alternative to other forms of issuing debt or raising
                                                                      money in the public market, particularly if shareholders and
                             the private side                         Wall Street analysts pushed for dividend payouts or buybacks
                               Perhaps the debate about the ad-       at the expense of such Weekley practices as profit sharing with
                             vantages of public versus private is     employees and donating 20 percent of pretax earnings to char-
                             not as salient as discussing wheth-      ity. The builder used the bond money to pay down bank lines.
                             er a builder is large enough and            “The cost of public debt was 1-to-1.5-percent higher (than
                             well-capitalized enough, which           bank line rates available at that time), but what you’re paying
                             can be the case whether the com-         for is the interest risk rate,” says Heather Humphrey, Weekley
                             pany sells stock or is privately held,   Homes’ chief financial officer. “Revolving rates are not staying
                             says Joel Shine, chief executive offi-   put, we’re locking in at 6 percent for 10 years. All other borrowing
                             cer of Woodside Homes, Salt Lake         is variable. That’s about the lowest fixed rate we’ve ever seen.”
                             City. Last September, the privately         William Lyon Homes, Newport Beach, Calif., also took
 Joel Shine
                             held builder raised $220 million         advantage of lower interest rates in 2012 by refinancing a

34   Professional Builder May 2014
Change from 2012
% Custom Homes
Adult/Retirement
% 2nd Move-Up
% 1st Move-Up
Custom Homes
2014 Forecast
2013 Closings
Previous Rank
Second Home
Year Founded
2013 Housing
% Production
and Beyond
% Vacation/
Total Other
% Revenue
2013 Rank
% Starter
Company
% Active
Revenue
Revenue
% Semi-
Homes
Types
D.R. HoRton Inc. — Fort Worth, TX SFD,
1 1 1978 $6,432,314,000 25,161 41.1% $222,534,000
Donald R. Horton / www.drhorton.com SFA
PulteGRouP Inc. — Bloomfield Hills, MI SFD,
2 2 1950 $5,424,309,000 17,766 19.2% $259,681,000 25 46 29 100
Richard J. Dugas Jr. / www.pultegroupinc.com SFA
lennaR coRP. — Miami, FL SFD,
3 3 1954 $5,292,072,000 18,290 51.5% $643,023,000 36 59 5 30%
Stuart Miller / www.lennar.com SFA
nVR Inc. — Reston, VA
4 4 1948 $4,134,481,000 11,834 32.5% $0 SFD
Paul Saville / www.nvrinc.com
toll BRotHeRs — Horsham, PA SFD,
5 5 1967 $2,711,838,000 4,235 44.0% $52,238,000 5 60 20 10 5 100 42%
Douglas Yearley / www.tollbrothers.com SFA
tayloR MoRRIson — Scottsdale, AZ
6 8 2007 $2,264,985,000 5,829 65.4% $30,371,000 SFD 23 31 31 15
Sheryl Palmer / www.taylormorrison.com
HoVnanIan enteRPRIses Inc. — Red Bank, NJ SFD,
7 6 1959 $2,089,729,000 5,927 21.1% $66,926,000 31 32 24 13
Ara K. Hovnanian / www.khov.com SFA
KB HoMe — Los Angeles, CA
8 7 1957 $2,084,978,000 7,145 34.7% $12,152,000 SFD 56 22 11 11 100
Jeffrey T. Mezger / www.kbhome.com
tHe RylanD GRouP — Westlake Village, CA SFD,
9 9 1967 $2,082,838,000 7,027 64.9% $57,917,000 23 42 34 1 100
Larry Nicholson / www.ryland.com SFA
stanDaRD PacIfIc HoMes — Irvine, CA SFD,
10 10 1965 $1,911,756,000 4,627 58.4% $40,530,000 26 47 26 1 100
Scott D. Stowell / www.standardpacifichomes.com SFA
MeRItaGe HoMes coRP. — Scottsdale, AZ
11 11 1985 $1,783,389,000 5,259 50.1% $31,270,000 SFD 24 49 24 3 100 -5%
Steven J. Hilton / www.meritagehomes.com
M.D.c. HolDInGs Inc. — Denver, CO SFD,
12 12 1972 $1,626,700,000 4,710 41.3% $80,665,000 47 53
Larry A. Mizel / www.richmondamerican.com SFA
BeazeR HoMes usa — Atlanta, GA
13 13 1994 $1,279,212,000 5,056 28.4% $8,365,000 SFD 50
Allan Merrill / www.beazer.com
WooD PaRtneRs — Atlanta, GA
14 41 1998 $1,249,800,000 4,275 447.9% $0 R
Ryan Dearborn / www.woodpartners.com
WeyeRHaeuseR Real estate co. — Federal Way, WA SFD,
15 14 1971 $1,218,430,000 2,939 40.0% $57,282,000
Peter Orser / www.weyerhaeuser.com/business/WRECO SFA
DaVID WeeKley HoMes — Houston, TX SFD,
16 15 1976 $1,124,000,000 2,899 30.5% $0 4 87 9 100 10%
David Weekley / www.davidweekleyhomes.com SFA
sHea HoMes — Walnut, CA SFD,
17 16 1968 $1,092,703,000 2,440 43.3% $51,926,000 31 11 20 38
Bert Selva / www.sheahomes.com SFA
M/I HoMes Inc. — Columbus, OH SFD,
18 17 1976 $993,000,000 3,472 33.1% $44,000,000 40 30 18 10 2 90 10
Robert H. Schottenstein / www.mihomes.com SFA
tHe VIllaGes of laKe suMteR — The Villages, FL
19 18 1959 $961,011,584 3,419 33.2% $0 SFD 100 100 0%
H. Gary Morse / www.thevillages.com
HIGHlanD HoMes llc — Plano, TX
20 20 1985 $760,600,000 1,915 21.5% $0 SFD 16 80 4 95 5
Rodger Sanders / www.highlandhomes.com
asHton WooDs usa llc — Roswell, GA SFD,
21 21 1989 $728,691,000 2,241 36.6% $5,427,000 28 39 33 100
Kenneth Balogh / www.ashtonwoods.com SFA
DRees HoMes — Ft. Mitchell, KY SFD,
22 22 1928 $568,009,000 1,512 8.8% $16,100,000 15 85 10 75 15 15%
David Drees / www.dreeshomes.com SFA
WIllIaM lyon HoMes — Newport Beach, CA SFD,
23 27 1956 $566,221,000 1,435 68.1% $18,692,000 40 32 28 100
William H. Lyon / www.lyonhomes.com SFA
PeRRy HoMes llc — Houston, TX
24 23 1967 $545,170,000 1,693 20.2% $8,200,000 SFD 25 50 25 100 9%
Kathy P. Britton / www.perryhomes.com
BRooKfIelD ResIDentIal PRoPeRtIes — Calgary,
25 NR 1956 $511,000,000 855 NA $74,000,000 SFD
Alberta, Canada; Alan Norris / www.brookfieldrp.com
claRK BuIlDeRs GRouP llc — Arlington, VA
26 28 2003 $505,785,040 1,598 51.3% $606,893 R
Keith Anderson / www.clarkbuildersgroup.com
MHI (McGuyeR HoMeBuIlDeRs Inc.) — Houston, TX SFD,
27 25 1988 $494,600,000 1,574 21.3% $7,400,000 10 25 65 20 80 5%
Frank B. McGuyer / www.mcguyerhomebuilders.com SFA
Gl HoMes of floRIDa — Sunrise, FL SFD,
28 29 1975 $491,335,000 1,020 55.0% $0 9 36 18 37 100
Itchko Ezratti / www.glhomes.com SFA
sIMPson HousInG llP — Denver, CO
29 NR 1948 $440,006,900 1,357 NA $0 R
J. Robert Love / www.simpsonhousing.com
WooDsIDe HoMes — North Salt Lake, UT SFD,
30 30 1977 $438,103,000 1,507 40.0% $3,076,591 14 42 44
Joel Shine / www.woodsidehomes.com SFA
N R = N OT RA N KE D
50 Professional Builder May 2014
Change from 2012
% Custom Homes
Adult/Retirement
% 2nd Move-Up
% 1st Move-Up
Custom Homes
2014 Forecast
2013 Closings
Previous Rank
Second Home
Year Founded
2013 Housing
% Production
and Beyond
% Vacation/
Total Other
% Revenue
2013 Rank
% Starter
Company
% Active
Revenue
Revenue
% Semi-
Homes
Types
Wermers Companies — San Diego, CA
31 NR 1957 $404,000,000 1,911 NA $0 R
Jeff Bunker / www.wermerscompanies.com
First texas Homes inC. — Dallas, TX
32 34 1986 $377,053,638 1,245 28.5% $2,250,463 SFD 60 40 80 20 2%
Keith Hardesty / www.firsttexashomes.com
polygon nortHWest Co. — Bellevue, WA SFD,
33 32 1991 $376,615,995 1,287 26.1% $4,000,500 45 45 10 100
Jeffery Gow / www.polygonhomes.com SFA, R
CroWn Communities inC. — Conyers, GA
34 36 1999 $375,205,186 1,540 34.1% $0 SFD 50 50 100
Francis J. Downey / www.crownus.com
Habitat For Humanity international — Atlanta, GA
35 26 1976 $364,000,000 3,367 -7.8% $0 SFD 100
Jonathan Reckford / www.habitat.org
stanley martin Homes — Reston, VA SFD,
36 42 1966 $323,831,770 588 42.5% $27,549,270 30 30 40 92 5 3 13%
Steven Alloy / www.stanleymartin.com SFA
mattamy Homes - us group — Winter Park, FL SFD,
37 45 1978 $320,464,000 1,224 56.1% $0 10 35 55 100 20%
Steve Parker / www.mattamyhomes.com SFA
a. g. spanos Companies — Stockton, CA
38 19 1960 $317,000,000 2,329 -53.3% $23,114,000 R
Dean A. Spanos / www.agspanos.com
DslD llC — Denham Springs, LA
39 46 2008 $299,679,299 1,597 51.3% $0 SFD 50 50 100 0%
Saun Sullivan / www.dsldhomes.com
FisCHer Homes — Erlanger, KY SFD,
40 43 1981 $296,780,000 1,008 35.8% $0 20 20 60 70 30
Henry Fischer / www.fischerhomes.com SFA
epCon Communities FranCHising inC. — Dublin, OH
41 40 1995 $290,715,049 1,072 23.3% $0 SFA 98 2 100 10%
Philip Fankhauser, Edward Bacome / www.epconcommunities.com
geHan Homes — Addison, TX
42 37 1994 $289,925,095 1,089 17.9% $0 SFD 50 50 100
Timothy Gehan / www.gehanhomes.com
sares-regis group — Irvine, CA SFD,
43 179 1993 $286,894,000 694 744.4% $198,474,000 100 100 0%
Geoffrey Stack / www.sares-regis.com SFA, R
tHe neW Home Co. — Aliso Viejo, CA SFD,
44 NR 2009 $266,266,753 424 145.4% $0
H. Lawrence Webb / www.nwhm.com SFA
stoCk Development — Naples, FL SFD,
45 NR 2001 $261,000,000 434 NA $175,869,080 100 35 65 20%
Brian K. Stock / www.stockdevelopment.com SFA
Century Communities inC. — Greenwood Village, CO SFD,
46 63 2002 $254,820,070 752 91.6% $784,750 20 35 40 5 100 100%
Robert Francescon / www.centurycommunities.com SFA, R
tri pointe Homes inC. — Irvine, CA
47 108 2009 $247,091,000 396 218.9% $10,864,000 SFD 25 50 25 100
Doug Bauer / www.tripointehomes.com
tHe bozzuto group — Greenbelt, MD SFD,
48 24 1988 $243,054,122 1,116 -46.0% $1,132,532,558 25 30 45 100
Thomas S. Bozzuto / www.bozzuto.com SFA, R
lgi Homes inC. — The Woodlands, TX
49 57 2003 $241,000,000 1,617 61.2% $0 SFD 95 5 100
Eric Lipar / www.lgihomes.com
ivory Homes ltD. — Murray, UT SFD,
50 49 1986 $240,810,000 714 41.1% $0 17 50 21 7 5 58 42 7%
Clark D. Ivory / www.ivoryhomes.com SFA
legenD ClassiC Homes ltD. — Houston, TX SFD,
51 66 1989 $239,294,597 1,357 83.1% $0 45 30 25 80 18 2 10%
Scott Bauer / www.legendhomeshouston.com SFA
neal Communities oF soutHWest FloriDa llC — SFD,
52 61 1970 $228,873,156 769 68.0% $7,754,636 16 73 11 89 11 30%
Sarasota, FL; Patrick K. Neal / www.nealcommunities.com SFA
mungo Homes inC. — Irmo, SC SFD,
53 52 1954 $227,977,000 1,082 37.6% $7,320,000 62 30 8 100 22%
Steven W. Mungo / www.mungo.com SFA, R
Dan ryan builDers — Frederick, MD SFD,
54 79 1990 $226,518,352 1,010 118.8% $1,612,419 50 40 10 100 22%
Dan Ryan / www.danryanbuilders.com SFA
albert D. seeno ConstruCtion Co. / DisCovery
55 35 1938 $225,017,000 491 -21.0% $145,340,452 SFD 20 58 22 94 6 3%
builDers — Concord, CA; Albert Seeno / www.seenohomes.com
tHe Community builDers inC. — Boston, MA
56 134 1964 $224,094,536 459 291.3% $0 R
Bart Mitchell / www.tcbinc.org
Fulton Homes Corp. — Tempe, AZ
57 55 1975 $223,766,400 696 45.8% $3,630,100 SFD 15 25 40 20 15 85 85%
Douglas S. Fulton / www.fultonhomes.com
van metre Companies — Fairfax, VA SFD,
58 53 1955 $221,020,000 476 40.3% $96,196,000 61 34 5 100 11%
Albert G. Van Metre Jr. / www.vanmetrecompanies.com SFA
ameriCan West Development inC. — Las Vegas, NV
59 106 1984 $220,888,128 730 180.1% $43,000,000 SFD 25 75 100
Lawrence D. Canarelli / www.americanwesthomes.com
JoHn WielanD Homes — Smyrna, GA SFD,
60 44 1970 $217,247,341 467 2.5% $2,696,500 6 60 31 3 80 19 1 31%
Greg Huff / www.jwhomes.com SFA
www.ProBuilder.com Professional Builder 51$235-million and 10.25-percent interest term loan due next the financing gap
year with a $325-million issue of senior notes with 8.5-per- Banks will still be the dominant
cent interest. Lyon raised another $150 million to buy 540 provider of credit but, like equity
infill lots in Orange, Los Angeles, and Santa Clara counties in investors, they will be very selec-
California with a 5.75-percent senior note issue completed tive and favor large companies
in March. Other builders that have dipped into the high- with stellar balance sheets.
yield market for capital recently include D.R. Horton, Fort Small- and medium-sized build-
Heather Humphrey
Worth, Texas; Beazer, Atlanta; Hovnanian, Red Bank, N.J.; ers are at a competitive disadvan-
Lennar, Miami, and Ashton Woods, Roswell, Ga. tage because even if the housing
But raising capital through bonds, obviously, is not available market returns to normal activity, there will be a gap that has
for smaller builders. Humphrey, Bauer, and Lipar agree that a to be filled with alternative capital sources since banks will
$200-million issue is the minimum buy-in for issuing public not be able to carry the load they carried before the crash.
debt. Anything less makes the bond too expensive for the issuer. “We’d like to see our smaller builder members have ac-
cess to credit and not be at a competitive disadvantage, but
private equity partner presently it’s hard to argue that they are not,” says Ledford
Some builders raised capital through partnerships with eq- of the NAHB. “That is why we are trying to level the field in
uity investors willing to take an ownership stake or set up a that regard.”
joint venture. Mountain Real Estate Capital LLC, with offices Details are in the works, but Ledford says that such a pro-
in Minneapolis, Charlotte, and San Diego, has committed $800 gram could launch this year. Unlike previous hodgepodge ef-
million through about 60 deals in the past four years. Many forts that tried to match builders with financing preferences
of the partners are builders that some Mountain employees until the program ran its course, the NAHB is developing a
worked with since their days with GMAC’s construction lend- plan to continuously provide capital on a regular basis.
ing group. Mountain’s investments range from $5 million to “(It’s) sort of like how the commercial paper market works
$75 million with the average deal size being about $12 mil- for you. You’re able to keep the money flowing from investors,
lion. Some deals are short two-to-three-year partnerships; and there’s an intermediary working for you servicing the
others are six-to-eight-year stretches, and some of its builder loans so the investors don’t have to be concerned about that,
partners have visions of going public in two-to-five years. and there’s confidence in the process,” Ledford says. “That’s
“We’ve found that if a builder is at 150 homes or more (a the key: to get confidence in the process so the investors don’t
year), we are a pretty good partner for them,” says Joel Kaul, have to look through every little detail in how the money is
Mountain’s managing director. “If they’re under 150 homes, applied and repaid. As long as that happens, they should be
it’s hard for us as institutional investors to figure out how satisfied and do it at a cost that is workable for the builders.”
we’re going to help them grow their business.” Credit watchers such as Experian Information Solutions,
He explains that a smaller builder with $5 million in capital Fitch, and the Federal Reserve note that banks are loosen-
doesn’t need an equity investor because he can just “recycle that ing lending standards and underwriting more mortgages and
capital through his home building company.” But a builder with business loans. Although banks will remain the main provid-
150 to 200 closings has outgrown his friends and family financ- er of capital, there is a financing gap that will have to be filled
ing. If that builder wants to double his production, his company by an alternative money source—or not. Nevertheless, the
probably needs another $5 million to $15 million to do so. industry will have to reckon with the notion that the Great
“We’re a really good resource Recession has fundamentally changed how builders acquire
for the builder to partner with. We financing.
move a lot of their new projects “For most of my career when looking at the home building
into a joint venture, and then we industry, I have felt that about 50 percent of new homes went
finance the land acquisitions, de- to private builders and the other 50 percent went to the pub-
velopment, and home building in lic builders,” says Webb of The New Home Company. “Moving
our partnership. We are more ex- forward I really believe that five years from now, you’re go-
pensive than debt, but it is a great ing to see that 75 percent of houses sold in America are from
structure for a conservative build- public builders. There will always be well-run private compa-
er who wants to grow, but doesn’t nies; but public builders, because of their access to equity, will
want to sign up for a bunch of have an incredible competitive advantage, and I don’t see that
Larry Webb
debt right now,” Kaul says. changing in the short term.” PB
36 Professional Builder May 2014executivecorner
Going from private to public, Larry Webb
talks about being a builder after the IPO
the best of being private and public. I’m still in charge, and I
H. Lawrence Webb
still have a major investment in my own company, but I have
Chairman and CEO
access to much cheaper capital and much more capital than
The New Home Company
I ever would have in the private sector.
Aliso Viejo, Calif.
Q Have any notions you had about being public changed?
A I knew the reporting was a lot more complicated and oner-
ous than what a private builder goes through. I probably
didn’t recognize how much time you have to spend on that.
That’s one, but it’s something we can deal with. On the other
side, prior to this I had three other customer groups besides
W henever Larry Webb participated in a home builder confer-
ence panel discussion about private versus public, he would
expound on the virtues of being privately held. After leaving
my partners, so those were the four ownership groups that I
reported to. Now we’ve sold more than 8 million shares of stock,
so more of my time is spent communicating with all different
John Laing Homes in 2008, Larry and three other former John kinds of investors, and I have to be more aware of everything
Laing executives started a new company during the depths of the I do. You know, I have to be quiet. I’m not allowed to speak to
housing crash in 2009. The New Home Company eventually at- people. I used to be able to say whatever I wanted whenever I
tracted capital from private equity investment firms and grew to felt like it. In today’s world, I probably wasn’t as cognizant or
build in 22 communities on its own and in joint ventures. Then the aware of the restrictions and the reasons for the restrictions,
builder completed an IPO in January 2014 and raised $86 million. and I’m learning that. I’m learning that if I predict something in
the future, and someone buys my stock because of me getting
Q Why did you go public?
on a panel somewhere, and it doesn’t happen, I could be liable
for that. So I’m a lot more aware and a lot less flip than I used to
A We just came to the conclusion within the last 18 months
that we had a lot of opportunities to continue to grow
be. I’m still flip, but not as much as I used to be.
the business. We have this great team of people, and what
we were constrained by was access to capital and access to Q What are your expansion plans?
well-priced capital, and that is what going public does for you.
It allows you to expand and grow your business, and you’re
only limited by the opportunities you can come up with. If
A When I look at our company and people, it seems to me
that our competitive advantage is in markets where land
is constrained, and where you get rewarded for thoughtful ar-
we were going to stay a relatively small company with two or chitecture and planning. Along with that is building in mar-
three housing programs in each area, then I would’ve stayed kets with job growth. That works very much for the Bay Area,
private. But we own or control over 6,000 lots now. In Califor- Southern California, and Sacramento. When I look beyond
nia that represents a significant amount of capital, and we that, to Phoenix, I don’t mean outside of Phoenix. I mean the
really could not take advantage of those lots unless we really inner loop of Phoenix, the Scottsdale area, and Paradise Val-
got a big influx of money, and there were only two ways to do ley. Along with that Seattle, Portland, and maybe Denver. So
that. One was to go public; the second was to attract a large it is clear that those are areas I am interested in. But with
private investor. I’m still an investor in this company, and I the proceeds from the IPO, maybe all the money we raised
didn’t want to be diluted. I also didn’t want a boss or a big will go to already identified projects in California. We are still
investment group that would basically tell me how to run the considering these other options. It may be 12 months away, it
company. By being public, I’m the chairman of the board. I may be sooner. We’re really not sure yet. But the majority of
have an independent board, and they understand what we do the money that we are focusing on raising was for California
and are very supportive. In a sense, this move kind of gave me projects that we already identified. PB
92 Professional Builder May 2014You can also read