Has the private rented sector grown because people want to rent, or because they cannot afford to buy? - Report 9 - TDS Charitable Foundation
←
→
Page content transcription
If your browser does not render page correctly, please read the page content below

Report 9

Has the private rented sector grown
   because people want to rent, or
 because they cannot afford to buy?

                                         Image: Andersastphoto | Dreamstime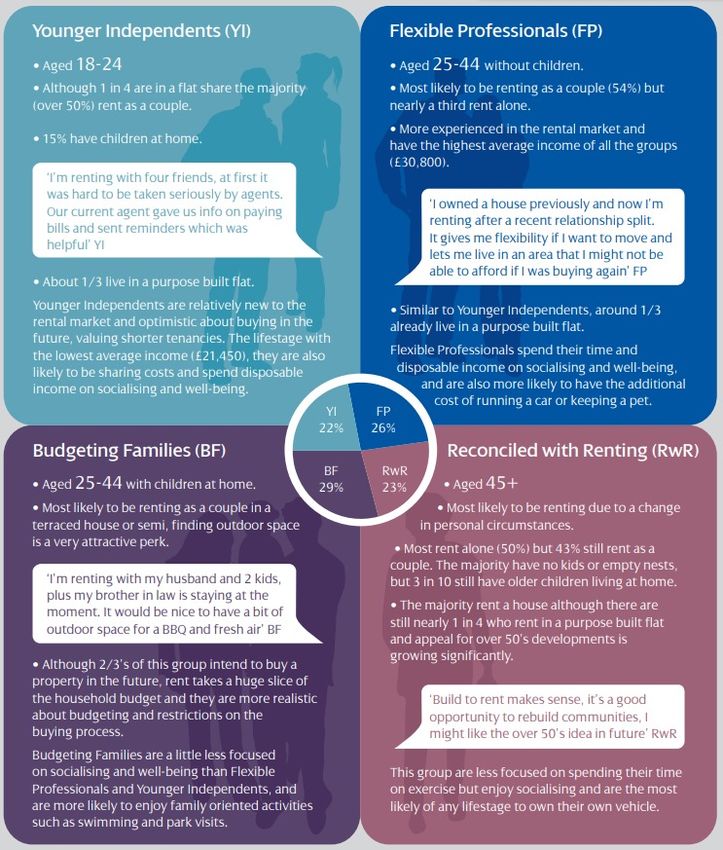
About this report
This report has been created thanks to the support of the TDS Charitable Foundation. The
Foundation “works to advance education about housing rights and obligations in general”.

In particular, the charity focuses on:

 ● Best practice in the management of private rented housing;

 ● Legal rights and obligations of those involved in the provision or management of private rented
   housing;

 ● Using alternative dispute resolution for more efficient and effective resolution of disputes
   between landlords and tenants.

The charity has provided a grant to Kate Faulkner who runs Designs on Property Ltd
(designsonproperty.co.uk), to produce a series of reports and surveys on the private rented sector
which are designed to increase knowledge on the private rented sector in England and to promote
best practice.

Opinions expressed in this report are those of Kate Faulkner and do not necessarily reflect the
views of Tenancy Deposit Scheme (TDS) or The TDS Foundation.

                                               TDS Charitable Foundation Registration number: 1154321

                                                  2
About the authors
Kate Faulkner Bsc (Econ) MBA CIM DipM was originally a consumer in the
residential property market, buying, selling, renovating and renting property for
many years. At that time she was a sales and marketing professional working
with major brands such as PG Tips.

Having enjoyed working in her spare time in residential property, she went on to
set up one of the UK’s first property portals prior to the advent of Rightmove,
then used her experience to help create on- and off-line tools designed to take
the stress out of corporate relocations for employees.

From here she moved to set up the Self-Build and Renovation Centre in Swindon, and
subsequently helped build and professionalise a part exchange business. Kate was also a Future
Homes Commissioner for RIBA.

After gaining so much experience across the property market, Kate embarked on a mission to
improve the way people carry out property projects, especially within the private rented sector. So
whether it is banishing cowboy builders and rogue landlords, or helping the public approach a
property project as simple as hanging a door or as complex as letting or building their own home,
Kate is always on hand, either via her consumer website at propertychecklists.co.uk or at the
property clinics she runs around the UK, to help landlords, tenants, first-time buyer, self-builders,
renovators and investors carry out their property projects in the right way, using qualified people
and industry experts.

Kate’s consultancy, Designs on Property Ltd, provides help and support to companies and
organisations that want to communicate better to the public, or to introduce new products and
services which help people carry out their property projects successfully, first time around.

She is fanatical that property facts and figures such as prices and rents should be reported
correctly in the media, by the industry, and by organisations and policy-makers involved in the
property market.

Kate regularly appears in the national and local media, and comments on TV, radio and in regional
and national newspapers on property news items of the day. In this way she continues to pursue
her chief objective, which is to help ensure the public get an independent, honest view of what’s
happening in the residential property market.

This report is part of a series of reports and surveys that Kate will be producing thanks to the
support of the TDS Charitable Foundation.

The aim of the research provided is to improve the understanding of the private rented sector and
to make recommendations on changes which will impact positively on the experience of landlords
and tenants.

                                                  3
Sarah Walker is a freelance writer and editor with extensive knowledge of the
property investment industry. A former estate agent and television presenter,
Sarah has spent the last decade writing for industry publications and leading
UK property companies, producing a wide range of marketing and PR content,
including consumer guides, newsletters, website copy, articles and reports.

She has ghostwritten several property investment books, edited a number of
others on property, business and branding, and continues to work with
entrepreneurs to produce literature that supports their business enterprises.

                                                 4
Contents
Introduction                                                           6

PART ONE: The growth in the PRS                                        7

What factors have contributed to the PRS growing in the way it has?   10

Has the quality of the ‘product’ created its own demand?              13

Who is renting and why?                                               15

Tenants making a conscious decision to rent, rather than buy          17

PART TWO: The affordability debate                                    19

What are all the factors affecting affordability?                     20

Change in benefits of renting versus costs of owning                  27

Availability of mortgage finance                                      30

What help is there currently for those who are struggling to buy?     32

Conclusion                                                            35

                                                    5
Has the private rented sector grown
        because people want to rent, or
      because they cannot afford to buy?

Introduction

The growth in the private rented sector has been considerable over the last 15 years, having
more than doubled in size since 2002. In 2012-13, the PRS overtook the social rented sector for
the first time and it has remained larger ever since. According to the government’s English
Housing Survey, the PRS accounted for 20% of households (4.7 million) in 2016-17 and, over the
last decade, the number of households with dependent children in the private sector has
increased from 30% to 38%.

Of those currently renting privately, 60% of those surveyed by the government expected to buy a
property at some point in the future, a percentage point higher than the year before.

The key questions being asked and discussed in this report are:

 ● What factors have contributed to the growth of the PRS?

 ● Of those currently renting, how many are doing so because it suits them and how many
    because they genuinely can’t afford a deposit or mortgage yet?

 ● What are the affordability challenges facing (primarily) young people today and how can they
    be tackled?

The 2018 PRSim LSL Tenant Survey revealed that 66% of tenants are happy with renting
privately, certainly for the time being. They value the flexibility it allows them and appreciate the
good standard of living it offers.

While satisfaction levels were broadly stable among the various groups of tenants categorised for
the survey – ranging from 63% to 72% – it was the group dubbed ‘Budgeting Families’ who were
the least satisfied (63%), possibly because they are juggling rent with higher costs, such as family
expenses including childcare.

This report aims to dig deeper into why so many people are renting today, considering whether
affordability to buy is the key driver or if renting is actually the right thing for them at this time in
their lives.

Ultimately, we ask this question: is the PRS primarily providing a much sought-after type of
accommodation, or is it growing at the expense of those trying to get on the property ladder?

                                                      6
PART ONE
The growth in the PRS

As the English Housing Survey graph below illustrates, the number of people renting privately has
more than doubled since buy to let mortgages were introduced in 1996. Interestingly, we can see
that as the PRS has grown, it has overtaken the proportion of households renting within the social
sector, while the percentage of owner occupiers has fallen.

         Trends in tenure, 1980 to 2016-17

From this chart and table, it is clear the PRS has grown not just at the expense of home ownership.
A large proportion of those renting privately now would have done so in the past as part of the
social sector. As such, these tenants are never likely to be able access home ownership.

Sources: EHS 2016-17 https://www.gov.uk/government/collections/english-housing-survey#2016-to-2017
http://webarchive.nationalarchives.gov.uk/20120919150321/http://www.communities.gov.uk/documents/statistics/pdf/134
6239.pdf

                                                        7
However, this isn’t the full story – there has been a key change in tenure for householders aged
under 30. In 1996, around 15% more young people owned than rented privately, but by 2006 the
pendulum had swung in favour of renting:

When we look into the timing of the fall in home ownership of those in the 25-34 age bracket, the
change over the following decade (2005-6 to 2015-6) is even more pronounced, as illustrated in
the table from the 2015-16 English Housing Survey below. This suggests the recession has
caused a significant boost to the PRS at the expense of home ownership. This may be due to
employment uncertainty and lack of wage growth.

However, bearing in mind this was the same time as the recession hit when there was a 47% fall in
first-time buyers and many home owners had to let because they couldn't sell their home, it could
well be that the credit crunch, property price falls, unemployment and lack of wage growth during
this time are potentially the key drivers behind the continued growth of renting during this period.

Source: https://static.halifax.co.uk/assets/pdf/mortgages/pdf/halifax-first-time%20buyer%20review-13-january-2017-

                   Source: English Housing Survey Headline Report 2015-16

                                                          8
Looking at figures for the percentage of households in England and Wales buying with a mortgage
versus renting privately, there is again a marked shift. Over the last 20 years, the PRS has gone
from being a quarter of the size of the mortgaged property market to two thirds of the size:

While growth in the PRS has reduced the number of people buying with a mortgage, we have also
seen the baby boomer generation paying off their mortgages and an increase in those buying with
100% cash. This has resulted in more people owning a home outright, with 1.5m mortgages being
paid off over the last 10 years:

According to the EHS, “Since 2013-14 there have been more outright owners than mortgagors,
and the proportion of mortgagors has declined.”

Although we are now through the recession with many areas (although not all) seeing recovery or
growth in their house prices, the PRS is expected to grow further. In research published in 2017,
Knight Frank stated that demand for the rented sector is expected to continue to grow, forecasting
that there will be some 5.79 million households in the PRS by the end of 2021, approximately a
20% increase.

Source: http://www.knightfrank.co.uk/blog/2017/06/29/tenant-survey-2017-meet-the-tenants

                                                         9
What factors have contributed to the PRS growing in the way it has?

Fundamentally, growth is caused by demand, and there can be no argument that there has been
huge demand for privately rented accommodation over the past 20 years. However this is often
attributed to affordability issues as opposed to changes in culture – and indeed the impact of
government policies such as a reduction in the support of social housing.

Here are the key contributors to the growth in demand for the PRS:

A shortage of social housing
The Thatcher government initiated the sale of nearly 2 million council houses in 1980 with ‘Right
to Buy’ – the result of this can be seen in Figure 1.1 in the previous section, with the growth in
home ownership reflecting the drop in social renting. Since then, successive governments have
failed consistently to replenish much-needed social housing stock. This has left tenants who
qualify for social housing with no alternative but to rent privately.

According to the English Housing Survey, tenants in the PRS who are in receipt of Housing
Benefit account for 22% of the sector and clearly are unlikely to be in a position to be able to buy.

More students, both UK and foreign, living away from home
The student population has increased by nearly 800,000 in the last 20 years - now standing at
2.27 million – and the construction of purpose-built accommodation hasn’t kept up. This is now
being addressed with a surge in institutional investment in the ‘multihousing sector’, providing
desirable, high-end accommodation, primarily for students. Knight Frank estimates that this
relatively new sub-sector within the PRS is currently worth £25 billion and will be worth £70 billion
by 2022.

In addition, the introduction of student loans has made it more difficult for those in their 20s to
secure a mortgage and purchase a home.

The influx of migrant workers from the EU
Since Tony Blair’s government relaxed border controls for Eastern European migrants in 2004,
there has been a huge influx of EU nationals to the UK. Figures indicate that in 2015 there were
around 3.2m EU citizens living in the UK and around 1.2m UK nationals living elsewhere in the
EU, giving a total net migration figure of around 2m. In 2015 alone, net migration of EU citizens
was estimated at 184,000, up by 10,000 on 2014.

Sources: https://assets.kpmg.com/content/dam/kpmg/uk/pdf/2017/05/brexit-and-student-accommodation.pdf
https://kfcontent.blob.core.windows.net/research/707/documents/en/the-uk-tenant-survey-2017-4743.pdf
http://www.thisismoney.co.uk/money/mortgageshome/article-3859064/Mortgage-lenders-signal-rising-student-debt-
levels-potential-crisis.html
https://fullfact.org/immigration/eu-migration-and-uk/
http://www.migrationobservatory.ox.ac.uk/resources/briefings/eu-migration-to-and-from-the-uk/

                                                         10
Increasing numbers of transient workers and those in temporary employment
These are people on short-term contracts that may require them to move regularly or their income
is such that it is difficult to secure a mortgage, so a six-month tenancy agreement is an essential
option for them to put a flexible roof over their heads.
Economic uncertainty
Ten years ago, the credit crunch created huge economic uncertainty over finances and job
security, and now there’s Brexit. In times of economic uncertainty, people tend to hold on to their
money and back away from making long-term financial commitments, such as taking on a
mortgage. Renting is a much more flexible tenure if people’s circumstances change and they need
either to relocate or cut back on household expenditure.
Young people who can’t afford to buy, but are keen to move out of home
Several generations ago, people often lived with their parents until they got married, when a
property was bought with two incomes. However, things have changed a lot since then and,
although some still stay or move back home, working adults can leave home earlier and rent their
own homes – whether that’s a flat or house share with friends, living with a partner or on their own.
Widespread affordability issues with buying
The affordability debate will be discussed in detail in Part Three, but it’s a fact that levels of home
ownership set off on a downward trend from the mid-2000s. The question is how much this was
due to affordability and how much of it was actually driven by the recession, which made buying a
property much riskier option than renting. The number of first-time buyers (and other buyers)
during the start of the credit crunch fell by 50% and remained at that level for four years, not
recovering until 2015 and some areas have still to see prices recover at all.
It is clear from this data that factors prior to the recession – such as an increased number of
students, more migration and economic uncertainty – have played a major part in driving the rise in
the PRS.
11Although affordability has played a part, it is quite possible that the recession has had a bigger
impact on the fall in home ownership, encouraging many to stay in the PRS rather than buy a
home of their own.
So if tenant demand, cultural changes and government policy have driven the PRS in many cases,
rather than affordability issues, why are so many ‘happy’ to remain renting, if they could afford to
buy? One rarely mentioned factor could well be the dramatic increase in the quality of
accommodation and good value being offered by some landlords, resulting in renting being as
good as buying and, in some cases, better.
Images: GCandan Susoy , Gabriel Murad, 4919421 | Dreamstime
12Has the quality of the ‘product’ created its own demand?
The introduction of buy to let mortgages in 1996 was followed by rush of investors into the market
and a sudden increase in available properties. Within five years, ARLA had recorded a 49%
increase in new landlords.
Buy to let boomed, fuelled by:
● poor pension and financial returns
● attractive mortgage deals
● an explosion of companies offering buy to let acquisition and management services
● a whole lot of marketing and media coverage through the 2000s ‘selling’ property investment
as the best route to a secure financial future.
At the same time, lots of buy to let investors were encouraged to purchase new builds, often city
centre flats which make attractive living for those in their 20s. For those who rent existing homes,
various pieces of legislation directed at improving standards were passed, forcing the quality of
accommodation in the PRS to rise – especially after the Housing Health and Safety Rating
System (HHSRS) and mandatory licensing of HMOs came into force in October 2006.
Source: http://www.telegraph.co.uk/finance/personalfinance/investing/buy-to-let/11176988/1996-the-birth-of-buy-to-let-
Britain-in-numbers.html
13Image: Wav ebreakmedia Ltd | Dreamstime
These factors, together with a recession which in 2009 led to many more homes being rented
because they couldn’t be sold, have led to increasing competition between landlords to attract the
best tenants and the best rents in many areas. The result is that the quality of many of the
properties on the market can now be superb: they’re safe, modern, well-equipped and often
staged to present tenants with a highly desirable home.
Far from renting being the ‘poor relation’ to home ownership, the best properties out there today
offer people a standard of living they would not be able to enjoy in a property they could afford to
buy – and, to top it off, all the maintenance is taken care of by their landlord – as long as they are
one of the ‘good’ ones.
Another indication that it is not just affordability that is driving the growth of the PRS is looking at
the increase in renting for other generations, not just those not currently on the ladder. For
example, Rightmove estimate that some 15% of tenants are also landlords.
14Who is renting and why?
In early 2018, PRSim and LSL Property Services carried out a comprehensive survey of their
tenants, which included questions about why they were renting and what their expectations
were about future home ownership. They were able to put each of the 3,752 tenants who
responded into one of four types:
Source: PRSim LSL Tenant Survey 2018
Sources: Citizens Advice report: https://www.citizensadvice.org.uk/Global/CitizensAdvice/Housing%20Publications/PRS-
AStateofDisrepair.pdf
http://www.knightfrank.co.uk/blog/2017/06/29/tenant-survey-2017-meet-the-tenants
15As might be expected, the survey found that the older the tenant, the less likely they were to
expect to buy their own home in the future. Only 34% of the ‘Reconciled with Renting’ (RwR)
group said they intend to buy a home in the future.
In contrast, 81% of ‘Young Independents’ plan to buy in the future, signifying confidence that they
have sufficient years ahead to save and earn enough to be able to afford a home; similarly 74% of
‘Flexible Professionals’ and 67% of ‘Budgeting Families’ plan to buy one day. Overall, the 2018
survey showed 63% of tenants plan to buy in the future, versus 58% in 2017.
In Knight Frank’s 2017 tenant survey, just over two thirds of all respondents (68%) expected still to
be renting in three years’ time, with the remaining 32% expecting to have been able to buy a
home.
In terms of general happiness with renting, 66% of PRSim LSL respondents overall said they were
happy, with satisfaction at its highest in the RwR category, at 72%. In the Knight Frank survey,
37% of tenants were renting through choice, rather than due to affordability issues.
Reasons cited include flexibility, being able to live in an area they could otherwise not afford, and
avoiding the responsibility of home ownership.
As one FP tenant in the PRSim LSL Tenant Survey responded: “‘I owned a house previously and
now I’m renting after a recent relationship split. It gives me flexibility if I want to move and lets me
live in an area that I might not be able to afford if I was buying again.”
Source: http://content.knightfrank.com/research/707/documents/en/the-uk-tenant-survey-2017-4743.pdf
Images: Adam Borkowski, Pav la Zakov a, Spotmatik | Dreamstime
16PRSim LSL’s previous tenant survey, published in 2017, also showed a growth in the trend for
renting longer term. The percentage of tenants who have rented for six years or more increased
by 4% over the last 12 months, standing at 33% in 2017, up from 29% in 2016. Knight Frank’s
figure for 2015-16 is around 24%, supporting this trend.
Source: https://www.prsim.co.uk/wp-content/uploads/2017/07/LSL-Tenant-Survey-2017.pdf
Those without children made up the largest proportion of private renters according to Knight
Frank’s survey at 59%; couples with children were only the third largest demographic at 20%.
According to Knight Frank, these figures have remained constant for the last two years.
Tenants making a conscious decision to rent, rather than buy
In Savills’ YouGov survey of 2,300 PRS tenants in 2014, nearly a quarter of respondents (24%)
said they choose to rent ‘because it is less hassle and they like the flexibility’. Interestingly, 8% of
tenants said they were renting because they had chosen to invest their money elsewhere, rather
than in a home.
Three years on, over a third of tenants (37%) in Knight Frank’s 2017 survey said they were renting
primarily through choice, rather than because they couldn’t afford to own a home.
The main three reasons they gave for having made that decision were:
● Flexibility of tenure
● Not having the responsibilities that come with of owning a property
● Being able to live in a better area than they could afford.
Furthermore, some young people simply don’t want to compromise their lifestyle and make the
sacrifices necessary to save for a deposit. One of the respondents to a survey from Halifax and
the National Centre for Social Research said: “I’m not interested in trying to stop my life now when
I’m 31 to not go out and not do anything to save up for the £40,000 deposit I need to buy in
London. I'd rather live my life now.”
17However, all this research still suggests an estimated two-thirds of people who, given the choice,
would prefer to own their own home and are only renting because it is an appropriate temporary
solution or because they simply can’t afford to buy.
What the data does suggest is the idea that the Private Rented Sector has grown at the expense
of those wanting to buy isn't necessarily accurate. Many may want to buy in the long term, but for
the million+ who are on council waiting lists, needing temporary/flexible accommodation and for
those looking to move up or save for a deposit, for now renting suits their purposes.
Sources: http://pdf.euro.savills.co.uk/residential---other/yougov-survey.pdf
https://www.moneywise.co.uk/news/2011-05-31/young-people-choosing-to-rent-rather-buy
This means any policy makers need to be aware that reducing the number of homes in the PRS
could damage the number of homes available to those that need them and not necessarily result in
those wanting to buy being able to afford to do so.
In addition, millions more are renting because their housing needs are temporary. They are
students or migrant workers.
Finally there are those that would prefer to buy but they are divided into two groups: those who
can’t buy because they are working away temporarily and those who are in an awkward family
situation such as divorce which can take years to settle.
It is true there are a proportion who are renting because they can’t afford to buy, but there is still a
lack of robust research that pinpoints exactly what proportion of people in the PRS are in this
18PART TWO
The affordability debate
In their February 2017 Housing White Paper, the government seemed to accept for the first time
that some people are renting because it suits them. However, based on PRSim LSL Tenant Survey
figures, around 58% of tenants do intend to own a home in the future, so is it just affordability
challenges and better rental stock which is stopping them from buying?
It is important to understand that the affordability issue has two parts; the deposit and the mortgage
borrowing. While both may be out of reach for some people, others may be frustrated when they
can satisfy one element but not the other.
In assessing how affordability has changed, we will consider the last 30 years, from 1987 to 2017,
as this takes into account two economic booms and recessions. It also includes the sometimes
forgotten era of 15% mortgage rates in the 1990s when some people were spending 50% of their
income on mortgage repayments.
Image: Witthay a Prasongsin, Daniel Wiedemann, Julija Sapic, | Dreamstime
19What are all the factors affecting affordability?
As reported in the PRSim LSL Tenant Survey, it is those aged 35 and under who represent the
majority of tenants who want to buy and can’t currently afford to.
One of the reasons for the difficulty in saving for a property may simply be that they are spending
on life events rather than saving for a deposit to buy a home – especially if they feel this is out of
their reach.
According to research by estate agent Tepilo, many young people spend over £200 a month on
leisure activities and say they are unwilling to give up holidays, meals out, luxury groceries and
new clothes. The average cost of a British wedding is now over £33,000 (which includes a
honeymoon at an average of £3,630) and many people are splashing out on expensive stag and
hen events beforehand.
This kind of expenditure doesn't apply to everyone, but it does apply to some who claim they can't
afford to buy, when spending cuts could help them to save for a deposit.
Sources: http://www.prsim.co.uk/wp-content/uploads/2017/07/LSL-Tenant-Survey-2017.pdf
http://www.propertychecklists.co.uk/articles/first-time-buyer-property-savings,
https://www.standard.co.uk/lifestyle/london-life/hen-and-stag-dos-now-cost-a-staggering-350-per-person-compared-to-
90-ten-years-ago-a3629491.html,
http://www.independent.co.uk/life-style/average-british-wedding-cost-uk-27000-hitched-venue-honeymoon-food-london-
midlands-a7937551.html)
20Fall in savings
The drop in savings ratio from the late 1990s through to the recession does mirror a fall in first-time
buyers, but it also follows rapid rises in house prices.
Source: ONS
What is interesting though is that the number of FTBs in 2017 was higher than it's been for 10
years and this rise matches an increase in savings by the younger generation during the
recession.
According to a report carried out in 2012 on ‘Spending Power Across the Generations’, the older,
cash-rich generations are significantly less ‘careful’ with their money than the under 30s. Some key
findings of the report:
● Spending by the over 75s has doubled in the last decade, but decreased by a third for the
under 30s.
● Spending power of the under 30s has declined because of high youth unemployment following
the recession, wage freezes for those in work, high housing costs and paying off university
debts.
● By 2011, people aged 65 and over were spending £1.3 billion more on foreign travel than they
had been in 1999, whereas those aged 16-34 were spending £922 million less.
● The under 30s spent 18% less per capita on restaurant bills in 2010, compared with 2000.
Those aged 65-74 spent 33% more and the over 75s spent 30% more.
● People aged 65-74 spent 8% less on new cars from 2000 to 2012, while the younger
generation spent 80% less.
Source: https://static.halifax.co.uk/assets/pdf/mortgages/pdf/2018-01-27-number-of-ftb-highest-since-2007-HPI.pdf
21Lack of wage growth versus house price growth
The other issue is what people can afford to pay for a property. The fall in mortgage rates from
5-7% before the recession to under 3% means that the cost of servicing a mortgage has halved,
something which is rarely mentioned in the affordability discussion and isn’t considered in the
measure of ‘average wages versus average house price’.
This fall in mortgage costs is good news for those where house price growth has kept in line with
wage inflation. However, for those who have, for example, had their wages restricted due to public
sector pay caps and low if non-existent wage growth imposed on them by the private sector, this
has made owning a home harder.
This is especially true in areas like London where prices since the market high of 2007 have risen
by 40-80% across the London Boroughs.
Where cash rich buyers can afford to purchase property in short of stock areas such as London,
the South and East of England, what we have seen is property prices recover quickly from the
recession. On the other hand, for the younger generation, clearly spooked by the recession, it is
now likely in these same regions that they are finding their wage growth hasn’t increased in line
with general inflation, let alone increases in property prices.
More people living on their own
As well as looking at house price growth versus wages, another thing which is often overlooked
and is, to some extent, a hidden affordability issue, is found in the English Housing Survey. In the
20 years from 1995-96 to 2015-16, the proportion of single-person households increased by 5%,
up from 28% to 33%.
When one person has to shoulder the financial burden of purchasing a home, it’s naturally less
affordable. If renting as a single person, saving for a deposit to buy is even harder, not to mention
that they will be making a mortgage application based on just one salary. Furthermore, lenders
cannot currently take into account the rent people pay when assessing affordability.
So affordability can play a part in first-time buyers not getting on the ladder and preferring to rent,
but to really understand the other issues stopping people getting on the ladder, we need to look at
other factors.
For example, this anomaly between the way renting and buying affordability is assessed means it
is possible to rent a property that people may not be able to afford to buy.
Sources: https://static.halifax.co.uk/assets/pdf/mortgages/pdf/2018-01-27-number-of-ftb-highest-since-2007-HPI.pdf
http://www.if.org.uk/wp-content/uploads/2013/01/Spending-Power-Across-the-Generations-Report.pdf
http://www.propertychecklists.co.uk/articles/london-property-price-update-January-2018
22Those in their 30s will remember the recession they experienced in their 20s
Add to the issues of a lack of savings, low wage growth versus house price growth (in some areas)
and the negative reaction to the recession and ten years on, someone who is now in their 30s will
have experienced one of the following:
● In areas like London and the South, property prices fell by 15-25% until around 2013, then
double digit annual house price growth was experienced for the next few years, which is likely
to have quickly outstripped their earnings.
● In contrast, it is only in recent years that those in the Midlands through to the North, Scotland,
Wales and Northern Ireland have started to see prices recover to the levels they were 10 years
ago. They are likely to have friends and family who did get on the ladder before the credit
crunch hit, but may well have seen little or no price growth in their house price and indeed may
still be in negative equity.
● Those who were able and brave enough to buy in their 20s at the low of the recession in 2009
will have seen good house price growth and are likely to now have enough equity to be able to
move on to their next home.
Property Prices - Regions Highest average Lowest average Market low Latest month's How much higher/ Year on year Annual Highest yearly
house price house price +/- versus data lower are latest change in price average average increase
pre-credit crunch during recession market height Oct-17 prices vs in Oct 17 increase since 2000
2007/08 2009 height in 2007/8 since 2000 Date % Increase
North East £139,400 £117,079 -16.01% £127,224 -9% 2.4% 6.0% Jan-04 34.8%
North West £152,427 £124,654 -18.22% £154,056 1% 3.9% 6.7% Jul-04 33.0%
Yorkshire & The Humber £150,233 £123,833 -17.57% £155,281 3% 3.3% 6.8% Jun-04 29.3%
East Midlands £159,537 £129,876 -18.59% £184,544 16% 7.0% 7.0% Feb-03 33.9%
West Midlands £165,807 £136,966 -17.39% £186,351 12% 5.2% 6.5% Jan-03 29.5%
South West £212,666 £171,356 -19.42% £251,376 18% 6.7% 6.9% Jan-03 29.8%
East £209,624 £168,263 -19.73% £289,168 38% 6.1% 7.5% Jan-03 28.9%
South East £238,670 £191,156 -19.91% £322,311 35% 4.6% 6.9% Jun-00 25.0%
London £298,596 £245,351 -17.83% £481,102 61% 2.1% 8.0% Apr-00 28.3%
Source: UK HPI
However all of them will be very well aware that buying a home will not always guarantee house
price growth and are therefore still quite cautious to get on or move up the ladder.
If affordability is the main issue for the fall in FTB numbers, is it just areas where house
price growth is outstripping wages that are seeing a fall?
The chart below shows the dramatic difference between regional house price changes. The North
East is still 9% down versus 2007/8, while London has risen by 61%.
If affordability is the main reason first-time buyers aren’t buying, then breaking the numbers down
on a regional basis should mean the most expensive regions would be the ones which had seen a
fall in first-time buyers.
23Although this is true of London – the most affected region, with first-time buyer mortgage
applications down 31% – we wouldn’t expect to see the next greatest fall in first-time buyers of
22% being in the North of England, nor the next biggest fall being Yorkshire and Humber (-18%).
In contrast, areas considered ‘expensive’, such as the South West and East Anglia – both of which
have seen house price growth in excess of 16% in the last 10 years – have suffered the least, with
first-time buyer numbers down just 6% and 7% respectively.
To look at the affordability of renting versus buying, we need to look into more detail on a regional
basis of the cost difference between the two tenures to examine the ‘old’ views that:
● Renting vs buying is ‘dead money’
● Buying vs renting is not necessarily the cheaper option it is claimed.
Source: Nationwide
24How affordability for FTBs has changed in different areas
When looking at affordability we tend to look at ‘average house price versus average wage’ but
this can disguise what is really happening on the ground.
Secondly, this ignores the ‘cost’ of affording a home ie how first-time buyers are assessed for a
mortgage and the finance they can raise based on their savings and salary.
Have individual FTB property prices changed so much?
First it is worth looking at how much affordability has changed for first-time buyers over the last
25-30 years, using ‘actual’, not ‘average’ examples. In both cases, the details for the earlier dates
are actual, while the figures for the current likely scenario are approximate.
What each of these case studies looks at is an individual property and a specific person’s job from
the late 80s and early 90s and compared the affordability if the same person with the same job
was buying in today’s market.
CASE STUDY 1
1988 – Actual details 2017 – Approximated likely details
Property: Flat in Chelmsford, Property: Flat in Chelmsford,
Essex Essex
Purchase price: £48,000 Purchase price: £200,000*
Buyer’s job: PA in estate agency Buyer’s job: PA
Annual salary: £7,636.69 Average PA salary: £24,252**
Deposit paid: £15,000 (31% / 196% 5% deposit: £10,000
of salary) – Parents
paid it
Mortgage £33,000 at 11.5% Mortgage £190,000
borrowing: interest only borrowing:
Monthly payment: £316.25 Monthly payment £909.27
(£3,795 per annum) (3% repayment): (£10,911.24 per annum)
Percentage 49.7% Percentage 45.6%
of salary: of salary:
Monthly payment £475
(3% interest only): (£5,700 per annum)
Percentage 23%
of salary:
*Property price growth of 5.64% per annum; **Salary growth of 4.54% per annum
25CASE STUDY 2
1992 – Actual details 2017 – Approximated likely details
Property: House in Nottingham Property: House in Nottingham
Purchase price: £31,000 Purchase price: £110,000*
Buyer’s job: Postman Buyer’s job: Postman
Annual salary: £10,000 Annual salary: £18,000**
5% deposit paid: £1,550 (15% of salary) 5% deposit: £5,500 (30% of salary,
although 25% could
come from Help to Buy
ISA
Mortgage £29,450 at 10% Mortgage £104,500
borrowing: interest only borrowing:
Monthly payment: £245.41 Monthly payment £500.10
(£2,944.92 per annum) (3% repayment): (£6,001.20 per annum)
Percentage 29.4% Percentage 33%
of salary: of salary:
Monthly payment £261.25
(3% interest only): (£3,135 per annum)
Percentage 17%
of salary:
*Property price growth of 5.64% per annum; **Salary growth of 4.54% per annum
What these case studies show is where wages have kept up with, or nearly kept pace with, house
prices, properties remain affordable, especially from a mortgage perspective, even though first-
time buyers have been switched to repayment. If they were allowed to borrow interest only, the
mortgage payments would actually be a lot lower than the past.
What is tougher though is securing the deposit, even at levels of 5% and with help from the
government or parents.
It’s clear that where property prices have outstripped wage growth, this is where the affordability
issue can cause those who can’t save for a deposit, to rent rather than buy.
One of the issues with the comparison of renting versus buying since the credit crunch is the
availability of mortgage finance, coupled with house price inflation being typically a lot higher than
rental inflation.
These two factors have fundamentally changed the financials of renting versus buying, making
renting potentially a much easier and cheaper option, especially short term, and acknowledging
the fact that repayment means they pay off the mortgage and, if prices are rising, build equity.
26Change in benefits of renting versus costs of owning
Although some reports suggest it is cheaper to buy than rent, these are often based on
assumptions such as the purchaser buying a three-bed home or the assumption that the buyer has
a large deposit. This means the analysis doesn’t necessarily affect the genuine choice most
people have to make between renting versus buying a home.
Historically, house prices tend to rise, on average by approximately 7% per year (UKHPI), while
rents rise at around 2% per year (ONS). Clearly over time, renting therefore has become more
affordable than buying. While we have had a recession where prices were crashing for several
years if not more, there is little incentive to buy when you can rent a perfectly reasonably priced
home which allows flexibility and doesn’t require saving thousands of pounds for a deposit.
Using a property in the East Midlands worth £150,000 as an example, here is an illustration of the
approximate difference in cost between owning and renting:
£150,000 PROPERTY IN THE EAST MIDLANDS
Up-front costs Buy Rent
Deposit £6,000 + government 25% £685
top-up to £7,500
Mortgage/tenant fees: £1,000 £300
Stamp Duty Land Tax: £0 £0
(assuming first-time buyer)
Survey fees: £500 £0
Legal costs: £1,000 £0
TOTAL UP-FRONT COSTS £8,500 £985
Annual costs Buy Rent
Repayment mortgage at 4% £8,240.76 £0
over 30 years
Rent at £572.50 p/m £0 £6,870
Council tax, utility bills, TV, £3,665 £3,665
phone, contents insurance
Buildings insurance £167 £0
Maintenance: £1,000 £0
TOTAL ANNUAL COSTS £13,072.76 £10,535
27So it costs £7,515 less up front to rent than buy (£8,200 less if you assume the entire deposit is
returned at the end of the tenancy) and it’s £2,537.76 a year cheaper, which is quite a significant
overall saving for tenants. What this does not take into account though is any growth in property
prices or indeed that the buyer is paying off the mortgage they owe.
However as a straight comparison, it is clear that renting can be much better value initially than
buying, especially in a flat property price market. The landlord pays any maintenance costs and
the tenant has the flexibility to move up or down the rental housing ladder.
With regards to affording property versus renting in Nottingham, Rightmove show that at the time
of this report being produced, there were more than 200 properties for sale for less than £100,000,
allowing two people to buy with a 5% deposit of which 25% could be topped up with the
government’s Help to Buy ISA scheme and mortgage for each of £48,000.
28In London the comparison is even starker, showing that renting versus buying a property worth
£400,000 (average price paid by a first-time buyer according to UKHPI) saves someone in excess
of £5,000 per year and reduces the savings requirement from over £20,000 to just over £2,000.
£400,000 PROPERTY IN LONDON
Up-front costs Buy Rent
Deposit using Lifetime ISA* £15,937 (5%) £1,938
Mortgage/tenant fees: £1,000 £400
Stamp Duty Land Tax: £5,000 £0
(assuming first-time buyer)
Survey fees: £700 £0
Legal costs: £1,200 £0
TOTAL UP-FRONT COSTS £23,837 £2,338
Annual costs Buy Rent
Repayment mortgage at 3% £20,426.76 £0
Rent at £1,400 p/m £0 £16,800
Council tax, utility bills, TV, £2,940 £2,940
phone, contents insurance
Buildings insurance £0 £0
Maintenance/service charge: £1,623** £0
TOTAL ANNUAL COSTS £24,989.76 £19,740
*https://www.gov.uk/lifetime-isa
**£1,123 standard service charge plus £500 standard maintenance for flats only
Bearing in mind the ease and flexible nature of renting versus buying and how in the short term it
tends to be better value, it is not a huge surprise that renting has grown at the expense of home
ownership, particularly during the recession.
For more comparisons of renting versus buying, visit regional reports on Propertychecklists.co.uk
29Availability of mortgage finance
Mortgage borrowing is affected by two key things: what criteria the lender requires the borrower to
satisfy, ie the measures they use to determine how much of a risk the loan is, and the interest rate,
ie the cost of borrowing, which will affect the amount of the monthly repayments.
Historically, we’ve seen mortgages of 100% loan to value (LTV) and sometimes even more; if the
property was going to be improved, some lenders would advance a loan based on the value of the
property post-renovation or refurbishment, granting total mortgage lending of up to 125% LTV.
However, in the aftermath of the credit crunch, lenders withdrew their more generous products
amid calls for an end to ‘irresponsible’ lending.
In April 2014, mortgage lending tightened significantly with the Mortgage Market Review, which
saw:
● a ban on ‘self-certified’ mortgages
● restrictions on interest-only deals
● far greater scrutiny of borrowers’ outgoings
● assessment of affordability being based on rates rising by 3%
● an end to cheaper borrowing through interest-only loans for homeowners, so affordability is
based purely on a more expensive repayment basis.
In addition to standard utility bills, credit card and loan repayments and other contractual financial
commitments, lenders will now consider how much borrowers regularly spend on ‘extras’ such as
entertainment, holidays, gym memberships and toiletries. They are expected to look ahead and
‘stress test’ people’s ability to repay the mortgage into the future, considering the likelihood of
things like redundancy, having a baby or taking a career break.
Image: Dmitrijs Terentjev s, Elliot Westacott, Theclarkester | Dreamstime
30One big frustration for tenants is that lenders don’t take into account the amount of rent they’re
currently paying – and may have been paying for a number of years – so they could be refused a
mortgage costing £800 a month when they have been paying £1,200 a month for five years.
According to a recent Halifax report on first-time buyers, which looks at attitudes to buying their
first home:
“Even if [FTBS] have managed to raise a deposit, a third (33%) feel mortgage criteria is too difficult
for them to meet.”
The report led Martin Ellis, Halifax housing economist, to comment: “Even with the highest number
of first-time buyers in the last decade in 2016, many young people still feel they are running
financial gauntlet – saving for a deposit, finding an affordable property in the right area and
managing to fund living in the meantime.”
Image: Tamás Ambrits, Tatjana Krstic, Iakov Filimonov | Dreamstime
31What help is there currently for those who are struggling to buy?
For those who are struggling to save for a deposit and/or to whom lenders are not prepared to offer
a big enough mortgage advance, there are some options. Although not everyone will be able to
take advantage of all of them, those who wish to get out of the PRS and onto the property ladder
could be in a position to pursue at least one path.
‘The Bank of Mum and Dad’
Increasingly over recent years, parents who are now third generation home owners and who
are inheriting substantial wealth from grandparents and parents, have been able and willing
to help their children get on the property ladder.
They are doing this by lending or giving them the deposit or taking advantage of specialist
mortgage lending products such as the Loughborough First Time Family Deposit or the
Barclays Family Springboard mortgage.
Some then pay interest back to their parents on the amount of the loan and/or have an
agreement that the loan will be repaid at a future date, either when the property is sold or via
a remortgage. Some consider it a gift. While some people may be reticent about asking for
money, the arrangement can be structured so that it is mutually financially beneficial.
For those who don’t have access to ‘family’ money, there are schemes which allow the
government to step in and help:
Help to Buy Equity Loan Scheme
This is a government-backed scheme, launched in April 2013, to assist financially in the
purchase of certain new builds worth less than £600,000 in England (under £300,000 in Wales
and £230,000 in Scotland).
As long as the buyer has a 5% deposit and meets the criteria, the government will provide
them with a loan for up to 20% of the purchase price (40% in London, 15% in Scotland),
interest free for the first five years, so the buyer only needs a 75% mortgage. When the
property is sold or the borrower repay the loan, the relevant percentage of the current value is
repaid to the government. If a property was bought for £200,000 and a 20% loan advanced
(£40,000), and it was sold five years later for £220,000, £44,000 would need to be repaid.
By the end of September 2017, more than 144,000 H2B loans had been taken out, 81% by
FTBs.
Source: https://www.gov.uk/government/statistics/help-to-buy-equity-loan-scheme-and-help-to-buy-newbuy-
statistics-april-2013-to-30-september-2017
32Help to Buy ISA/ Lifetime ISA
Many lenders are offering the government-backed ISA schemes, where savings can be
topped up by the government by 25%.
For the Help to Buy ISA savers need a minimum balance of £1,600 and the government will
top it up on closing by 25% – up to a maximum bonus of £3,000. So if someone has saved
£12,000 in one of these ISAs and wants to withdraw it to use as a deposit for a home, the
government will pay over an additional £3,000. That bonus is on top of the lender’s own
interest rate. Each person buying the house can take out a Help to Buy ISA and benefit from
the bonus, so a couple buying together could receive up to £3,000 each, potentially adding
£6,000 to their deposit.
The Lifetime ISA (also known as a LISA) differs in that the 25% bonus is paid annually, up to
a maximum of £1,000 per year. Savers can keep the account and still receive top-ups after
purchasing a home, and use it to save for retirement.
Shared ownership
This is something that has been around for many years, whereby the purchaser buys a
percentage of the property and pays a subsidised rent on the portion they don’t own. It is
offered by a number of developers and there is usually the option to buy the rest of the
property at a later date. This gives the benefit of security of tenure without the financial
burden of a larger mortgage.
Buyers can also consider buying with a friend or relative and sharing the ownership that way.
In this case, legal advice should be sought to determine whether it is more appropriate to
own the property as ‘joint tenants’ or ‘tenants in common’.
Interestingly, of these schemes, the biggest take-up is not necessarily in the areas with the worst
affordability issues. The latest data on Help to Buy equity loan on new builds shows:
● The majority of sales were to first-time buyers (116,898) representing 81% of total sales
● The average (mean) purchase price was £243,818
● The top six local authorities in terms of completed sales are Wiltshire (2,333), Central
Bedfordshire (2,042), Wakefield (1,980), Leeds (1,932), County Durham (1,867) and Bedford
(1,753)
So not one of the London Boroughs appears as a top area for the take-up of these schemes.
Source: https://www.gov.uk/government/statistical-data-sets/help-to-buy-equity-loan-scheme-quarterly-statistics
33When it comes to shared ownership, according to a report from UK Finance (then the CML):
Around 200,000 UK households currently live in shared ownership homes and, unlike Help to Buy,
this very much seems to be helping support sales in areas where prices have seen highest growth,
with London, the South East and East of England being the three biggest regions for the
government-supported scheme:
With government plans to grow the sector by up to 70% over the next five years, it does appear
this scheme is very much something that is helping to overcome the affordability issues in the
more expensive areas.
https://www.cml.org.uk/news/press-releases/shared-ownership-ugly-sister-or-cinderella/
34Conclusion
Has the private rented sector grown because of an increased need and desire for rented
accommodation, or because people who would rather buy are unable to afford to do so?
The question that this report has tried to answer is whether the PRS has grown purely due to
affordability issues or if there are more people preferring or needing to rent than buy.
The conclusions are:
1. The PRS has primarily grown:
● due to an increase in demand from those who would have previously accessed social
housing; students; migrant workers and
● because of the recession, especially the public sector ‘wage cap’ in areas such as
London where property prices have easily outstripped wage growth.
2. Areas which have seen an improvement in affordability are also seeing a fall in the
number of first-time buyers, suggesting house prices and wage issues are not the only
reason for the rise in the number of people renting versus buying.
3. Increased quality of accommodation in the PRS has reduced the ‘need’ to buy.
4. Affordability has played a part in increasing the need for people to rent rather than buy,
but part of this is due to renting being more accessible, less stressful and, when directly
comparing buying with a 5% deposit versus renting, it is cheaper in the short term to rent
than buy.
5. Increased mortgage restrictions and a ‘fear’ of buying are impacting on the number of
people buying a home.
6. Government schemes such as shared ownership are more successful in areas where
affordability is definitely difficult than schemes such as Help to Buy which tend not to match
areas where high house price growth has been experienced.
However it is clear that not enough research has been done currently to assess the individual
affordability issues from a job/location perspective.
When looked at individually, some people’s salaries have kept pace with house price inflation and
the fall in cost of servicing a mortgage has been so huge, especially since the 1990s, that although
prices have increased, the cost of the mortgage hasn’t necessarily increased at all, even when
35having to switch from interest-only to repayment. Indeed, if interest-only mortgages were still
allowed, despite price rises, the cost of a mortgage could remain the same or even have fallen,
although it is more difficult to raise the deposit.
The issue moving forward is to appreciate that the PRS is a sector that provides, in the main, good
quality accommodation which is often much cheaper and more easily accessible than buying a
home. This reduces the ‘incentive’ for people to buy rather than rent – whether they are in an area
with high price growth or non-existent price growth.
The issues for the government to consider for the future are therefore:
● Whether home ownership is really right for everyone
● How to incentivise and enforce PRS properties to be legally and safely let
Currently the ‘crackdown’ on BTL investment could mean dampening stock levels so far that a
growing demand makes renting become more expensive, damaging its accessibility for those who
could and should never buy, eg those on benefits, students or migrant workers.
Secondly it needs to re-examine the crackdown on mortgage lending. Although to some extent
tighter criteria is a good thing for the market longer term, this in itself may well be preventing many
getting on the ladder, and preventing the government from delivering their own policies.
Ideas which could be considered to help successfully grow home ownership, but in a way that
everyone benefited, rather than creating ‘winners and losers’ in the market, include:
● Providing interest-only mortgages for an initial period of a number of years, rather than insisting
on repayment from day one of purchase
● Incentivising landlords to sell to their tenant through tax reductions.
Overall, affordability is one of the reasons the PRS has grown, but it is certainly not the main
reason. More research on individual regions and wage changes versus house price growth needs
to be investigated to gain a better understanding of the true affordability issues. Without this
additional research, it is likely that government will struggle to create the best policies to improve
affordability and home ownership.
36You can also read