A DIVISIVE SHUFFLING APPROACH (VISTA) FOR GENE EXPRESSION ANALYSIS TO IDENTIFY SUBTYPES IN CHRONIC OBSTRUCTIVE PULMONARY DISEASE
←
→
Page content transcription
If your browser does not render page correctly, please read the page content below
Menche et al. BMC Systems Biology 2014, 8(Suppl 2):S8
http://www.biomedcentral.com/1752-0509/8/S2/S8

 RESEARCH                                                                                                                                       Open Access

A diVIsive Shuffling Approach (VIStA) for gene
expression analysis to identify subtypes in
Chronic Obstructive Pulmonary Disease
Jörg Menche1,2,3†, Amitabh Sharma1,2†, Michael H Cho4, Ruth J Mayer5, Stephen I Rennard6, Bartolome Celli7,
Bruce E Miller5, Nick Locantore8, Ruth Tal-Singer5, Soumitra Ghosh5, Chris Larminie9, Glyn Bradley9, John H Riley9,
Alvar Agusti10,13, Edwin K Silverman4, Albert-László Barabási1,2,3,11,12*
From High-Throughput Omics and Data Integration Workshop
Barcelona, Spain. 13-15 February 2013

  Abstract
  Background: An important step toward understanding the biological mechanisms underlying a complex disease is
  a refined understanding of its clinical heterogeneity. Relating clinical and molecular differences may allow us to
  define more specific subtypes of patients that respond differently to therapeutic interventions.
  Results: We developed a novel unbiased method called diVIsive Shuffling Approach (VIStA) that identifies
  subgroups of patients by maximizing the difference in their gene expression patterns. We tested our algorithm on
  140 subjects with Chronic Obstructive Pulmonary Disease (COPD) and found four distinct, biologically and clinically
  meaningful combinations of clinical characteristics that are associated with large gene expression differences. The
  dominant characteristic in these combinations was the severity of airflow limitation. Other frequently identified
  measures included emphysema, fibrinogen levels, phlegm, BMI and age. A pathway analysis of the differentially
  expressed genes in the identified subtypes suggests that VIStA is capable of capturing specific molecular signatures
  within in each group.
  Conclusions: The introduced methodology allowed us to identify combinations of clinical characteristics that
  correspond to clear gene expression differences. The resulting subtypes for COPD contribute to a better
  understanding of its heterogeneity.

Background                                                                             suggest a genetic component to the disease [2-6]. Yet,
Chronic obstructive pulmonary disease (COPD) is one of                                 COPD is a very heterogeneous and complex disease, with
the most prevalent chronic diseases (4th cause of death                                varied pulmonary and extra-pulmonary clinical manifesta-
globally), with increasing incidence worldwide. Under-                                 tions [7]. Understanding and characterizing this biological
standing of the disease pathobiology is far from complete                              and clinical heterogeneity could help identify subgroups
and only few novel therapeutic mechanisms of action have                               of patients (subtypes) that may benefit from different
been identified. Tobacco smoking is the main risk factor                               therapeutic strategies [8]. To investigate the genomic and
for COPD, but only a fraction of all smokers develops the                              pathobiological basis of COPD subtypes with distinct
disease [1]. This variable response to smoking, plus the                               clinical manifestations, we applied several novel and
observation that COPD aggregates in families, strongly                                 complementary computational strategies to differential
                                                                                       gene expression analysis. We used expression data from
* Correspondence: barabasi@gmail.com                                                   induced sputum samples of former smokers with COPD
† Contributed equally                                                                  and varying degree of airflow limitation. The patients are
1
 Center for Complex Networks Research and Department of Physics,                       a subset of the large ECLIPSE cohort, which is a multi-
Northeastern University, Boston, MA, 02115, USA
Full list of author information is available at the end of the article                 center, 3 year observational international study that
                                         © 2014 Menche et al; licensee BioMed Central Ltd. This is an Open Access article distributed under the terms of the Creative Commons
                                         Attribution License (http://creativecommons.org/licenses/by/2.0), which permits unrestricted use, distribution, and reproduction in
                                         any medium, provided the original work is properly cited. The Creative Commons Public Domain Dedication waiver (http://
                                         creativecommons.org/publicdomain/zero/1.0/) applies to the data made available in this article, unless otherwise stated.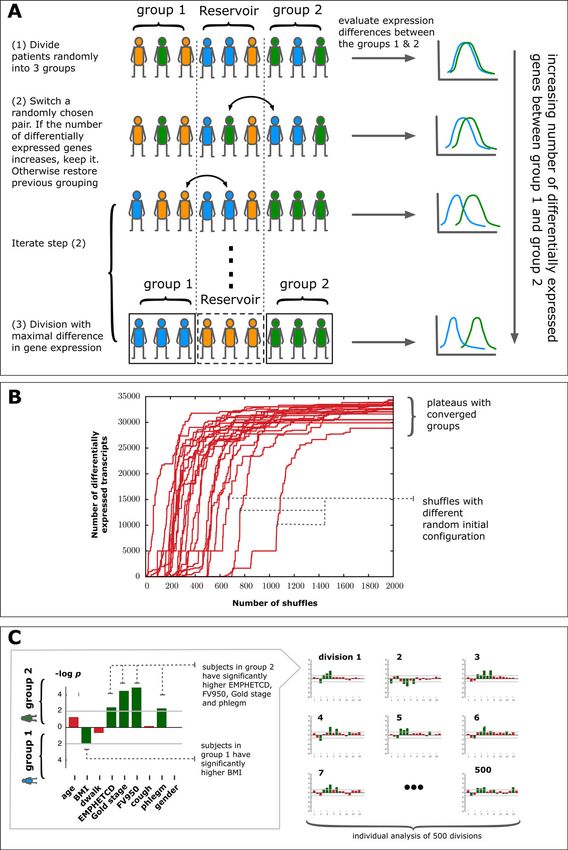
Menche et al. BMC Systems Biology 2014, 8(Suppl 2):S8                                                                           Page 2 of 13
http://www.biomedcentral.com/1752-0509/8/S2/S8

collected clinical, genetic, proteomic and biomarker mea-        Table 1 Summary of the characteristics of 140 subjects
sures in a population of COPD patients [9]. Specifically, in     with sputum gene expression data from the ECLIPSE
the current study we sought to: (i ) compare the gene            Cohort.
expression pattern between patient groups with different         Demographics and clinical data
clinical characteristics; (ii) conversely, assess the clinical   Age, yrs.                                        65 ± 5.5
characteristics of groups of patients with distinct gene         Males, %                                         66
expression patterns identified by a novel diVIsive Shuffling     Body mass index, Kg/m2                           26.8 ± 5.2
Approach (VIStA) developed specifically for this purpose         Smoking exposure, pack-yrs.                      48.3 ± 29.1
(see below). Unexpectedly, we found that the reverse             Annual Exacerbation rate, year-1                 0.98 ± 1.6
approach (ii) showed greater potential to identify specific      Lung function
pathways that may offer novel therapeutic targets [10]           FEV1, L                                          1.26 ± 0.45
than the traditional approach (i).                               FEV1, % revers.                                  9.5 ± 10.4
                                                                 FEV1/FVC, %                                      43.2 ± 11.5
Methods                                                          Imaging
Study design, participants and ethics
                                                                 Emphysema, -950HU %                              19.2 ± 12.2
The ECLIPSE cohort is a large, prospective, observa-
                                                                 Emphysema, extent code                           2.8 ± 1.8
tional and controlled study (Clinicaltrials.gov identifier
                                                                 Systemic inflammation
NCT00292552; GSK study code SCO104960), whose
design has been published previously [9]. Here, we inves-        hsCRP (mg/L)                                     8.24 ± 15.0
tigated differential gene expression in induced sputum           IL6 (pg/mL)                                      7.8 ± 36
samples of a subset of the participants that included 140        IL8 (pg/mL)                                      9.3 ± 5.2
former smokers with COPD (70 with moderate or GOLD               CCL18 (ng/mL)                                    121.7 ± 46
stage 2 and 70 with severe or GOLD stage 3-4 airflow             Fibronogen (mg/dL) -                             481.9 ± 107.6
limitation, matched for age and gender) with character-          TNFA (ng/mL)                                     103.2 ± 624
ized clinical and laboratory measures (Table 1). Sputum          SPD (ng/mL)                                      120.6 ± 78
induction and processing with dithiothreitol (DTT) was           Induced sputum
performed using standard methods as described pre-               Total cell count, × 106                          7.5 ± 1.78
viously [5], details on the generation and processing of         Neutrophils, %                                   64.8 ± 8.5
the expression data can be found in [3]. The ECLIPSE             Eosinophils, %                                   3.1 ± 2.04
study complies with the Declaration of Helsinki and              Lymphocytes, %                                   25.4 ± 7.9
Good Clinical Practice Guidelines and was approved by            Note that all subjects are COPD patients and former smokers. The values
the Ethics Committees and Institutional Review Boards            represent mean ± standard deviation, frequency or proportion, as appropriate.

of all participating centers. All participants provided writ-
ten informed consent.                                              Note that there were no controls with normal lung
                                                                 function among the subjects. Hence, we cannot compare
Selection of clinical measures                                   COPD to normal but only the differences between
Table 2 shows the clinical measures selected by COPD             COPD patients [1].
experts (SR, BC, AA, EKS) based on their association to
important clinical outcomes (e.g. exacerbations, hospitali-      Relationship between clinical characteristics and gene
zations and death). The degree of airflow limitation             expression
(GOLDCD) was determined using spirometry, distances              To investigate the relationships between differences in
walked over 6 minutes (DWALK) were measured using                gene expression and clinical trait occurrence, we used
standard methodology. Standardized questionnaires were           two complementary analyses:
used to obtain smoking status, cough and sputum                     (i) For each of the clinical characteristics introduced
(PHLEGM) production. COPD exacerbations in the year              above, we divided the patients into two groups based on
prior to the study were recorded, as well as body mass           clinically relevant cut-points (Table 2, column 5) and com-
index (BMI). All subjects underwent a low-dose computed          puted gene expression differences between the two groups.
tomography (CT) scan of the chest to determine both air-         Gene expression analysis was performed using Significance
way disease and emphysema (FV950 as a quantitative               Analysis of Microarrays (SAM) [13] with a false discovery
assessment, and EMPHETCD as a radiologists score) [11].          rate (FDR) of 5% as cutoff.
Several inflammatory biomarkers were measured in per-               (ii) We used VIStA (see below) to identify groups of
ipheral blood [12]. For details on the definitions and           patients with maximized differential gene expression
acquisition procedures of the above measures see [9].            and then compared their clinical characteristics.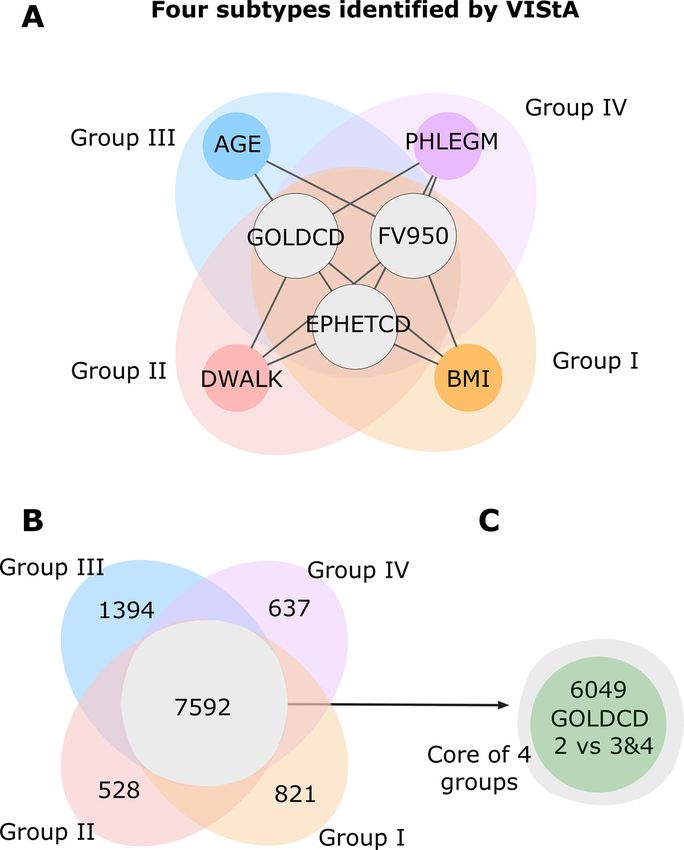
Table 2 Summary of the clinical characteristics of COPD patients identified as most relevant by clinical experts.

                                                                                                                                                                                                                    http://www.biomedcentral.com/1752-0509/8/S2/S8
                                                                                                                                                                                                                    Menche et al. BMC Systems Biology 2014, 8(Suppl 2):S8
    Category              Continuous Variable for Quantitative                          Discrete Variable                        Bins                  Characteristics            Differentially expressed genes
                                       Analysis                                                                                                                                           at FDR < 0.05
Chronic Bronchitis                     Not applicable                      Cough with Phlegm for at least 3 mos/yr         low extreme (Q1       neither chronic cough nor                         0
                                                                                     for at least 2 years                       = 64)                 chronic phlegm
                                                                                                                            high extreme          both chronic cough and
                                                                                                                              (Q4 = 46)               chronic phlegm
    History of               Number of exacerbations per year               2 or more per year and less than 2 per         low extreme (Q1                0 - Never                                0
  Exacerbations                                                                             year                                = 26)
                                                                                                                            high extreme                  3 - Always
                                                                                                                              (Q4 = 17)
Body Mass Index                              BMI                                      BMI < 21, 21-30, > 30                low extreme (Q1                BMI < 21                                 0
    (Kg/m2)                                                                                                                     = 18)
                                                                                                                            high extreme                  BMI > 30
                                                                                                                              (Q4 = 35)
Airflow Limitation                   FEV1 (% predicted)                                    GOLD Stage                      low extreme (Q1             < 2-GOLD stage                            6,049
      severity                                                                                                                  = 69)
                                                                                                                            high extreme               >4 GOLD stage
                                                                                                                              (Q4 = 13)
  6 Minute Walk                      Quantitative 6MWD                          < 350 meters and > 350 meters              low extreme (Q1              >350 meters                                0
     Distance                                                                                                                   = 38)
                                                                                                                            high extreme                >350 meters
                                                                                                                             (Q4 = 101)
    Radiologist                Emphysema severity category:                                                                low extreme (Q1         0-1.5 -No emphysema                             0
   Emphysema                                                                                                                    = 40)
    assessment                       Not affected (N): 0                                Yes/No/Uncertain                    high extreme                 4-5 - severe
                                                                                                                              (Q4 = 45)
                                         Trivial (T): 1
                                      Mild (M) 5-25%: 2
                                  Moderate (O) 25-50%: 3
                                    Severe (S) 50-75%: 4
                                  Very Severe (V) > 75%: 5
  Densitometric                   Emphysema at -950 HU                             Emphysema >10% (Yes/No)                 low extreme (Q1        Emphysema >10% = No                              0
   Emphysema                                                                                                                    = 37)
                                                                                                                            high extreme          Emphysema >10% = yes
                                                                                                                              (Q4 = 95)
CT Airway Disease        Pi10 (Square root of wall area of 10 mm           GOLD Stages 2-4 with Emphysema < 5%             low extreme (Q1              Trivial (< %5)                             0
                                internal perimeter airways)                         (Yes) or > 5% (No)                          = 63)
                                                                                                                            high extreme        Severe (50-75%, very severe

                                                                                                                                                                                                                                                  Page 3 of 13
                                                                                                                              (Q4 = 33)                   (>75%))
Columns 4-6 show the results of the differential gene expression analysis comparing the subjects of the defined bins or extremes for each characteristic. Q1/Q4 refer to the number of patients in the respective
group (1st and 4th “quartile”). The only single characteristic yielding significantly differentially expressed genes is the degree of airflow limitation as given by GOLD stage (GOLDCD).
Menche et al. BMC Systems Biology 2014, 8(Suppl 2):S8 Page 4 of 13 http://www.biomedcentral.com/1752-0509/8/S2/S8 diVIsive Shuffling Approach (VIStA) (iii) n subjects are randomly partitioned into three groups We developed a novel unbiased method called diVIsive of comparable size (Figure 1A). A SAM analysis is per- Shuffling Approach (VIStA) to identify groups of formed and the number of genes differentially expressed patients with maximal difference in gene expression. between groups 1 and 2 is counted. Group 3 serves as a The algorithm consists of the following steps: “reservoir” of individuals for the subsequent steps. Figure 1 Schematic representation of the diVIsive Shuffling Approach (VIStA). A Initially the subjects are divided randomly into three groups; gene expression differences are calculated between group 1 & 2, the third group serves as a reservoir for the subsequent shuffling steps. At each shuffling step, a subject from group 1 or 2 is randomly exchanged with a subject from the reservoir. If the number of differentially expressed genes increases thereby, the swap is accepted, otherwise rejected. B 20 exemplary time series of the number of differentially expressed genes between group 1 & 2 as a function of the number of attempted shuffles. The different curves correspond to different random initial divisions. After approximately 1000 shuffles the groups converge and present a large, stationary number of differentially expressed genes. C For each of the obtained divisions (500 in total), clinical characteristics in group 1 & 2 are compared.
Menche et al. BMC Systems Biology 2014, 8(Suppl 2):S8                                                                Page 5 of 13
http://www.biomedcentral.com/1752-0509/8/S2/S8

  (iv) An individual from group 1 or 2 is randomly                 expressed genes at each iteration step, for example
swapped with an individual from the reservoir group 3.             using the p-values of simple t-tests or a minimal fold-
We repeat the SAM analysis, counting again the new                 change. As VIStA consists of repeated differential
number of differentially expressed genes (Figure 1A). If           expression analyses, the same limitations as for conven-
this count increases, the swap is accepted, otherwise              tional approaches apply for the minimal number of sub-
rejected.                                                          jects and general data quality.
  (v) Step (ii) is iterated until the number of differentially        We implemented a reservoir of 40 subjects (group 3) in
expressed genes reaches a plateau (Figure 1B), typically           order to resemble a gene expression analysis based on
after approximately 1000 attempted swaps. The corre-               extremes, e.g. the 25% of subjects with the lowest BMI vs
sponding groups 1 & 2 represent a combination of                   the 25% of subjects with the highest BMI. In principle, the
patients with high differential gene expression.                   third group is not strictly necessary, as shuffling can be
  Starting with different random initial configurations, we        performed between two groups. Increasing the size of the
repeat the whole procedure (i) through (iii) 500 times,            reservoir group could affect power through selection of
resulting in 500 end configurations, each characterized by         more extreme subjects or by reducing the sample size for
a large number of differentially expressed genes. In order         the differential expression analysis, so it will depend on
to explore the extent to which these 500 subdivisions are          the concrete application, whether or not a reservoir is
clinically relevant and distinct, we analyze them individu-        useful.
ally for statistically significant differences in clinical char-      As detailed below, we find that 500 independent runs
acteristics between the members of group 1 and 2. For              of VIStA provided sufficient statistical power for a robust
each subdivision, we identify the set of clinical characteris-     distinction between four different subgroups in this
tics (Table 2) that differ significantly between patients in       study. Generally, a higher number of independent runs
group 1 and group 2 using a Mann-Whitney-U-test (sig-              could lead to the discovery of more subtle subgroups. It
nificance threshold of p-value ≤ 0.05) for all continuous          is important to note, however, that the predictive power
characteristics (e.g. BMI) and Fisher’s exact test for binary      of the approach is ultimately limited by the quality and
characteristics (e.g. gender) (Figure 1C). We find that with       size of the expression data, as well as the clinical
the exception of two subdivisions, all the remaining 498           characteristics.
subdivisions show a statistically significantly difference in         The algorithm was implemented in the programming
at least one clinical characteristic. This suggests that the       language C. A single run with 2,000 iterations takes
shuffling algorithm indeed does identify biologically or           around three hours on a standard PC. However, the vast
clinically distinct divisions of patients in most cases. The       majority of the computing time is used to perform the
frequency with which individual clinical characteristics           SAM analysis, so using a simpler technique for the differ-
appear as significantly different between the two groups           ential gene expression analysis would drastically speed up
can therefore be used to identify the combinations of clini-       the execution time if necessary.
cal characteristics that co-determine gene expression
differences.                                                       Results & discussion
  Note that the VIStA approach is fundamentally differ-            Differential gene expression of single clinical
ent from clustering techniques like hierarchical or                characteristics
k-means clustering. The latter attempt to identify cohe-           We first attempted to identify statistically significant gene
sive groups based on similarity, while VIStA, on the               expression differences between patient groups that differ
contrary, is a divisive algorithm based on maximizing              in a single clinical characteristic. To be specific, we
the differences between groups. Another important dif-             aimed to identify genes that were differentially expressed
ference to standard clustering approaches is that by               at FDR
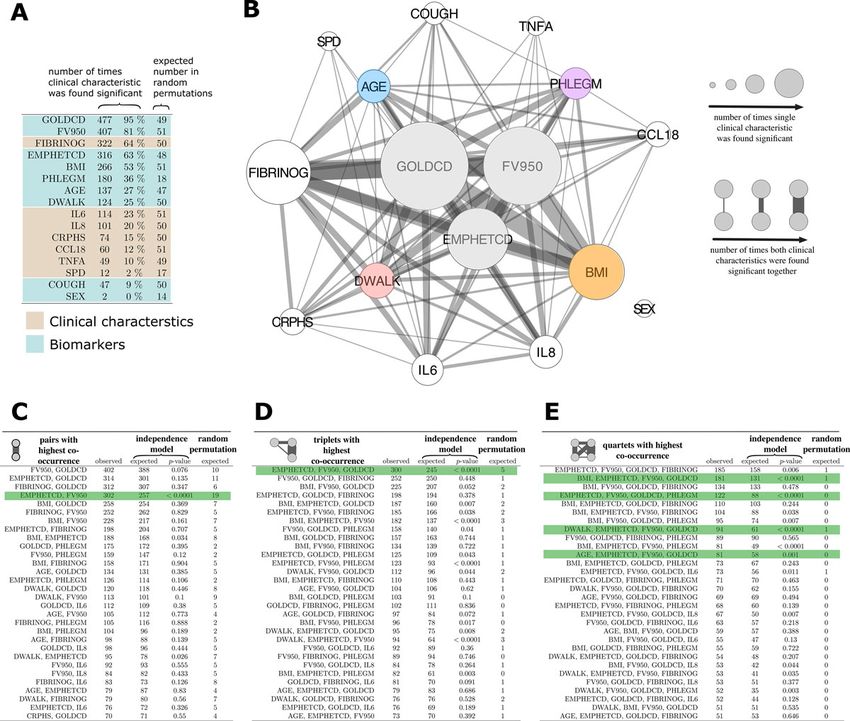
Menche et al. BMC Systems Biology 2014, 8(Suppl 2):S8                                                                                  Page 6 of 13
http://www.biomedcentral.com/1752-0509/8/S2/S8

study based on their gene expression patterns, and then                     ligand 18 (CCL18), surfactant protein D (SPD), fibrino-
explored the clinical characteristics of the obtained                       gen (FIBRINOG), and tumor necrosis factor alpha
groups (Figure 1).                                                          (TNFA) associated with patient subtypes that display the
  Figure 2 presents the results of the VIStA analysis,                      most extreme sputum gene expression pattern differ-
offering a comparison of the clinical characteristics                       ences. We found that the severity of airflow limitation
(GOLDCD, FV950, EMPHETCD, BMI, PHLEGM, AGE,                                 (GOLDCD) was the single most important determinant
DWALK, COUGH and Sex) and inflammatory biomar-                              of differential gene expression, being statistically signifi-
ker levels (interleukin (IL)-6, IL-8, high-sensitivity                      cant in 95% of all VIStA outputs (n = 477, Figure 2A).
C-reactive protein (HSCRP), chemokine motif (C-C)                           This is consistent with our finding discussed above that

 Figure 2 Combination of clinical characteristics associated with groups from VIStA. A Number of times the characteristics were found
 significantly different between group 1 & 2 in a total of 500 divisions. Severity of airflow limitation (GOLDCD) is the single most important
 determinant of differential gene expression, being statistically significant in 95% of all VIStA outputs. B Summary of the individual and pairwise
 number of significant occurrences of the clinical characteristics. Node size is proportional to the number of times a measure was found
 significant, the width of a link indicates how often two measures appeared significant in the same VIStA division. The core group contains
 severity of airflow limitation (GOLDCD) and the two emphysema measures EMPHETCD and FV950. C, Number of times that pairwise
 combinations of clinical characteristics co-occurred in the 500 VIStA outcomes. The most significant pair (as compared to a Null model of
 independent occurrence) is EMPHETCD and FV950, which are both measures of emphysema. D The most frequent and significant triplet is a
 combination of GOLDCD and EMPHETCD and FV950, measuring disease severity. E We find significant combinations of the disease severity
 triplet in B with four clinical characteristics: BMI, PHLEGM, DWALK and AGE.
Menche et al. BMC Systems Biology 2014, 8(Suppl 2):S8                                                              Page 7 of 13
http://www.biomedcentral.com/1752-0509/8/S2/S8

GOLDCD was the only single clinical variable associated          the most frequent combinations of four variables. We find
with differential gene expression. The second most com-          that the most significant combinations are those which
mon clinical determinant of differential sputum gene             include the triple GOLDCD, FV950 and EMPHETCD,
expression was emphysema, quantified by either density           together with one additional variable, the most significant
mask analysis (FV950) or assessed qualitatively by the           being FIBRINOGEN, BMI, PHLEGM, DWALK and age.
radiologist (EMPHETCD) (81% and 63% of all VIStA                 In the following, however, we have not considered fibrino-
outcomes, respectively, Figure 2A) whereas BMI, Phlegm,          gen as the basis for a subtype since it is a biomarker rather
age and DWALK were observed in 53%, 36%, 27% and                 than a clinical characteristic.
25% of the VIStA outcomes, respectively (Figure 2A).                In summary, Figure 2C-E suggests four distinct clinical
Plasma fibrinogen was the most frequently identified sys-        parameters that define groups of patients with considerable
temic biomarker (64% of all VIStA outcomes),                     gene expression differences. In all groups the patients are
                                                                 characterized by different disease severity (GOLDCD) and
Combination of clinical traits from VIStA                        emphysema (i.e. EMPHETCD and FV950) but in addition,
Figure 2B illustrates how often combinations (pairs) of sig-     each group also has one clear distinctive parameter: high/
nificant single clinical characteristics (or inflammatory bio-   low BMI (Group I), exercise capacity (DWALK) (Group
markers) co-occur in the different VIStA subtypes by the         II), Age (Group III) or presence/absence of phlegm pro-
width of the links between them. The statistical signifi-        duction (Group IV) (Table 3). For example, group IA has
cance of each co-occurrence (Figure 2C-E) was calculated         high GOLDCD, emphysema, FV950 and low BMI, while
using a binomial model that assumes independence of the          group IB has low GOLDCD, emphysema, FV950 and high
individual characteristics or biomarker levels as the Null       BMI.
hypothesis. In order to quantify the extent to which the            To further characterize these subtypes suggested by
VIStA outcomes could reflect spurious associations, we           VIStA we subdivided the full set of all 140 ECLIPSE
also generated 10,000 random divisions of the patients and       patients according to the identified clinical characteristics,
analyzed how often the individual characteristics and their      resulting in 8 groups of 15 to 28 patients. First, we
combinations appear as significant (Figure 2C-E). We find        explored a number of clinical, biomarker and cell count
that the divisions obtained by VIStA show a much higher          measures of the subjects in each group. We find, for
number of significant clinical characteristics than expected     example, that serum levels of the biomarkers IL6, IL8 and
by chance, with the exceptions of the biomarkers CCL18,          SPD are significantly higher in group IIIB than in IIIA, a
TNFA and SPD and the variables COUGH and SEX. Simi-              difference that was not observed in other groups. Similarly,
larly, also combinations of significant characteristics          the proportion of neutrophils and lymphocytes in sputum
appear more frequent than for randomly assigned division.        were significantly higher in group IIIB in comparison to
We observed (Figure 2C) that the pairwise co-occurrences         IIIA (Table 3).
of clinical characteristics and inflammatory biomarkers             We then performed a separate differential gene expres-
were dominated by airflow limitation severity (GOLDCD).          sion analysis (now with a more stringent FDR
http://www.biomedcentral.com/1752-0509/8/S2/S8
Menche et al. BMC Systems Biology 2014, 8(Suppl 2):S8
Table 3 Summary of the clinical measures, biomarkers, and cell counts among the four groups of COPD patients identified from the results of Figure 2: each
group combines GOLDCD, EMPHETCD and FV950, with either BMI (Group I), DWALK (Group II), AGE (Group III) or Phlegm (Group IV).
Group-IA Group-IB, (n = 23) p-values Group-IIA Group-IIB , p-values Group -IIIA (n = 15) Group-IIIB p-values Group-IVA Group-IVB p-values
(n = 25) (n = 21) (n = 32) (n = 28) (n = 20) (n = 26)
Age 65.4 65.4 - 63.9 65.4 - 58.73 68.7 *** 63 65.96 -
Lung Function - - - -
FEV1 1.72 0.89 *** 1.7 0.9 *** 1.72 0.93 ** 1.79 0.9 ***
FEV1/FVC (%) 57.88 32.43 *** 55.0 32.5 *** 56.53 33.93 *** 57.1 33.04 ***
FEV1 reversibility (%) 7.64 4.73 *** 11.5 7.2 *** 11.62 5.93 *** 10.4 5.5 ***
Radiologist Emphysema - - - -
Emphysema severity 1.2 4.2 *** 1.3 4.2 *** 1.336 3.7 *** 1.275 4.2 ***
Densitometric Emphysema - - - -
Emphysema at -950 HU 6.98 33.42 *** 6.6 31.7 *** 7.71 28.09 *** 7.06 33.42 ***
Airflow Obstruction - - - -
GOLD Stage 2 3.3 *** 2.0 3.3 *** 2 3.2 *** 2 3.3 ***
Body Mass Index 30.76 21.21 *** 27.3 24.2 * 29.87 25.8 - 28.67 24.42 *
Chronic Bronchitis (ATS_CB) 1 = 24% 1 = 30.4% - 1 = 85.7% 1 = 62.5% - 1 = 6.7% 1 = 37% - 1-100% 1 = 46.2% ***
1 = no-CB
Phelgm
1 = no chronic phlegm 1 = 56% 1 = 35% - 1 = 62% 1 = 41% - 1 = 66.6% 1 = 33% - 1-100% 1 = 0% ***
6 Minute Walk Distance 428.32 330.02 ** 508.8 273.9 *** 438.97 321.83 ** 462.59 322.9 **
Exacerbations 0 = no-Exacerbations 0 = 68% 0 = 34.8% - 0 = 71.4% 0 = 28.1% ** 0 = 60% 0 = 37% - 0 = 70% 0 = 38.5% *
CCL6 7.3 6.33 - 7.0 6.8 - 6.19 6.73 - 8.64 6.9 -
IL6 5.65 20.2 - 4.3 18.6 - 2.79 6.89 ** 3.72 18.53 -
IL8 8.88 10.77 - 8.3 9.4 - 7.5 10.28 * 9.8 10.65 -
TNFa 26.99 160.32 - 31.7 162.9 - 2.35 60.44 - 24.14 142.3 -
CCL18 130.3 117.59 - 126.9 124.4 - 115.8 117.94 - 134 126.19 -
CRPHS 10.4 9.6 - 9.9 9.5 - 5.7 9.72 - 510 8.5 -
FIBRINOG 494.9 499.1 - 481.0 506.2 - 456.8 498.58 - 510.8 489.84 -
SPD 129.64 110.94 - 124.9 119.1 - 79.73 116.3 * 138.76 109.7 -
mMRC 3 2.09 ** 1.0 2.4 *** 1.21 2.04 * 1.1 2.04 *
SGRQ 43.29 55.55 ** 35.9 56.0 *** 41.8 52.87 * 36 57.73 ***
FFMI 19.53 16.13 *** 18.5 17.1 * 18.48 17.8 - 18.83 17.15 *
% Fat (Tissue) 34.92 29.08 ** 31.0 31.7 - 35.96 31.94 - 32.69 31.25 -
- - - -
Neutrophils, % Neut_Blq 61.38 64.87 - 60.7 67.0 ** 61.34 66.69 * 62.08 65.55 -
Eosinophils, % Eos blq 3 3.1 - 3.5 3.1 - 2.48 2.92 - 3.26 3.3 -
Page 8 of 13
Lymphocytes, % lymhblq 28.63 24.84 - 28.6 23.2 * 29.19 23.55 * 27.77 23.688 -
* = p-value < 0.05; ** = p-value < 0.01; *** = p-value < 0.0001; - = not significantMenche et al. BMC Systems Biology 2014, 8(Suppl 2):S8 Page 9 of 13 http://www.biomedcentral.com/1752-0509/8/S2/S8 Figure 3 Four subtypes and differentially expressed genes. A The combinations of phenotypic measures that define the subtypes predicted by the VIStA method: all four subtypes share a common core of high values of GOLDCD, FV950 and EMPHETCD, reflecting disease severity. Each of the individual subtypes I-IV presents one additional clinical characteristic: BMI (subtype I), DWALK (II), AGE (III) or PHLEGM (IV). B Venn diagram showing the number of differentially expressed genes unique to each subtype, as well as common to all four subtypes. The common genes show a large overlap with the genes differentially expressed between subjects with GOLDCD 2 and subjects with GOLDCD 3&4, indicating that these genes reflect mostly disease severity. different pathway databases, we use KEGG, Biocarta and lipid transport and beta-cell and insulin signaling path- Reactome. The enrichment analysis between a given gene ways like beta cell (p = 0.005), HDL mediated lipid trans- set and a pathway was done using Fisher’s exact test. As port (p = 0.006) and GTP hydrolysis pathways (p = shown in Table 4, the top pathways show little overlap 0.007). In group III, pathways related to cell cycle control between the four groups, providing further evidence for like mitotic prometaphase (p = 0.0048), and downstream VIStA’s ability to capture molecular elements that are signaling pathways (p = 0.003) with innate-immunity and specific to each subtype. Several identified pathways were GAB1 signaling were enriched. In group IV, distinct gap related to metabolism, diabetes and inflammation. Group channel and inflammation pathways were identified like 1 was most enriched with inflammatory pathways includ- peptide ligand binding (p = 0.0006), gap-junction assem- ing for example the FC-Gamma-R mediated phagocytosis bly (p = 0.0008) and chemokine signaling pathways (p = (p = 0.007) and CDC6-association with ORC:origin-com- 0.0013). plex pathways (p = 0.15). Further pathways include small Finally, we identified genes with at least a 2-fold lung cancer (p = 0.004) and maturity onset diabetes of change (FC) in expression [16,17] at an FDR of
Menche et al. BMC Systems Biology 2014, 8(Suppl 2):S8                                                 Page 10 of 13
http://www.biomedcentral.com/1752-0509/8/S2/S8

Table 4 The 10 most strongly enriched pathways in the set of genes common among all four groups described in
table 3, as well as in the individual gene sets of each group.
Top ten pathways among Common Genes
pathway                                                                    p-value    overlap   all pathway genes
REACTOME_GENE_EXPRESSION                                                   1.22E-35    235            425
REACTO ME_DIABETES_PATHWAYS                                               1.91E-33     214            383
REACTOME_METABOLISM_OF_PROTEINS                                           9.48E-28     134            215
REACTOME_CELL_CYCLE_MITOTIC                                               7.34E-25     167            306
REACTOME_GLUCOSE_REGULATION_OF_                                           1.24E-23     104            161
INSULIN_SECRETION
KEGG_HUNTINGTONS_DISEASE                                                  3.16E-23     114            185
REACTOME_INTEGRATION_OF_ENERGY_METABOLISM                                 1.09E-21     130            229
REACTOME_ELECTRON_TRANSPORT_CHAIN                                         1.11E-21      60             75
REACTOME_RNA_POLYMERASE_I_III_AND_MITOCHONDRIAL_TRANSCR.PT.ON             2.72E-21      82            120
REACTOME_INFLUENZA_LIFE_CYCLE                                             1.11E-20      89            137
Top ten pathways among Group 1 Genes
pathway                                                                    p-value    overlap   all pathway genes
REACTOME_INORGANIC_CATION_ANION_SLC_TRANSPORTERS                        0.00133586      7              94
KEGG_SMALL_CELL_LUNG_CANCER                                             0.00359651      6              84
KEGG_FC_GAMMA_R_MEDIATED_PHAGOCYTOSIS                                   0.00723812      6              97
KEGG_MATURITY_ONSET_DIABETES_OF_THE_YOUNG                               0.00921957      3              25
REACTOME_AM.NO_ACID_AND_OLIGOPEPTIDE_SLC_TRANSPORTERS                   0.00984371      4              48
REACTOME_SLC_MEDIATED_TRANSMEMBRANE_TRANSPORT                           0.01009928      8             169
KEGG_B_CELL_RECEPTOR_SIGNALING_PATHWAY                                  0.01020969      5              75
KEGG_GLYCOSPHINGOLIPID_BIOSYNTHESIS_LACTO_AND_NEOLACTO_SERIES            0.0102887      3              26
REACTOME_NUCLEAR_RECEPTOR_TRANSCRIPTION_PATHWAY                         0.01133769      4              50
REACTOME_CDC6_ASSOCIATION_WITH_THE_ORC:ORIGIN_COMPLEX                   0.01516009      2              11
Top ten pathways among Group II Genes
pathway                                                                    p-value    overlap   all pathway genes
REACTOME_REG ULATION_OF_GENE_EXPRESSIO N_IN_B ETA_CELLS                    0.00552      5             101
REACTOME_HDL_MEDIATED_LIPID_TRANSPORT                                      0.00637      2              11
REACTOME_GTP_HYDROLYSIS_AND_JOINING_OF_THE_60S_RIBOSOMAL_SUBUNIT           0.00675      5             106
REACTOME_FACILITATIVE_NA_INDEPENDENT_GLUCOSE_TRANSPORTERS                  0.00759      2              12
REACTOME_REGULATION_OF_BETA_CELLDEVELOPMENT                                0.00911      5             114
REACTOME_TRANSLATION                                                       0.01121      5             120
REACTOME_TRANSMEMBRANE_TRANSPORT_OF_SMALL_MOLECULES                        0.01148      7             218
REACTOME_IRS_RELATED_EVENTS                                                0.01182      4              79
REACTOME_INFLUENZA_LIFE_CYCLE                                              0.01889      5             137
REACTOME_DEADENYLATION_OF_MRNA                                             0.02469      2              22
Top ten pathways among Group III Genes
pathway                                                                    p-value    overlap   all pathway genes
REACTOME_DOWN_STREAM_SIGNAL_TRANSDUCTION                                0.00302075      5              35
REACTOME_GAB1_SIGNALOSOME                                               0.00324484      3              11
REACTOME_SIGNALING_IN_IMMUNE_SYSTEM                                     0.00470548      20            366
REACTOME_MITOTIC_PROMETAPHASE                                           0.00489389      8              92
REACTOME_INNATE_IMMUNITY_SIGNALING                                      0.00584887      10            136
REACTOME_SIGNALLING_TO_RAS                                               0.0060289      4              26
REACTOME_FORMATION_OF_PLATELET_                                         0.00753191      12            186
PLUG
REACTOME_GRB2_SOS_PROVIDES_LINKAGE_TO_MAPK_SIGNALING_FOR_INTERGRINS     0.00821656      3              15
REACTOME_MYOGENESSIS                                                    0.00895252      4              29
REACTOME_HEMOSTASIS                                                     0.01301061      15            274
Menche et al. BMC Systems Biology 2014, 8(Suppl 2):S8                                                                             Page 11 of 13
http://www.biomedcentral.com/1752-0509/8/S2/S8

Table 4 The 10 most strongly enriched pathways in the set of genes common among all four groups described in
table 3, as well as in the individual gene sets of each group. (Continued)
Top ten pathways among Group IV Genes
pathway                                                                                    p-value         overlap        all pathway genes
REACTOME_PEPTIDE_LIGAND_BINDING_RECEPTORS                                                      0.00059       12                    173
REACTOME_GAP_JUNCTION_ASSEMBLY                                                                 0.00076       4                     19
KEGG_CHEMOKINE_SIGNALING_PATHWAY                                                               0.00133       12                    190
REACTOME_GAP_JUNCTION_TRAFICKING                                                               0.00340       4                     28
REACTOME_CHEMOKINE_RECEPTORS_BIND_CHEMOKINES                                                   0.00787       5                     55
REACTOME_ACTIVATION_OF_ATR_IN_RESPONSE_TO_REPLICATION_STRESS                                   0.00936       4                     37
REACTOME_SIGNALING_IN_IMMUNE_SYSTEM                                                            0.00943       16                    366
KEGG_T_CELL_RECEPTOR_SIGNALING_PATHWAY                                                         0.01126       7                     108
REACTOME_CELL_CYCLE_CHECKPOINTS                                                                0.01237       7                     110
KEGG_NATURAL_KILLER_CELL_MEDIATED_CYTOTOXICITY                                                 0.01263       8                     137

downregulated genes in each subgroup. For example,                   patients with significant gene expression differences. In
MMP7 was found to be upregulated in group I (BMI),                   this study, we therefore introduced a novel methodology
consistant with findings in [18], where nutritionally                that allowed us to identify combinations of clinical char-
induced obese mice showed alterations in MMPs and                    acteristics that correspond to clear gene expression
TIMPs expression, thus providing further evidence for                differences.
the role of these proteolytic system genes in COPD sub-                Our results suggest that while gene expression differences
type with low BMI.                                                   are mainly driven by the severity of airflow limitation and
                                                                     the extent of emphysema, a smaller, yet discriminative con-
Conclusion                                                           tribution is also observed for a set of additional clinical
We have found that with the exception of severity of air-            characteristics: BMI, distance walked, age and chronic
flow limitation, categorizing COPD subtypes according                phlegm production, each defining a subtype of patients.
to a single clinical characteristic does not yield groups of         Validation of these groups and the underlying pathways

Table 5 Top ten upregulated and downregulated unique genes and their fold-change (FC) in each group (In group II,
only five unique genes are downregulated).
                Group 1                            Group II                        Group III                                 Group IV
        Gene               FC              Gene               FC            Gene                     FC                Gene              FC
   LOC100127940            2.8          RP-3377H14.5          2.4          DDX3Y                    4.6                IL1F9             2.5
       PDCD6               2.4            ZFYVE16             2.2          EIF1AY                   3.2                IL23A             2.5
        AHRR               2.4             TGFBR1             2.2           HELB                     3                 TUB               2.4
        CD1B               2.4            MARCH6              2.2       LOC100130224                2.9                GJB2              2.3
          KIT              2.4            CAPZA1              2.2           UTY                     2.9                CD22              2.3
       CADM1               2.3            KIAA0319            2.2         ADORA3                    2.9                FAF1              2.3
       MMP7                2.3             DHX36              2.2          ARNT2                    2.9               MB0AT7             2.3
      C20orf197            2.3            DLGAP4              2.1          CXCL14                   2.6              SULT2A1             2.3
      RNF144A              2.2              RIF1              2.1          TMEM61                   2.6              TMEM88              2.3
       MYO1B               2.2             NT5C2              2.1         PPARGC1B                  2.6               CHST7              2.3
       SGK493              -2.0            TIFAB              -2.0        C1orf201                  -2.5              VASH1              -2.3
      ALS2CR4              -2.1           CCDC42              -2.2        ST3GAL3                   -2.5             LINC00607           -2.3
       ENPP5               -2.2            HBE1               -2.2         APOOL                    -2.6             KLHDC7B             -2.3
      FLJ14082             -2.2            NAPSB              -2.2         IL28RA                   -2.6              DHODH              -2.3
     LOC1441204            -2.2            C4orf7             -3.8         ZNF624                   -2.6             CDDC113             -2.3
    L0C100134569           -2.2                                            SMAD5                    -2.6              IGF2BP3            -2.3
      FAM101A              -2.7                                             NRP1                    -2.6              C3orf27            -2.3
      LOC92270             -2.8                                          LOC654342                  -2.6              ZNF618             -2.3
          HPR              -2.9                                             TSIX                    -3.3              AKR1C4             -2.4
          HP               -2.9                                             XIST                    -4.1          LOC401321              -2.4
Menche et al. BMC Systems Biology 2014, 8(Suppl 2):S8 Page 12 of 13
http://www.biomedcentral.com/1752-0509/8/S2/S8
will require replication in a second cohort of COPD sub- Calverley (UK), Bartolome Celli (USA), Courtney Crim (GlaxoSmithKline, USA),
Gerry Hagan (GlaxoSmithKline, UK), William MacNee (Chair, UK), Bruce Miller
jects. Note that additional differences may also exist for (GlaxoSmithKline, USA), Stephen Rennard (USA), Ruth Tal-Singer
clinical characteristics that have not been considered in the (GlaxoSmithKline, USA), Emiel Wouters (The Netherlands), Julie Yates
present study. (GlaxoSmithKline, USA).
The observed subgroups with combinations of different Declarations
clinical characteristics are consistent with the clinical het- The publication costs for this article were funded by Northeastern University,
erogeneity of COPD, where a given patient may manifest MA, USA.
This article has been published as part of BMC Systems Biology Volume 8
more than one measurable feature of COPD, suggesting Supplement 2, 2014: Selected articles from the High-Throughput Omics and
either that the underlying mechanisms contribute to more Data Integration Workshop. The full contents of the supplement are
than one feature or that multiple mechanisms are mala- available online at http://www.biomedcentral.com/bmcsystbiol/supplements/
8/S2.
dapted in an individual.
While we focused on COPD in this study, the proposed Authors’ details
1
VIStA method can be more generally applied to any other Center for Complex Networks Research and Department of Physics,
Northeastern University, Boston, MA, 02115, USA. 2Center for Cancer Systems
complex, heterogeneous disease and presents a promising Biology, Dana-Farber Cancer Institute, Boston, MA, 02215, USA. 3Department
approach to the important problem of disease heterogene- of Theoretical Physics, Budapest University of Technology and Economics,
ity and subtyping/subgrouping. A better understanding of Budapest, 1111, Hungary. 4Channing Division of Network Medicine and
Division of Pulmonary and Critical Care Medicine, Department of Medicine,
this problem is invaluable, for example, for improving the Brigham and Women’s Hospital, Harvard Medical School, Boston, MA, 02115,
selection of patients for evaluating novel agents. To the USA. 5GlaxoSmithKline, King of Prussia, PA, 19406, USA. 6University of
extent that gene expression reflects genetic and epigenetic Nebraska Medical Center, Omaha, NE, 68198, USA. 7Pulmonary and Critical
Care Division, Brigham and Women’s Hospital, Harvard Medical School,
variation, the subtypes identified by our method may Boston, MA, 02115, USA. 8GlaxoSmithKline, Research Triangle Park, NC, 27709,
further suggest different approaches to identifying genetic USA. 9GlaxoSmithKline, Stevenage, Hertfordshire, SG1 2NY, UK. 10Hospital
susceptibility. Clinic, IDIBAPS, Thorax Institute, University of Barcelona, 08036, Barcelona.
11
Center for Network Science, Central European University, Budapest, 1051,
Hungary. 12Department of Medicine, Brigham and Women’s Hospital,
Harvard Medical School, Boston, MA, 02115, USA. 13FISIB, CIBERES, Mallorca,
Competing interests
07110, Spain.
RJM, RTS, BEM, NL. JR, CL, GB are employees of GlaxoSmithKline and own
shares and share options in the company.
Published: 13 March 2014
Authors’ contributions
JM, AS, ALB carried out the analysis and wrote the manuscript; AA, BC, SR, References
ES, RTS, BM, JR, NL provided expertise on the ECLIPSE data and COPD and 1. Vestbo J, Hurd SS, Agusti AG, Jones PW, Vogelmeier C, Anzueto A,
wrote the manuscript; MHC, RM, SG, CL, GB advised on the analysis and Barnes PJ, Fabbri LM, Martinez FJ, Nishimura M, Stockley RA, Sin DD,
wrote the manuscript. Rodriguez-Roisin R: Global strategy for the diagnosis, management, and
prevention of chronic obstructive pulmonary disease: Gold executive
Acknowledgements summary. American journal of respiratory and critical care medicine 2013,
This work was partially supported by MapGen grant (1U01HL108630-01), by 187(4):347-65.
the EC-FP7 Program, Synergy-COPD, GA n° 270086, as well as by by COST- 2. Bhattacharya S, Srisuma S, Demeo DL, Shapiro SD, Bueno R, Silverman EK,
BMBS, Action BM1006 “Next Generation Sequencing Data Analysis Network”, Reilly JJ, Mariani TJ: Molecular biomarkers for quantitative and discrete
SeqAhead. copd phenotypes. American journal of respiratory cell and molecular biology
Principal investigators and centers participating in ECLIPSE (NCT00292552): 2009, 40(3):359-67.
Bulgaria: Yavor Ivanov, Pleven; Kosta Kostov, Sofia. Canada: Jean Bourbeau, 3. Singh D, Fox SM, Tal-Singer R, Plumb J, Bates S, Broad P, Riley JH, Celli B:
Montreal, Que; Mark Fitzgerald, Vancouver, BC; Paul Hernandez, Halifax, NS; Induced sputum genes associated with spirometric and radiological
Kieran Killian, Hamilton, On; Robert Levy, Vancouver, BC; Francois Maltais, disease severity in copd ex-smokers. Thorax 2011, 66(6):489-95.
Montreal, Que; Denis O’Donnell, Kingston, On. Czech Republic: Jan Krepelka, 4. Pierrou S, Broberg P, O’Donnell RA, Pawlowski K, Virtala R, Lindqvist E,
Praha. Denmark: JØrgen Vestbo, Hvidovre. Netherlands: Emiel Wouters, Horn. Richter A, Wilson SJ, Angco G, Moller S, Bergstrand H, Koopmann W,
New Zealand: Dean Quinn, Wellington. Norway: Per Bakke, Bergen. Slovenia: Wieslander E, Stromstedt PE, Holgate ST, Davies DE, Lund J, Djukanovic R:
Mitja Kosnik, Golnik. Spain: Alvar Agusti, Jaume Sauleda, Palma de Mallorca. Expression of genes involved in oxidative stress responses in airway
Ukraine: Yuri Feschenko, Kiev; Vladamir Gavrisyuk, Kiev; Lyudmila Yashina, epithelial cells of smokers with chronic obstructive pulmonary disease.
Kiev; Nadezhda Monogarova, Donetsk. United Kingdom: Peter Calverley, American journal of respiratory and critical care medicine 2007, 175(6):577-86.
Liverpool; David Lomas, Cambridge; William MacNee, Edinburgh; David 5. DeMeo D, Mariani T, Lange C, Lake S, Litonjua A, Celedon J, Reilly J,
Singh, Manchester; Jadwiga Wedzicha, London. United States of America: Chapman HA, Sparrow D, Spira A, Beane J, Pinto-Plata V, Speizer FE,
Antonio Anzueto, San Antonio, TX; Sidney Braman, Providence, RI; Richard Shapiro S, Weiss ST, Silverman EK: The serpine2 gene is associated with
Casaburi, Torrance CA; Bart Celli, Boston, MA; Glenn Giessel, Richmond, VA; chronic obstructive pulmonary disease. Proceedings of the American
Mark Gotfried, Phoenix, AZ; Gary Greenwald, Rancho Mirage, CA; Nicola Thoracic Society 2006, 3(6):502.
Hanania, Houston, TX; Don Mahler, Lebanon, NH; Barry Make, Denver, CO; 6. Spira A, Beane J, Pinto-Plata V, Kadar A, Liu G, Shah V, Celli B, Brody JS:
Stephen Rennard, Omaha, NE; Carolyn Rochester, New Haven, CT; Paul Gene expression profiling of human lung tissue from smokers with
Scanlon, Rochester, MN; Dan Schuller, Omaha, NE; Frank Sciurba, Pittsburgh, severe emphysema. American journal of respiratory cell and molecular
PA; Amir Sharafkhaneh, Houston, TX; Thomas Siler, St. Charles, MO, Edwin biology 2004, 31(6):601-10.
Silverman, Boston, MA; Adam Wanner, Miami, FL; Robert Wise, Baltimore, 7. Agusti A, Calverley PM, Celli B, Coxson HO, Edwards LD, Lomas DA,
MD; Richard ZuWallack, Hartford, CT. Steering Committee: Harvey Coxson MacNee W, Miller BE, Rennard S, Silverman EK, Tal-Singer R, Wouters E,
(Canada), Lisa Edwards (GlaxoSmithKline, USA), David Lomas (UK), William Yates JC, Vestbo J: Characterisation of copd heterogeneity in the eclipse
MacNee (UK), Edwin Silverman (USA), Ruth Tal-Singer (Co-chair, cohort. Respiratory research 2010, 11:122.
GlaxoSmithKline, USA), Jørgen Vestbo (Co-chair, Denmark), Julie Yates 8. Agusti A, Sobradillo P, Celli B: Addressing the complexity of chronic
(GlaxoSmithKline, USA). Scientific Committee: Alvar Agusti (Spain), Peter obstructive pulmonary disease: from phenotypes and biomarkers toMenche et al. BMC Systems Biology 2014, 8(Suppl 2):S8 Page 13 of 13
http://www.biomedcentral.com/1752-0509/8/S2/S8
scale-free networks, systems biology, and p4 medicine. American journal
of respiratory and critical care medicine 2011, 183(9):1129-37.
9. Vestbo J, Anderson W, Coxson HO, Crim C, Dawber F, Edwards L, Hagan G,
Knobil K, Lomas DA, MacNee W, Silverman EK, Tal-Singer R: Evaluation of
copd longitudinally to identify predictive surrogate end-points (eclipse).
The European respiratory journal: official journal of the European Society for
Clinical Respiratory Physiology 2008, 31(4):869-73.
10. Barabasi AL, Gulbahce N, Loscalzo J: Network medicine: a network-based
approach to human disease. Nature reviews Genetics 2011, 12(1):56-68.
11. Coxson HO, Dirksen A, Edwards LD, Yates JC, Agusti A, Bakke P,
Calverley PM, Celli B, Crim C, Duvoix A, Fauerbach PN, Lomas DA,
MacNee W, Mayer RJ, Miller BE, Müller NL, Rennard SI, Silverman EK, Tal-
Singer R, Wouters EF, Vestbo J: The presence and progression of
emphysema in copd as determined by ct scanning and biomarker
expression: a prospective analysis from the eclipse study. The Lancet
Respiratory Medicine 2013, 1(2):129-136.
12. Agusti A, Edwards LD, Rennard SI, MacNee W, Tal-Singer R, Miller BE,
Vestbo J, Lomas DA, Calverley PM, Wouters E, Crim C, Yates JC,
Silverman EK, Coxson HO, Bakke P, Mayer RJ, Celli B: Persistent systemic
inflammation is associated with poor clinical outcomes in COPD: a novel
phenotype. PLoS One 2012, 7(5):37483.
13. Larsson O, Wahlestedt C, Timmons JA: Considerations when using the
significance analysis of microarrays (sam) algorithm. BMC bioinformatics
2005, 6:129.
14. Subramanian A, Tamayo P, Mootha VK, Mukherjee S, Ebert BL, Gillette MA,
Paulovich A, Pomeroy SL, Golub TR, Lander ES, et al: Gene set enrichment
analysis: a knowledge-based approach for interpreting genome-wide
expression profiles. PNAS 2005, 102(43):15545-15550.
15. Luo J, Chen YJ, Narsavage GL, Ducatman A: Predictors of survival in
patients with non-small cell lung cancer. Oncology nursing forum 2012,
39(6):609-16.
16. DeRisi J, Penland L, Brown PO, Bittner ML, Meltzer PS, Ray M, Chen Y,
Su YA, Trent JM: Use of a cdna microarray to analyse gene expression
patterns in human cancer. Nature genetics 1996, 14(4):457-60.
17. Wellmann A, Thieblemont C, Pittaluga S, Sakai A, Jaffe ES, Siebert P,
Raffeld M: Detection of differentially expressed genes in lymphomas
using cdna arrays: identification of clusterin as a new diagnostic marker
for anaplastic large-cell lymphomas. Blood 2000, 96(2):398-404.
18. Maquoi E, Munaut C, Colige A, Collen D, Lijnen HR: Modulation of adipose
tissue expression of murine matrix metalloproteinases and their tissue
inhibitors with obesity. Diabetes 2002, 51(4):1093-101.
doi:10.1186/1752-0509-8-S2-S8
Cite this article as: Menche et al.: A diVIsive Shuffling Approach (VIStA)
for gene expression analysis to identify subtypes in Chronic Obstructive
Pulmonary Disease. BMC Systems Biology 2014 8(Suppl 2):S8.
Submit your next manuscript to BioMed Central
and take full advantage of:
• Convenient online submission
• Thorough peer review
• No space constraints or color figure charges
• Immediate publication on acceptance
• Inclusion in PubMed, CAS, Scopus and Google Scholar
• Research which is freely available for redistribution
Submit your manuscript at
www.biomedcentral.com/submitYou can also read