Multi tissue transcriptome analysis of two Begonia species reveals dynamic patterns of evolution in the chalcone synthase gene family
←
→
Page content transcription
If your browser does not render page correctly, please read the page content below
www.nature.com/scientificreports
OPEN Multi‑tissue transcriptome analysis
of two Begonia species reveals
dynamic patterns of evolution
in the chalcone synthase gene
family
Katie Emelianova1,2*, Andrea Martínez Martínez1,3, Lucia Campos‑Dominguez1,3 &
Catherine Kidner1,3
Begonia is an important horticultural plant group, as well as one of the most speciose Angiosperm
genera, with over 2000 described species. Genus wide studies of genome size have shown that
Begonia has a highly variable genome size, and analysis of paralog pairs has previously suggested that
Begonia underwent a whole genome duplication. We address the contribution of gene duplication
to the generation of diversity in Begonia using a multi-tissue RNA-seq approach. We chose to focus
on chalcone synthase (CHS), a gene family having been shown to be involved in biotic and abiotic
stress responses in other plant species, in particular its importance in maximising the use of variable
light levels in tropical plants. We used RNA-seq to sample six tissues across two closely related but
ecologically and morphologically divergent species, Begonia conchifolia and B. plebeja, yielding
17,012 and 19,969 annotated unigenes respectively. We identified the chalcone synthase gene
family members in our Begonia study species, as well as in Hillebrandia sandwicensis, the monotypic
sister genus to Begonia, Cucumis sativus, Arabidopsis thaliana, and Zea mays. Phylogenetic analysis
suggested the CHS gene family has high duplicate turnover, all members of CHS identified in Begonia
arising recently, after the divergence of Begonia and Cucumis. Expression profiles were similar within
orthologous pairs, but we saw high inter-ortholog expression variation. Sequence analysis showed
relaxed selective constraints on some ortholog pairs, with substitutions at conserved sites. Evidence
of pseudogenisation and species specific duplication indicate that lineage specific differences are
already beginning to accumulate since the divergence of our study species. We conclude that there
is evidence for a role of gene duplication in generating diversity through sequence and expression
divergence in Begonia.
Begonia is one of the most diverse Angiosperm genera, with more than 2000 species described to date1. The genus
is thought to have originated in Africa between 24 and 45 MYA and since then diversified across South America
and Asia2, where it occupies a wide range of niches, facilitated by a diversity of vegetative forms across s pecies3.
Strong population structure, high levels of drift, and genetic divergence at local scales are thought to con-
tribute to the high species diversity in Begonia4. Endemism is very c ommon5, and strong population structure is
known to coincide with high variation in morphological characteristics such as leaf shape and s ize6.
Begonia has also been shown to have highly variable genome s izes7, and evidence of whole genome duplica-
tions has been identified from paralog kS p eaks8. The contribution of gene and genome duplication has long been
associated with the evolution of phenotypic n ovelty9, and the effect of duplication on morphological diversity
in Begonia is ongoing. This study used multi tissue RNA-seq to study diversification in duplicated genes in two
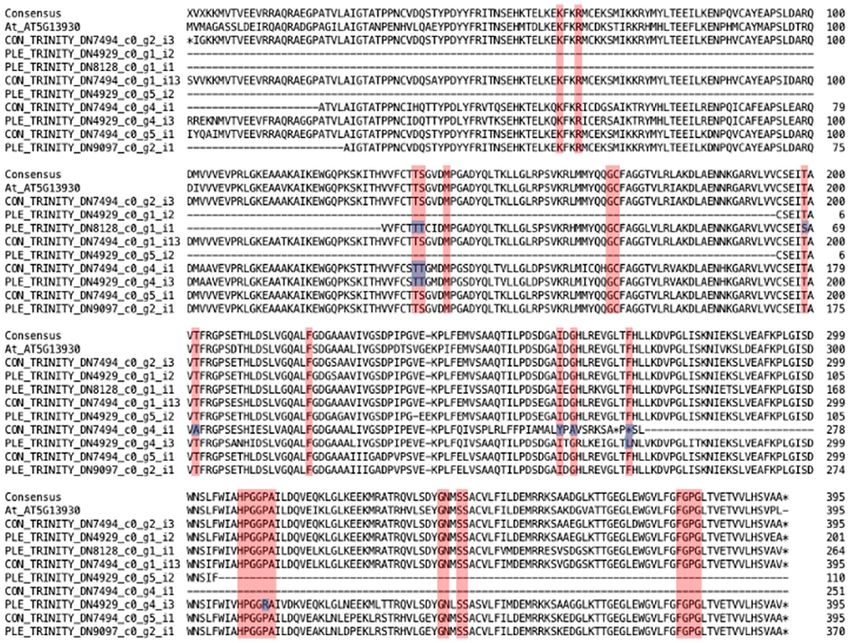
closely related but morphologically divergent species B. conchifolia and B. plebeja (Fig. 1).
Begonia conchifolia is a small terrestrial plant with long-lived fleshy peltate leaves and small white flowers.
It has a restricted distribution in wet rainforests across southern Mexico and Central America. Begonia plebeja,
1
Royal Botanic Gardens Edinburgh, 20a Inverleith Row, Edinburgh EH3 5LR, UK. 2Dementia Research Institute
at the University of Edinburgh, Edinburgh, UK. 3School of Biological Sciences, University of Edinburgh, King’s
Buildings, Mayfield Rd, Edinburgh EH9 3JU, UK. *email: katie.emelianova@ed.ac.uk
Scientific Reports | (2021) 11:17773 | https://doi.org/10.1038/s41598-021-96854-y 1
Vol.:(0123456789)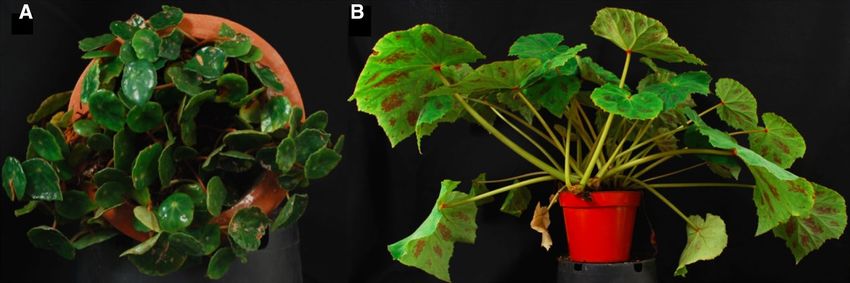
www.nature.com/scientificreports/
Figure 1. Photographs of study species used. B. conchifolia (A) and B. plebeja (B).
which also has a terrestrial growth form, is more widespread, occupying seasonally dry forests in northern
Mexico. It has larger, thinner leaves which are deciduous in some populations and often blotched. Flowers are
larger and sometimes tinged with pink10.
The recent divergence of B. conchifolia and B. plebeja and the distinct ecological niches they now occupy
provides a good model to study changes in duplicate gene sequence and expression post speciation. The differ-
ent environments inhabited by the two study species suggest they may face different ecological challenges; the
open and dry habitat of B. plebeja compared to the darker, shaded understorey habitat of B. conchifolia have wide
ranging consequences, including access to light, water availability, and risk of pathogen and fungal attack. Here
we use multi-tissue RNA-seq to interrogate patterns of duplicate gene evolution at the sequence and expression
level, focussing on evolutionary and duplication patterns of the anthocyanin biosynthetic gene chalcone synthase
(CHS, EC 2.3.1.47).
CHS is the first committed step of the anthocyanin biosynthesis p athway11, and is a crucial enzyme in the pro-
12–14
duction of compounds used in biotic and abiotic stress responses . Anthocyanin pigments are important in the
attenuation of high UV exposure, preventing PSII inhibition and the reduction of carbon intake15,16. Distribution
of anthocyanins across a variety of tissues helps low light dwelling plants make the most use of intermittent high
intensity sunflecks17,18 while avoiding photodamage and attenuating stress response through ROS s cavenging19.
Uncovering the genetic and genomic basis upon which phenotypic and biochemical changes occurred may
shed light on the mechanism of divergence in B. conchifolia and B. plebeja, and may answer wider questions about
diversification in the genus Begonia. The wide ranging role CHS plays in biotic and abiotic responses makes it a
good initial candidate for investigating patterns of diversification in sequence and expression pattern. With our
investigation of CHS, we hope to shed light on the evolution of a historically d ynamic20,21 gene family pre- and
post-speciation of B. conchifolia and B. plebeja.
Methods
Tissue sampling and RNA extraction. Plant tissue was donated from plants in the living collection at
Royal Botanic Gardens Edinburgh. The tissues chosen for study, mature leaf, mature petiole, vegetative bud,
female flower, male flower and root, were harvested between 9 and 10am between January and May 2015 from B.
conchifolia (Accession Number: 20042082) and B. plebeja (Accession Number: 20051406) (evergreen genotype).
Both accessions were housed in the same greenhouse and grown under the same conditions. Leaves were the first
fully expanded leaf on the axis, petioles were from these leaves, flowers were staged between tepals just opening
and tepals fully expanded, roots were young white roots within 5–10 cm of the apex. RNA from three biological
replicates per tissue was extracted using the phenol chloroform protocol22 and quantitated using Qubit (Thermo
Fisher). Sample purity was estimated using a NanoVue Spectrophotometer.
Sequencing. Library preparation and sequencing, carried out by Edinburgh Genomics, consisted of prepa-
ration of TruSeq mRNA-seq libraries, and generation of c. 240 million 150 base pair paired-end reads on one
lane of a HiSeq rapid v1 machine. Raw reads are stored in the European Nucleotide Archive under the study
accession PRJEB26711.
Removal of contaminants from RNA‑seq reads. BlobTools23 was used to screen for and remove con-
taminants from assemblies. Reads were first adapter trimmed using Trimmomatic24 using a 4 base sliding win-
dow and a minimum mean quality of 15. Leading and trailing bases lower than quality score 3 were trimmed.
Total adapter trimmed reads were assembled using Trinity v2.5.125 using default parameters. Coverage was esti-
mated by mapping reads back to their corresponding species assembly with STAR v2.5.3a26 using default param-
eters. Finally, contigs from each assembly were used as a query to search against the NCBI nucleotide database
(nt) with BLAST v2.2.28 for taxonomy assignment.
Using the assembly, taxonomy and coverage files, BlobPlots were created to visualise contigs partitioned by
taxon, GC content, and coverage. Contigs which were annotated as Streptophyta were used to extract associated
reads belonging to this taxon using the BlobTools bamfilter functionality.
Scientific Reports | (2021) 11:17773 | https://doi.org/10.1038/s41598-021-96854-y 2
Vol:.(1234567890)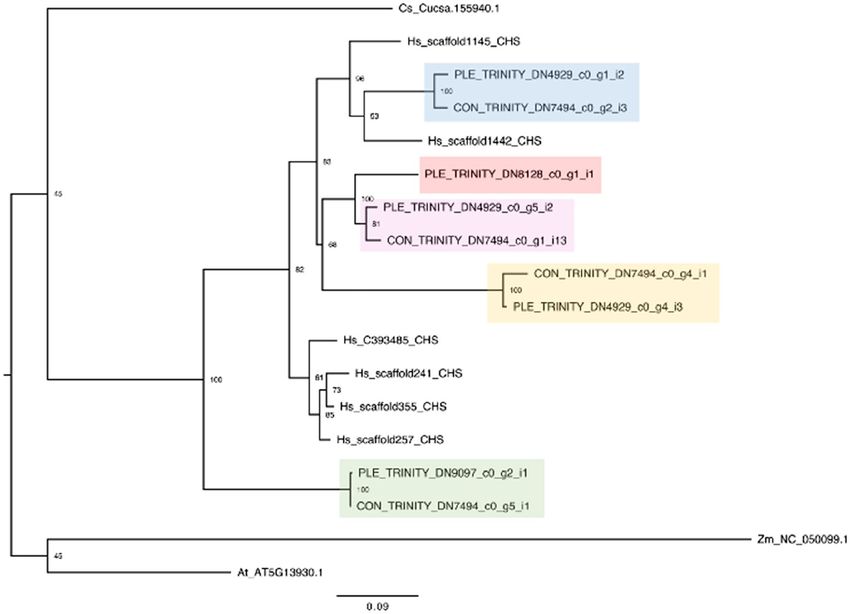
www.nature.com/scientificreports/
Assembly and quality control. Decontaminated total reads were assembled using Trinity v2.6.4 using
default parameters. The longest isoform per gene was obtained with Trinity utility scripts to obtain a set of uni-
genes for each assembly.
Transcriptome assembly quality was assessed with Transrate v.1.0.327. Transrate reports basic metrics for a
transcriptome assembly and provides quality information for assembled contigs using coverage and accuracy
information by mapping reads to assembled contigs.
Transcriptome assembly completeness was estimated using BUSCO v4.0.028, using transcriptome mode.
Annotation. The Trinotate v3.2.1 p ipeline29 was used to functionally annotate unigenes for each species.
Unigenes were searched against the Swissprot database with blastx v2.2.28 using an E value cutoff of 1 e−3 and
setting maximum target sequences to 1.
Most likely longest ORF peptide sequences were predicted from unigenes with Transdecoder v5.5.0. The
resulting predicted peptides were used to search against the Swissprot database with blastp v2.2.28, using an
E-value cutoff of 1e−3 and setting maximum target sequences to 1. Protein domains were identified by searching
predicted longest ORF peptides against the Pfam database using hmmscan v3.1b1. Blast homologies from blastp
and blastx results and Pfam domains from hmmscan results were loaded into the Trinotate provided SQLite
database, and an annotation report was generated.
Coverage. Decontaminated reads per tissue and replicate were mapped to unigenes for each species with
STAR v2.5.3a using default parameters. Read counts were summarized across features using Subread’s Feature-
Counts v1.5.230, not including read pairs which map to different contigs.
Expression normalization. EdgeR31 was used to normalise counts generated by FeatureCounts. Library
size and composition was accounted for using TMM (trimmed mean of M-values) normalisation, and average
FPKM values were calculated for replicates of tissue groups per species.
Characterization of CHS. The Arabidopsis thaliana protein sequence (AT5G13930) was used to search the
B. conchifolia and B. plebeja nucleotide databases of longest assembled isoforms with tblastn, using a conserva-
tive estimate of homology32 of E value threshold of 1e−20 and a percent identity threshold of 50%.
The same strategy was used to find homologs of CHS in the draft Hillebrandia sandwicensis genome33, tblastn
coordinates were used to extract CHS coding sequences from contigs containing hits. Nucleotide sequences
of positive hits in B. conchifolia, B. plebeja and H. sandwicensis were aligned with the A. thaliana CHS cDNA
sequence and a Zea mays homolog of CHS (C2, gene symbol LOC100274415) with Geneious34 using the Geneious
aligner, specifying global alignment with free end gaps, a similarity threshold of 65%, and a cost matrix of 5/− 4
for matches and mismatches respectively.
Phylogenetic analysis of CHS. Sequences with an overlap shorter than 200 bp with all other sequences
were not included in further analysis, as per previous studies35. Intronic sequence introduced by genomic
sequences was excised, and conserved sequence composed of the first and second exon was extracted. The align-
ment was manually checked and corrected prior to further analysis.
The final alignment of CHS sequences was used to perform a model selection procedure using Model
Generator36 based on the Akaike Information Criterion (AIC).
RAxML37 was used to construct a gene tree using the GTR + R substitution model with 1000 bootstrap
replicates.
Analysis of conserved sites in CHS. The peptide sequence of all Begonia CHS sequences was identified by
translating sequences into all six reading frames and aligning with the A. thaliana CHS (AT5G13930) using the
Geneious aligner with default settings, identifying the correct reading frame of Begonia CHS by greater than 50%
sequence similarity to the A. thaliana protein sequence. Previously identified conserved sites11,38 were mapped
onto the alignment of correctly translated Begonia peptide sequences and the A. thaliana protein sequence.
Selection analysis of CHS. Codeml from the PAML package of programs39 was used to estimate the rate
of nonsynonymous substitutions to synonymous substitutions (dN/dS). First, we used the peptide alignment of
Begonia CHS to create a translational alignment of the nucleotide coding sequences of each pair of orthologous
transcripts, where a pair was available, using the Geneious aligner with default settings. A pairwise analysis of
dN/dS was performed on each orthologous pair of Begonia CHS sequences using codeml, setting runmode to
− 2, running on codon data, and specifying one dN/dS ratio to be calculated for the whole alignment.
Statement on plant guidelines. Collection of plant material complies with relevant institutional,
national, and/or international guidelines and legislation.
Results
To remove sequences sampled from other taxa during RNA extraction, BlobTools was used to classify assem-
bled transcript sequences, and only reads contributing to sequences classified as Streptophyta were used for all
downstream analysis.
BlobTools infers taxonomic annotation from a similarity search of the input sequences against a public
sequence collection (e.g. NCBI nt), and determines the taxonomy of each sequence using a taxrule algorithm.
Scientific Reports | (2021) 11:17773 | https://doi.org/10.1038/s41598-021-96854-y 3
Vol.:(0123456789)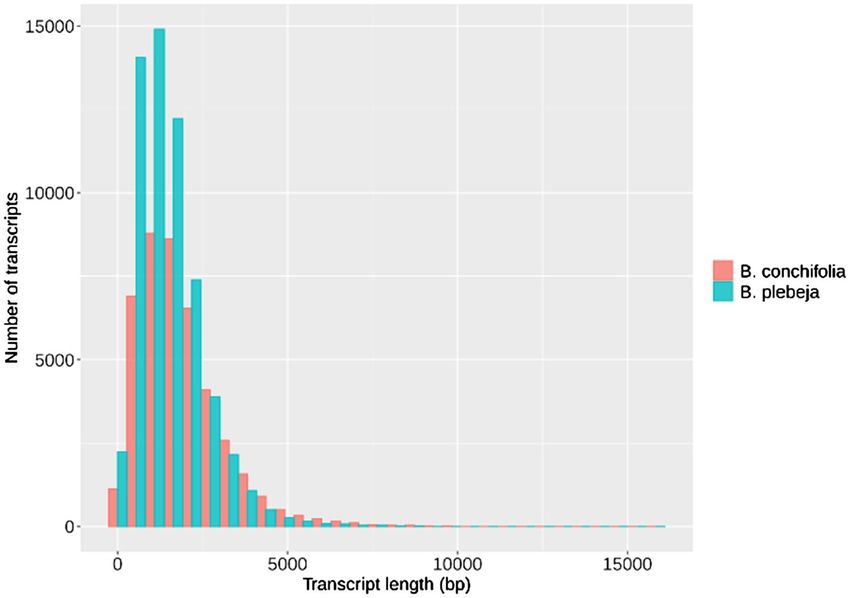
www.nature.com/scientificreports/

                                             Figure 2.  Sequence length histogram showing B. conchifolia and B. plebeja sequence length distribution.

                                                                  B. conchifolia   B. plebeja
                                             Number of seqs       42,614           59,106
                                             Number of unigenes   17,012           19,969
                                             Smallest seq         201              201
                                             Largest seq          15,923           16,037
                                             N over 1 kb          31,876           37,865
                                             N over 10 kb         28               16
                                             N with ORF           32,848           43,119
                                             N90                  1090             842
                                             N50                  2381             1905

                                             Table 1.  Assembly statistics for B. conchifolia and B. plebeja before and after contaminant removal.

                                             Coverage and GC content of the annotated sequences are plotted in order to visualise the partitioned sequences
                                             and perform downstream contaminant screening.
                                                 Screening for contaminants revealed the majority of taxonomically assigned transcripts belonged to Strep-
                                             tophyta, with 62,082 and 68,696 transcripts from B. conchifolia and B. plebeja respectively assigned to the taxon
                                             (supplementary Figs. 1 and 2). The next most frequent taxon represented by annotated transcripts in B. conchifolia
                                             is Arthropoda with 3629 transcripts, and Ascomycota in B. plebeja with 7309 transcripts, representing plausible
                                             sources of contamination from a greenhouse setting.
                                                 The sequence length weighted span of coverage in both species’ BlobPlots shows Streptophyta having the
                                             second highest peak of coverage after no-hit sequences, and the widest span, reflecting the range of expression
                                             levels of the transcripts screened.
                                                 Using the BlobPlot information, reads from both annotated contaminant and no-hit transcripts were removed
                                             from further analysis totalling around 80 million reads in B. conchifolia and 64 million in B. plebeja (supple-
                                             mentary table 1).
                                                 Comparison of sequence length distributions showed that B. plebeja assembled transcripts were skewed
                                             towards shorter transcripts, while B. conchifolia transcripts had fewer shorter transcripts and an increasingly
                                             greater number of longer transcripts (Fig. 2). Begonia conchifolia had higher N50 and N90 (2381 and 1090) com-
                                             pared to B. plebeja (1905 and 842) (Table 1), and BUSCO assessment of transcriptome completeness (Table 2)
                                             showed that B. plebeja had marginally poorer scores for transcript completeness and fragmentation, however
                                             both transcriptomes showed over 80% completeness.
                                                 The Trinotate pipeline was used to annotate 17,012 B. conchifolia and 19,969 B. plebeja unigenes (supple-
                                             mentary files 3 and 4). More unigenes were annotated in B. plebeja than in B. conchifolia within each annotation

          Scientific Reports |   (2021) 11:17773 |                https://doi.org/10.1038/s41598-021-96854-y                                                 4

Vol:.(1234567890)
www.nature.com/scientificreports/
BUSCO category B. conchifolia B. plebeja
Complete 362 (85.2%) 351 (82.5%)
Complete single copy 352 (82.8%) 344 (80.9%)
Complete duplicated 10 (2.4%) 7 (1.6%)
Fragmented 23 (5.4%) 36 (8.5%)
Missing 40 (9.4%) 38 (9%)
Total 425 425
Table 2. BUSCO assessment of transcriptome completeness for B. conchifolia and B. plebeja.
Figure 3. Number of unigenes annotated using different annotation categories in B. conchifolia and B. plebeja.
source (Fig. 3), likely due to the larger number of input transcripts. Concordantly, B. plebeja also has more tran-
scripts without any annotation, 16.65% and 17.48% of unigenes are unannotated in B. conchifolia and B. plebeja
respectively. Roughly equal proportions of unigenes from both species were annotated to Streptophyta (70.87%
in B. conchifolia and 70.51% in B. plebeja).
Unigenes which shared sources of annotation were identified using UpSet plots, showing that, due to very
sparse EggNOG annotation (Fig. 3), the largest group of unigenes sharing annotation sources were annotated
with all sources except for EggNOG (supplementary Figs. 5 and 6), B. conchifolia having 7217 unigenes in this
group and B. plebeja 7787.
Unigene presence or absence across tissues was compared for B. conchifolia and B. plebeja, using a cutoff of
1 FPKM for whether a transcript is present or absent in a tissue. UpSet plots were used to visualise the shared
and tissue specific distribution of unigene expression (supplementary Figs. 3 and 4). The majority of unigenes
are expressed in all tissues (11,495 unigenes in B. conchifolia and 13,609 unigenes in B. plebeja).
Both species had a high frequency of unigenes expressed uniquely in root (528 and 502 unigenes in B. con-
chifolia and B. plebeja respectively) and in male flower (223 and 359 unigenes in B. conchifolia and B. plebeja
respectively).
To identify unigenes which are uniquely expressed in each tissue, we used a 1 FPKM cut-off for unigene
expression, identifying unigenes which are expressed in a single tissue and not expressed in any other tissues.
For example, a unigene which is uniquely expressed in root has an expression of more than 1 FPKM in root, and
less than 1 FPKM in all other tissues. To identify the functional categories of genes uniquely expressed per tissue,
we mapped GO terms to tissue specific unigenes (plotted in supplementary Figs. 7and 8). The total number of
GO terms mapped to these uniquely expressed unigenes, here referred to as unique GO terms (UGT), is shown
in Table 3. Begonia conchifolia and B. plebeja had a comparable number of UGTs across tissues. Both species
had fewer UGTs in female flower compared to male flower (199 and 131 in female flower and 772 and 924 in
male flower in B. conchifolia and B. plebeja respectively). Of all tissues, leaf had the least UGTs in both species
(69 and 0 in leaf in B. conchifolia and B. plebeja respectively), and root tissue had the greatest number (1183 and
Scientific Reports | (2021) 11:17773 | https://doi.org/10.1038/s41598-021-96854-y 5
Vol.:(0123456789)www.nature.com/scientificreports/
Tissue B. conchifolia B. plebeja
Female flower 199 131
Leaf 69 0
Male flower 772 924
Petiole 338 113
Root 1183 1820
Vegetative bud 102 443
Table 3. Number of GO terms mapped to unigenes expressed uniquely in each tissue in B. conchifolia and B.
plebeja.
1820 in leaf in B. conchifolia and B. plebeja respectively). Tissues which had the biggest difference in number of
UGTs between species were petiole (a difference of 225 UGTs) and vegetative bud (a difference of 341 UGTs).
After alignment of the CHS copies identified, any CHS sequences which had an overlap of less than 200 bp
within the conserved coding sequence with any other sequence were discarded (supplementary file 1). A maxi-
mum likelihood tree was inferred from the remaining subset of CHS copies identified in B. conchifolia and B.
plebeja, using Z. mays as an outgroup, and including the CHS sequence of Cucumis sativus, the closest relative
to Begonia with a publicly available genome sequence40, and H. sandiwcensis, the monotypic sister genus to
Begonia (supplementary file 2). Four copies of CHS were identified in B. conchifolia and five copies in B. plebeja.
At least one more copy exists in both species (supplementary table 2), but due to incomplete sequence recon-
struction, it is not possible to assign a copy number with any certainty. Of the nine CHS sequences included for
B. conchifolia and B. plebeja, four pairs of closely related orthologs were identified in B. conchifolia and B. plebeja,
as well as one additional B. plebeja duplicate.
The phylogenetic tree reconstructed for CHS copies from Begonia, Hillebrandia, C. sativus, A. thaliana and Z.
mays revealed duplicates from B. conchifolia and B. plebeja arose after the divergence of Begonia and its closest
sequenced neighbour in the Curcurbitales, C. sativus. Begonia sequences were obtained from RNA-seq, therefore
it is not possible to confirm that no older duplicates exist in B. conchifolia and B. plebeja, however the absence of
older duplicates in the genome of H. sandiwcensis, the monotypic species of Begonia’s sister genus Hillebrandia
supports a pattern of high duplicate turnover in the Begoniaceae.
The nine copies identified in B. conchifolia and B. plebeja are four putative orthologs and one single B. plebeja
duplicate, and are colour coded for ease of comparison (Figs. 4 and 5).
The oldest duplication identified in Begonia gives rise to group 4 orthologs (in green, Fig. 4), and is placed
after the divergence of Begonia and Cucumis.
The intra-ortholog expression similarity (e.g. group 1 B. conchifolia ortholog vs group 1 B. plebeja ortholog) is
reasonably high (Fig. 5), and reflects the recent speciation of the two study species. The single B. plebeja ortholog
in group 5 (red) also shows high similarity in expression profile to group 2 orthologs (pink), mirrored by the
phylogenetic proximity of the two groups (Fig. 4). Any changes between each ortholog pair are therefore the
result of expression changes since divergence of B. conchifolia and B. plebeja.
Inter-ortholog expression is more variable; ortholog group 1 (blue) has the highest expression (B. conchifolia
FPKM min = 530, max = 2350, B. plebeja FPKM min = 408, max = 2903), and group 3 (yellow) has the lowest
expression (B. conchifolia FPKM min = 0.11, max = 2.42, B. plebeja FPKM min = 2.06, max = 14.91). Ortholog
groups 2 (B. conchifolia FPKM min = 27.57, max = 576.92, B. plebeja FPKM min = 11.91, max = 635.85 and 4
(B. conchifolia FPKM min = 13.65, max = 365.58, B. plebeja FPKM min = 12.26, max = 606.76) have much more
comparable expression, indicating that phylogenetic proximity is not correlated with expression similarity in
this case. The only exception is the group 5 single B. plebeja duplicate (FPKM min = 27.28, max = 871.03), which
is the product of a duplication shortly before the group 2 orthologs, and shares similarity in expression due to
phylogenetic proximity.
The group 3 CHS orthologs appear to have considerably decreased expression levels in both species, the B.
conchifolia ortholog showing less than 1 FPKM expression across all tissues except for root.
Examination of the peptide sequence alignment shows that the group 3 orthologs have a higher mutation
rate, and the most peptide substitutions in conserved residues, some of which are catalytically important (Fig. 6).
Moreover, examination of the coding sequence of the B. conchifolia group 3 ortholog shows that it has a frameshift
mutation, resulting in two premature stop codons. While the B. plebeja group 3 ortholog also has mutations in
conserved residues, it appears to have a complete peptide sequence. The only other CHS sequence which has a
substitution at a conserved site is the single B. plebeja group 5 homolog, with three conserved sites showing a
substitution.
Synonymous and nonsynonymous substitution rates were compared between ortholog pairs to estimate the
level of selection acting on each pair of orthologs. A dN/dS ratio of < 1 indicates that the pair of sequences have
more synonymous than nonsynonymous substitutions and are therefore under purifying selection. Conversely,
a dN/dS ratio of > 1 indicates faster protein evolution, and that the sequences may be under positive selection.
All ortholog groups tested except for group 3 was under strong purifying selection (Table 4). Ortholog group
1 had the lowest dN/dS ratio, while group 4 had the most relaxed purifying selection. Group 3 orthologs showed
a dN/dS ratio of 1.49, indicating relaxation of selective constraints on this pair of orthologs.
Scientific Reports | (2021) 11:17773 | https://doi.org/10.1038/s41598-021-96854-y 6
Vol:.(1234567890)www.nature.com/scientificreports/
Figure 4. ML tree of CHS sequences from B. conchifolia (CON), B. plebeja (PLE), H. sandwicensis (Hs), C.
sativus (Cs), A. thaliana (At) and Z. mays (Zm). Pairs of orthologs are highlighted as follows: blue: group 1, pink;
group 2, yellow: group 3, green: group 4, red: group 5.
Discussion
The diversity of form seen across the Angiosperms is the topic of a wide scope of research, including
conservation41, plant breeding42 and evolution43.
In this study, we address the role of gene and genome duplication in the generation of phenotypic and
ecological diversity in Begonia using two closely related but ecologically distinct species, B. conchifolia and B.
plebeja. We use multi-tissue RNA-seq to sample six tissues across both species, thereby also producing valuable
transcriptomic sequence data to add to the growing genetic resources for Begonia.
We used contamination screening to find and remove contaminants. We identified a sizable number of
sequences of non-plant origin representing environmental contamination during tissue collection and RNA
extraction. Contamination of genomic and transcriptomic datasets is a widespread p roblem44, and while some
contaminants are easy to spot, such as odorant binding proteins and chemosensory proteins unique to i nsects45,
contaminants which are plausible homologs can pose a danger to the conclusions drawn from a s tudy46. Our
results have indicated that contaminants have lower coverage, presumably due to contaminant taxon tissue being
more sparsely sampled, and therefore contribute to a large proportion of fragmented and incomplete transcripts.
More transcript fragments may act to increase the perceived transcriptome complexity, and thus reduce the
transcriptome assembly q uality47.
After contaminant screening, 137,985,258 and 91,321,126 total reads were assembled into reference transcrip-
tomes composed of 17,012 and 19,969 unigenes for B. conchifolia and B. plebeja respectively. Both transcriptomes
had good metrics for completeness, 85.2% and 82.5% of BUSCOs were recovered completely in B. conchifolia
and B. plebeja respectively and less than 10% of BUSCOs were missing in both species. Quality metrics suggest
a higher rate of fragmented transcripts in B. plebeja; more total transcripts and a lower N50 and N90 (1905 and
842 and 2381 and 1090 for B. conchifolia and B. plebeja respectively).
More than 80% of both species’ transcriptomes were annotated using at least one source, providing valuable
context to the reference transcriptomes as well as to tissue specific expression. Analysis of GO terms revealed
leaves to be the most conserved in gene expression profiles between the two species and vegetative buds the most
distinct. This may reflect the different developmental decisions during development of the leaf and meristems as
the different leaf shapes and plant architectures are laid down, compared to very similar functional expression
patterns in the mature leaf.
Multi-tissue RNA-seq allows for greater spatial resolution when investigating the fates of duplicated genes
in isolation as well as within coexpression n etworks48,49. Expression divergence in gene duplicates is a key pro-
cess that allows for tissue specialization and morphological diversification50, however these changes are also
Scientific Reports | (2021) 11:17773 | https://doi.org/10.1038/s41598-021-96854-y 7
Vol.:(0123456789)www.nature.com/scientificreports/
10
CON_TRINITY_DN7494_c0_g2_i3
8 group1
6
4 group2
2
0 group3
PLE_TRINITY_DN4929_c0_g1_i2 −2
group4
group5
CON_TRINITY_DN7494_c0_g1_i13
PLE_TRINITY_DN4929_c0_g5_i2
PLE_TRINITY_DN8128_c0_g1_i1
CON_TRINITY_DN7494_c0_g4_i1
PLE_TRINITY_DN4929_c0_g4_i3
CON_TRINITY_DN7494_c0_g5_i1
PLE_TRINITY_DN9097_c0_g2_i1
t
d
er
er
af
le
oo
bu
io
Le
w
w
R
t
flo
flo
Pe
e
tiv
e
e
ta
al
al
M
m
ge
Fe
Ve
Figure 5. Heatmap of log2 FPKM of CHS homologs in B. conchifolia and B. plebeja. Ortholog groups refer to
highlighted homologous CHS pairs in the ML gene tree.
dependent on mode of d uplication50. Further development of genomic data in Begonia may help to distinguish
between the products of tandem and whole genome duplication and changes in their expression profiles since
duplication.
Since the speciation of B. conchifolia and B. plebeja, their habitat range has diverged; the former lives in moist,
shaded understorey, while the latter is found in open, seasonally dry forests51.
The different ecological niches occupied by our two study species may have driven their divergent phenotypic
evolution, for example in their approach to light and water usage, and optimisation of photosynthetic capacity. In
this study, we investigated the role duplicated genes may play in generating phenotypic and biochemical diversity.
We chose chalcone synthase (CHS), a key gene in the anthocyanin biosynthesis pathway, for further inves-
tigation due to the wide range of environmental responses it is involved in. While CHS is a key gene in the
anthocyanin biosynthesis pathway with a role in attenuating high intensity light and acclimating to low light
availability52,53, other roles of CHS include drought tolerance54 herbivory defense55,56, and defense against
pathogens57,58.
Due to incomplete assembly of all CHS copies, four copies of CHS were investigated in B. conchifolia and five
in B. plebeja, however both species have at least one additional copy of CHS that were excluded due to insuf-
ficient sequence length. CHS copies used in phylogenetic and expression analysis revealed they were all derived
from duplications after the divergence of Begonia and Cucumis. The recent origin of all identified Begonia and
Hillebrandia CHS copies may suggest a high turnover of the CHS gene family in the Begoniaceae; the loss of
expression of old gene duplicates and a high duplication rate leading to only recent duplicates having a detect-
able expression level. The genomic source of CHS copies in H. sandwicensis supports a scenario of the loss of
old CHS duplicates from the genome altogether, rather than retention in the genome with little to no detectable
expression. Without a reference genome for our study species, it is not possible to say with certainty that this
pattern is replicated in Begonia.
Of the five ortholog groups identified in CHS, three have detectable expression and an uninterrupted coding
sequence in both species (groups 1, 2, and 4).
Group 3 orthologs have the lowest expression level, B. conchifolia not showing expression higher than 3 FPKM
in any tissue, while B. plebeja has expression levels ranging from 2.1 to 14.9 FPKM. A frameshift mutation leading
to two premature stop codons in the B. conchifolia group 3 ortholog is supportive of a loss of function mutation,
resulting in this copy being non-functional in B. conchifolia. The B. plebeja group 3 ortholog does not show any
obvious loss of function mutations, which may indicate that while its expression is low, it may still perform a
function. The single member of ortholog group 5 is represented by B. plebeja, which showed a similar expression
pattern to group 2, to which it was closest related, and well as group 4, possibly reflecting an ancestral expression
Scientific Reports | (2021) 11:17773 | https://doi.org/10.1038/s41598-021-96854-y 8
Vol:.(1234567890)www.nature.com/scientificreports/
Figure 6. Multiple sequence alignment of CHS copies from B. conchifolia, B. plebeja and A. thaliana. Residues
highlighted in red correspond to conserved sites obtained from the literature. Residues highlighted in blue are
sites which differ in at least one Begonia sequence.
B. conchifolia ortholog B. plebeja ortholog Ortholog group dN dS dN/dS
CON_TRINITY_DN7494_c0_g2_i3 PLE_TRINITY_DN4929_c0_g1_i2 Group 1 0.009 0.1064 0.0845
CON_TRINITY_DN7494_c0_g1_i13 PLE_TRINITY_DN4929_c0_g5_i2 Group 2 0.0118 0.1082 0.1090
CON_TRINITY_DN7494_c0_g4_i1 PLE_TRINITY_DN4929_c0_g4_i3 Group 3 0.0319 0.0213 1.4998
CON_TRINITY_DN7494_c0_g5_i1 PLE_TRINITY_DN9097_c0_g2_i1 Group 4 0.0012 0.0040 0.2953
Table 4. Nonsynonymous substitutions (dN), synonymous substitutions (dS) and dN/dS ratio for ortholog
pairs. Ortholog group refers to ortholog groupings in Figs. 4 and 5.
pattern. The close proximity of the B. plebeja group 5 ortholog to the group 2 orthologs, and the absence of
expression of a B. conchifolia ortholog suggests this may be a species specific duplication.
Examination of Begonia CHS coding sequences showed a variable level of synonymous and nonsynonymous
substitutions across ortholog groups; the ortholog pair under the most relaxed evolutionary constraints was the
very lowly expressed group 3 (Table 4), showing evidence of positive selection, concomitant with an apparent
loss of function mutation in B. conchifolia and changes in the B. plebeja peptide sequence corresponding to
conserved sites (Fig. 6). Increased expression in the B. plebeja group 3 ortholog relative to B. conchifolia may
indicate that it still retains some function, and the positive selection acting on this CHS copy could allow the
development of novel functionality.
The CHS gene family in B. conchifolia and B. plebeja has shown evidence of high duplicate turnover, as well
as positive selection acting on some duplicate copies. High gene duplication rate is a prominent feature in taxa
which have undergone phenotypic shifts, where new duplicate genes can be co-opted into a new developmental
or biochemical p rogram59. The asymmetric retention or duplication of genes, as seen in CHS in Begonia is an
Scientific Reports | (2021) 11:17773 | https://doi.org/10.1038/s41598-021-96854-y 9
Vol.:(0123456789)www.nature.com/scientificreports/
important mode of adaptation to new e nvironments60 and identification of selectively retained duplicate genes
can reveal functional biases of ecological importance61.
Adaptive evolution in combination with high duplicate turnover can allow the divergence of gene families
between species through the rapid fixation of non-synonymous mutations62. New lineage specific duplicates
may be preferentially retained and undergo adaptive evolution in response to environmental s tresses63, and
the open, high light environment of B. plebeja may exert selective pressure on genes related to optimising light
harvesting, such as CHS.
Full data from a genome assembly is needed to resolve the likeliest evolutionary scenario, however the data
presented here supports the hypothesis that chalcone synthase is highly dynamic in Begonia with signatures of
rapid diversification at both the sequence and expression level and may be important in the phenotypic shifts
that occurred after the speciation of B. conchifolia and B. plebeja.
Conclusions
Begonia is a mega-diverse genus, with excellent applicability to research in conservation and plant breeding.
We have produced a multi-tissue RNA-seq dataset in two closely related but morphologically and ecologically
divergent species of Begonia, providing a valuable addition to the growing base of genomic resources in the genus.
Recent duplications in an important anthocyanin biosynthetic gene, chalcone synthase, have led to sequence
and expression divergence of duplicate copies, suggesting duplication patterns in this gene family are dynamic
and prone to high turnover rates.
Further transcriptome wide investigations using the RNA-seq dataset generated here may help uncover species
specific changes in expression profiles that have contributed to the ecological divergence of B. conchifolia and B.
plebeja and answer wider questions about the role gene duplication plays in the generation of diversity in Begonia.
Received: 8 April 2021; Accepted: 17 August 2021
References
1. Hughes, N. M. et al. Begonia Resource Centre, Online database available from http://padme.rbge.org.uk/begonia/. (2015).
2. Goodall-Copestake, W. P., Harris, D. J. & Hollingsworth, P. M. The origin of a mega-diverse genus: dating Begonia (Begoniaceae)
using alternative datasets, calibrations and relaxed clock methods. Bot. J. Linn. Soc. 159, 363–380 (2009).
3. Dewitte, A., Twyford, A. D., Thomas, D. C., Kidner, C. A. & Huylenbroeck, J. V. The origin of diversity in begonia: genome dyna-
mism, population processes and phylogenetic patterns. Dyn. Process. Biodivers. Case Stud. Evol. Spat. Distrib. (2011). https://doi.
org/10.5772/23789.
4. Hughes, M. & Hollingsworth, P. M. Population genetic divergence corresponds with species-level biodiversity patterns in the large
genus Begonia. Mol. Ecol. 17, 2643–2651 (2008).
5. Kiew, R. The Limestone Begonias of Sabah, Borneo—Flagship species for conservation. Gard. Bull. Singap. 53, 241–286 (2001).
6. McLellan, T. Geographic variation and plasticity of leaf shape and size in Begonia dregei and B. homonyma (Begoniaceae). Bot. J.
Linn. Soc. 132, 79–95 (2000).
7. Dewitte, A. D. et al. Genome size variation in Begonia. Genome https://doi.org/10.1139/G09-056 (2009).
8. Brennan, A. C. et al. Genomic resources for evolutionary studies in the large, diverse, tropical genus, Begonia. Trop. Plant Biol. 5,
261–276 (2012).
9. Zhang, L. et al. The ancient wave of polyploidization events in flowering plants and their facilitated adaptation to environmental
stress. Plant Cell Environ. 43, 2847–2856 (2020).
10. Burt-Utley, K. A revision of Central American species of Begonia section Gireoudia (Begoniaceae). Tulane Stud. Zool. Bot. 25,
1–131 (1985).
11. Ferrer, J.-L., Jez, J. M., Bowman, M. E., Dixon, R. A. & Noel, J. P. Structure of chalcone synthase and the molecular basis of plant
polyketide biosynthesis. Nat. Struct. Biol. 6, 775–784 (1999).
12. Fofana, B. et al. Milsana-induced resistance in powdery mildew-infected cucumber plants correlates with the induction of chalcone
synthase and chalcone isomerase. Physiol. Mol. Plant Pathol. 61, 121–132 (2002).
13. Banik, N. & Bhattacharjee, S. Complementation of ROS scavenging secondary metabolites with enzymatic antioxidant defense
system augments redox-regulation property under salinity stress in rice. Physiol. Mol Biol. Plants Int. J. Funct. Plant Biol. 26,
1623–1633 (2020).
14. Karageorgou, P., Buschmann, C. & Manetas, Y. Red leaf color as a warning signal against insect herbivory: Honest or mimetic?.
Flora Morphol Distrib. Funct. Ecol. Plants 203, 648–652 (2008).
15. Krause, G. H. et al. Photosynthesis, photoprotection, and growth of shade-tolerant tropical tree seedlings under full sunlight.
Photosynth. Res. 113, 273–285 (2012).
16. Zhang, Q., Liu, M. & Ruan, J. Metabolomics analysis reveals the metabolic and functional roles of flavonoids in light-sensitive tea
leaves. BMC Plant Biol. 17, 64 (2017).
17. Chazdon, R. L. & Pearcy, R. W. The importance of sunflecks for forest understory plants. Bioscience 41, 760–766 (1991).
18. Hughes, N. M. et al. Photosynthetic costs and benefits of abaxial versus adaxial anthocyanins in Colocasia esculenta ‘Mojito’. Planta
240, 971–981 (2014).
19. Zhang, T.-J. et al. A magic red coat on the surface of young leaves: Anthocyanins distributed in trichome layer protect Castanopsis
fissa leaves from photoinhibition. Tree Physiol. 36, 1296–1306 (2016).
20. Durbin, M. L., Learn, G. H., Huttley, G. A. & Clegg, M. T. Evolution of the chalcone synthase gene family in the genus Ipomoea.
Proc. Natl. Acad. Sci. 92, 3338–3342 (1995).
21. Durbin, M. L., McCaig, B. & Clegg, M. T. Molecular evolution of the chalcone synthase multigene family in the morning glory
genome. Plant Mol. Biol. 42, 79–92 (2000).
22. Logemann, J., Schell, J. & Willmitzer, L. Improved method for the isolation of RNA from plant tissues. Anal. Biochem. 163, 16–20
(1987).
23. Laetsch, D. R. & Blaxter, M. L. BlobTools: Interrogation of genome assemblies. F1000Research 6, 1287 (2017).
24. Bolger, A. M., Lohse, M. & Usadel, B. Trimmomatic: A flexible trimmer for Illumina sequence data. Bioinformatics 30, 2114–2120
(2014).
25. Grabherr, M. G. et al. Full-length transcriptome assembly from RNA-Seq data without a reference genome. Nat. Biotechnol. 29,
644–652 (2011).
Scientific Reports | (2021) 11:17773 | https://doi.org/10.1038/s41598-021-96854-y 10
Vol:.(1234567890)www.nature.com/scientificreports/
26. Dobin, A. et al. STAR: Ultrafast universal RNA-seq aligner. Bioinformatics 29, 15–21 (2013).
27. Smith-Unna, R., Boursnell, C., Patro, R., Hibberd, J. M. & Kelly, S. TransRate: Reference-free quality assessment of de novo tran-
scriptome assemblies. Genome Res. 26, 1134–1144 (2016).
28. Simão, F. A., Waterhouse, R. M., Ioannidis, P., Kriventseva, E. V. & Zdobnov, E. M. BUSCO: Assessing genome assembly and
annotation completeness with single-copy orthologs. Bioinformatics 31, 3210–3212 (2015).
29. Bryant, D. M. et al. A tissue-mapped axolotl de novo transcriptome enables identification of limb regeneration factors. Cell Rep.
18, 762–776 (2017).
30. Liao, Y., Smyth, G. K. & Shi, W. featureCounts: An efficient general purpose program for assigning sequence reads to genomic
features. Bioinformatics 30, 923–930 (2014).
31. Robinson, M. D., McCarthy, D. J. & Smyth, G. K. edgeR: A Bioconductor package for differential expression analysis of digital
gene expression data. Bioinformatics 26, 139–140 (2010).
32. Pearson, W. R. An introduction to sequence similarity (“homology”) searching. Curr. Protoc. Bioinforma. 42, 311–318 (2013).
33. Martínez, A. M. A Draft Genome Assembly for Hillebrandia Sandwicensis. (2017).
34. Kearse, M. et al. Geneious basic: An integrated and extendable desktop software platform for the organization and analysis of
sequence data. Bioinformatics 28, 1647–1649 (2012).
35. Li, Z.-Z., Sun, S.-S., Wang, Q.-F. & Chen, J.-M. RNA-Seq analysis of the distylous plant nymphoides peltata identified ortholog
genes between long- and short-styled flowers. Front. Ecol. Evol. 5, 66 (2017).
36. Keane, T. M., Creevey, C. J., Pentony, M. M., Naughton, T. J. & Mclnerney, J. O. Assessment of methods for amino acid matrix
selection and their use on empirical data shows that ad hoc assumptions for choice of matrix are not justified. BMC Evol. Biol. 6,
29 (2006).
37. Stamatakis, A. RAxML version 8: A tool for phylogenetic analysis and post-analysis of large phylogenies. Bioinformatics 30,
1312–1313 (2014).
38. Han, Y.-Y. et al. Molecular evolution and functional specialization of chalcone synthase superfamily from Phalaenopsis Orchid.
Genetica 128, 429–438 (2006).
39. Yang, Z. PAML 4: Phylogenetic analysis by maximum likelihood. Mol. Biol. Evol. 24, 1586–1591 (2007).
40. Huang, S. et al. The genome of the cucumber, Cucumis sativus L. Nat. Genet. 41, 1275–1281 (2009).
41. Paterson, A. H. et al. Comparative genome analysis of monocots and dicots, toward characterization of angiosperm diversity. Curr.
Opin. Biotechnol. 15, 120–125 (2004).
42. Chen, F. et al. Genome sequences of horticultural plants: Past, present, and future. Hortic. Res. 6, 1–23 (2019).
43. Onstein, R. E. Darwin’s second ‘abominable mystery’: Trait flexibility as the innovation leading to angiosperm diversity. New Phytol.
228, 1741–1747 (2020).
44. Igloi, G. L. Evidence for fungal sequence contamination in plant transcriptome databases. Plant Syst. Evol. 305, 563–568 (2019).
45. Zhu, J., Wang, G. & Pelosi, P. Plant transcriptomes reveal hidden guests. Biochem. Biophys. Res. Commun. 474, 497–502 (2016).
46. Simion, P. et al. A software tool ‘CroCo’ detects pervasive cross-species contamination in next generation sequencing data. BMC
Biol. 16, 28 (2018).
47. Chang, Z., Wang, Z. & Li, G. The impacts of read length and transcriptome complexity for de novo assembly: A simulation study.
PLoS ONE 9, e94825 (2014).
48. Sundell, D. et al. AspWood: High-spatial-resolution transcriptome profiles reveal uncharacterized modularity of wood formation
in populus tremula. Plant Cell 29, 1585–1604 (2017).
49. Takahagi, K., Inoue, K. & Mochida, K. Gene co-expression network analysis suggests the existence of transcriptional modules
containing a high proportion of transcriptionally differentiated homoeologs in hexaploid wheat. Front. Plant Sci. 9, 66 (2018).
50. Shi, T. et al. Distinct expression and methylation patterns for genes with different fates following a single whole-genome duplica-
tion in flowering plants. Mol. Biol. Evol. 37, 2394–2413 (2020).
51. Ali, M. S. Genetic Architecture of Species Level Differences in Begonia Section Gireoudia. (2013).
52. Landi, M. et al. Unveiling the shade nature of cyanic leaves: A view from the “blue absorbing side” of anthocyanins. Plant Cell
Environ. 44, 1119–1129 (2021).
53. Franklin, K. A. Shade avoidance. New Phytol. 179, 930–944 (2008).
54. Hu, B. et al. Overexpression of Chalcone Synthase Gene Improves Flavonoid Accumulation and Drought Tolerance in Tobacco. https://
www.researchsquare.com/article/rs-8921/v2 (2020) https://doi.org/10.21203/rs.2.18297/v2.
55. Richard, S., Lapointe, G., Rutledge, R. G. & Séguin, A. Induction of chalcone synthase expression in white spruce by wounding
and jasmonate. Plant Cell Physiol. 41, 982–987 (2000).
56. Schenk, P. M. et al. Coordinated plant defense responses in Arabidopsis revealed by microarray analysis. Proc. Natl. Acad. Sci. 97,
11655–11660 (2000).
57. Habereder, H., Schröder, G. & Ebel, J. Rapid induction of phenylalanine ammonia-lyase and chalcone synthase mRNAs during
fungus infection of soybean (Glycine max L.) roots or elicitor treatment of soybean cell cultures at the onset of phytoalexin syn-
thesis. Planta 177, 58–65 (1989).
58. Cui, Y., Magill, J., Frederiksen, R. & Magill, C. Chalcone synthase and phenylalanine ammonia-lyase mRNA levels following
exposure of sorghum seedlings to three fungal pathogens. Physiol. Mol. Plant Pathol. 49, 187–199 (1996).
59. Lipinska, A. P. et al. Rapid turnover of life-cycle-related genes in the brown algae. Genome Biol. 20, 35 (2019).
60. Feng, C. et al. The genome of a cave plant, Primulina huaijiensis, provides insights into adaptation to limestone karst habitats. New
Phytol. 227, 1249–1263 (2020).
61. Rizzon, C., Ponger, L. & Gaut, B. S. Striking similarities in the genomic distribution of tandemly arrayed genes in arabidopsis and
rice. PLOS Comput. Biol. 2, e115 (2006).
62. Menardo, F., Praz, C. R., Wicker, T. & Keller, B. Rapid turnover of effectors in grass powdery mildew (Blumeria graminis). BMC
Evol. Biol. 17, 223 (2017).
63. Zhong, Y., Zhang, X., Shi, Q. & Cheng, Z.-M. Adaptive evolution driving the young duplications in six Rosaceae species. BMC
Genomics 22, 112 (2021).
Author contributions
K.E. performed the experiments, K.E. analysed the data, C.K., A.M.M. and L.C.D. helped in interpretation of
results and editing of the manuscript, and C.K. supervised the project.
Competing interests
The authors declare no competing interests.
Additional information
Supplementary Information The online version contains supplementary material available at https://doi.org/
10.1038/s41598-021-96854-y.
Scientific Reports | (2021) 11:17773 | https://doi.org/10.1038/s41598-021-96854-y 11
Vol.:(0123456789)www.nature.com/scientificreports/
Correspondence and requests for materials should be addressed to K.E.
Reprints and permissions information is available at www.nature.com/reprints.
Publisher’s note Springer Nature remains neutral with regard to jurisdictional claims in published maps and
institutional affiliations.
Open Access This article is licensed under a Creative Commons Attribution 4.0 International
License, which permits use, sharing, adaptation, distribution and reproduction in any medium or
format, as long as you give appropriate credit to the original author(s) and the source, provide a link to the
Creative Commons licence, and indicate if changes were made. The images or other third party material in this
article are included in the article’s Creative Commons licence, unless indicated otherwise in a credit line to the
material. If material is not included in the article’s Creative Commons licence and your intended use is not
permitted by statutory regulation or exceeds the permitted use, you will need to obtain permission directly from
the copyright holder. To view a copy of this licence, visit http://creativecommons.org/licenses/by/4.0/.
© The Author(s) 2021
Scientific Reports | (2021) 11:17773 | https://doi.org/10.1038/s41598-021-96854-y 12
Vol:.(1234567890)You can also read