Do shapes have feelings? Social attribution in children with autism spectrum disorder and attention-deficit/hyperactivity disorder
←
→
Page content transcription
If your browser does not render page correctly, please read the page content below
Translational Psychiatry                                                                                                                               www.nature.com/tp

ARTICLE                  OPEN

Do shapes have feelings? Social attribution in children with
autism spectrum disorder and attention-deficit/hyperactivity
disorder
                                 1,2,3,4,11 ✉
Marlee M. Vandewouw                          , Kristina Safar1,2,11, Sarah I. Mossad5, Julie Lu1,2, Jason P. Lerch2,6,7, Evdokia Anagnostou2,3,8 and
Margot J. Taylor1,2,9,10

© The Author(s) 2021

    Theory of mind (ToM) deficits are common in children with neurodevelopmental disorders (NDDs), such as autism spectrum
    disorder (ASD) and attention-deficit/hyperactivity disorder (ADHD), which contribute to their social and cognitive difficulties. The
    social attribution task (SAT) involves geometrical shapes moving in patterns that depict social interactions and is known to recruit
    brain regions from the classic ToM network. To better understand ToM in ASD and ADHD children, we examined the neural
    correlates using the SAT and functional magnetic resonance imaging (fMRI) in a cohort of 200 children: ASD (N = 76), ADHD (N =
    74) and typically developing (TD; N = 50) (4–19 years). In the scanner, participants were presented with SAT videos corresponding
    to social help, social threat, and random conditions. Contrasting social vs. random, the ASD compared with TD children showed
    atypical activation in ToM brain areas—the middle temporal and anterior cingulate gyri. In the social help vs. social threat condition,
    atypical activation of the bilateral middle cingulate and right supramarginal and superior temporal gyri was shared across the NDD
    children, with between-diagnosis differences only being observed in the right fusiform. Data-driven subgrouping identified two
    distinct subgroups spanning all groups that differed in both their clinical characteristics and brain–behaviour relations with ToM
    ability.

    Translational Psychiatry (2021)11:493 ; https://doi.org/10.1038/s41398-021-01625-y

INTRODUCTION                                                                               children [11, 14], with the ADHD children showing less
The ability to attribute mental states to oneself and to others while                      pronounced, but still present, difficulties compared with TD
understanding that the mental states of others are independent of                          children [12, 13].
one’s own is a crucial aspect of adaptive and appropriate social                              Heider et al. [15] first introduced a ToM task, called the social
interactions. This ability, called the theory of mind [1] (ToM),                           attribution task (SAT), which consists of animations of simple
emerges at preschool age and continues to develop over the                                 geometric shapes within an environment; the shapes move in
lifespan [2, 3]. This complex social-cognitive ability is supported by                     ways that elicit automatic attribution of social interactions to the
a rich network of brain regions including the temporal-parietal                            movements. Unlike many other ToM tasks, there are no complex
junction (TPJ), medial prefrontal cortices, and superior temporal                          language-dependent instructions, nor are there explicit portrayals
gyri in both children [4, 5] and adults [6]. Children with                                 of people and emotions, making it accessible for use with children
neurodevelopmental disorders (NDDs) such as autism spectrum                                and clinical populations. The SAT was originally a behavioural task,
disorder [7] (ASD) and attention-deficit/hyperactivity disorder [8]                         where the participants were asked to narrate the animations and
(ADHD) commonly present with ToM deficits, which contribute to                              their responses were coded on their attribution of social meaning
poorer development of social-cognitive skills.                                             to the sequences [16], but has since been adapted in various
    Owing to increasing awareness of the high rates of overlap and                         forms for neuroimaging studies [5, 17–27]. Compared with trials
comorbid symptoms in ASD and ADHD [9, 10], behavioural ToM                                 where the geometric shapes moved randomly, the social
atypicalities in children with these two disorders have begun to be                        animations engaged classic ToM regions in adults, including the
studied together in comparison to typically developing (TD)                                medial prefrontal cortices, superior temporal sulci, TPJ, amygdalae
children [11–14]. In behavioural studies, children with ASD                                and the fusiform gyri [25–34]. Only Moriguchi et al. [23] and
performed more poorly on ToM tasks than both ADHD and TD                                   Ohnishi et al. [5] have used the SAT to study ToM in small samples

1
 Department of Diagnostic Imaging, Hospital for Sick Children, Toronto, ON, Canada. 2Program in Neurosciences & Mental Health, Hospital for Sick Children, Toronto, ON, Canada.
3
 Autism Research Center, Bloorview Research Institute, Holland Bloorview Kids Rehabilitation Hospital, Toronto, ON, Canada. 4Institute of Biomedical Engineering, University of
Toronto, Toronto, ON, Canada. 5Department of Psychology, Hospital for Sick Children, Toronto, ON, Canada. 6Wellcome Centre for Integrative Neuroimaging, FMRIB, Nuffield
Department of Clinical Neurosciences, University of Oxford, Oxford, United Kingdom. 7Department of Medical Biophysics, University of Toronto, Toronto, ON, Canada. 8Institute of
Medical Science, University of Toronto, Toronto, ON, Canada. 9Department of Medical Imaging, University of Toronto, Toronto, ON, Canada. 10Department of Psychology,
University of Toronto, Toronto, ON, Canada. 11These authors contributed equally: Marlee M. Vandewouw, Kristina Safar. ✉email: marlee.vandewouw@sickkids.ca

Received: 10 June 2021 Revised: 16 August 2021 Accepted: 26 August 2021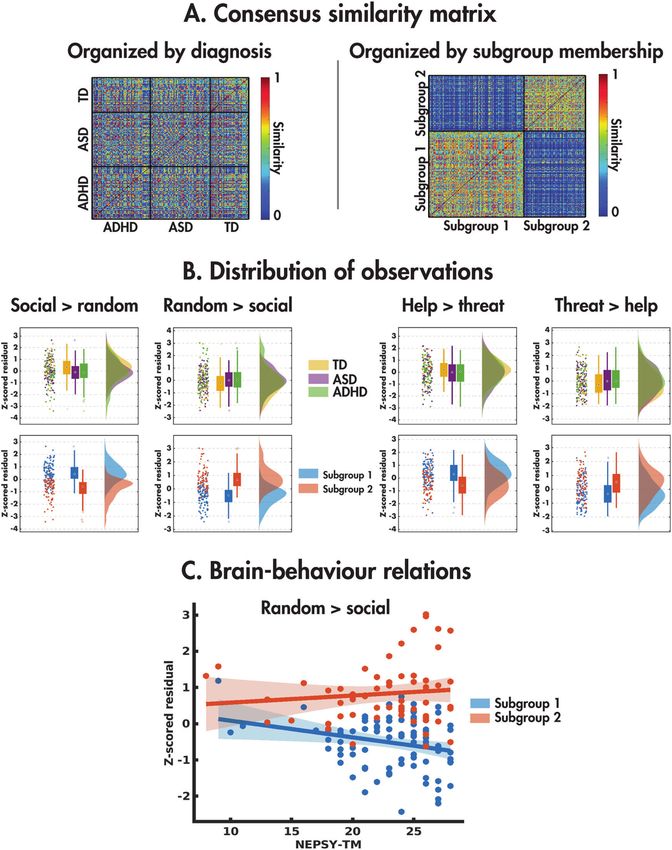
M.M. Vandewouw et al.
                  2
                      of TD children and adolescents, and showed activation in regions
                      similar to adults.
                         The SAT has also been used to investigate ToM in individuals
                      with ASD [16, 25, 28–32]. Behaviourally, when describing the
                      videos depicting ToM sequences, ASD children, adolescents and
                      adults performed worse than their TD counterparts [16, 29, 30, 32].
                      Neuroimaging studies have included mainly adults with ASD
                      [25, 28, 31]. Castelli et al. [28] found that ASD adults activated
                      similar ToM regions as TDs when watching the social interactions,
                      but to a lesser extent. Ammons et al. [31] also showed that both
                      TD and ASD adults activated ToM regions when watching                            Fig. 1 The Social Attribution Task (SAT). The SAT task consisted of
                      geometric shapes and human stick figures moving in a social                       trial blocks with a social or random video (15 s), a prompt asking the
                                                                                                       participant about the nature of the video (random or interacting, up
                      manner; however, typical adults activated the bilateral precuneus                to 3 s long depending on response time), and a rest period (8 s).
                      and superior and middle temporal regions to a greater extent than                Each run consisted of an initial ten-second rest period to acclimate
                      ASD adults. Using other ToM protocols, such as social stories and                the participant to the scanning environment, followed by eight trial
                      mentalizing, fMRI studies have investigated the neural under-                    blocks with two social help, two social threat, and four random
                      pinnings of ToM deficits in children with ASD [33–36]. Findings                   videos presented in a randomised order; a total of three runs were
                      have shown atypical recruitment of several brain regions involved                collected.
                      in ToM reasoning in ASD, with patterns of both increased [33, 34]
                      and decreased activation [35, 36] compared with TD children.
                         A recent fMRI study examined the neural correlates of ToM in a                attributions to the moving shapes or not (see Fig. 1 and Supplemental
                      large TD vs. ASD study including participants from 6 to 30 years of              Information for further details). The videos were classified into two
                      age [37]. A similar task to the SAT (the Frith-Happé triangles) was              conditions: social and random; their order was randomised across runs.
                      used including three different conditions: ToM, goal-directed and                The videos in the social condition were further categorised as either social
                      random movement. In contrast to the above studies, they found no                 help or social threat. After the videos, ‘random’ or ‘interacting’ appeared on
1234567890();,:

                      differences in social brain activity with either age or group.                   the screen and the children responded with a button press to indicate
                      Interestingly, this same task was used in four groups of adults: TD,             which word described the video. After completing the MRI session, the
                      ADHD, ASD and comorbid ADHD + ASD [38]. When comparing ToM                       videos were replayed to the participants outside the scanner, and they
                                                                                                       were asked “Tell me everything the shapes are doing”. For each video
                      and random animations, reduced activation of key temporal-parietal               description, the responses were recorded and scored based on Klin [16] to
                      ToM areas was found in ADHD compared to ASD alone and                            extract (a) the number of words used, (b) the number of errors (vague
                      comorbid ASD + ADHD groups, indicating functional neural deficits                 references, misattributions, irrelevant and inconsistent attributions) and (c)
                      in ADHD. Although behavioural studies in children with ADHD have                 the animation index, which summarises a participant’s ability to socially
                      shown both intact ToM [39, 40] and ToM deficits [41, 42] particularly             attribute meaning to the video. Repeated measures ANOVAs were
                      with regards to understanding emotions [43–45], no neuroimaging                  performed to investigate the behavioural measures (word count, errors,
                      studies have examined ToM in children with ADHD.                                 animation index), with condition (social, random) as the within-subject
                         Thus, the present study is the first to examine the neural                     factor and diagnosis (TD, ASD, ADHD) as the between-subjects factor.
                      mechanisms supporting ToM during the SAT in children with ASD
                      and ADHD, to establish whether these mechanisms differ in                        fMRI voxelwise analyses
                      comparison to their TD peers. Also, importantly, given the overlap               fMRI data were acquired during the SAT and supplemented by a T1-
                      in social-cognitive difficulties in these two NDDs, we wanted to                  weighted structural image for registration (see the Supplementary
                      determine whether they had shared or distinct neural correlates of               Information for further acquisition and preprocessing details). After
                      their challenges with ToM understanding. We hypothesised that                    preprocessing, time-series analyses were performed on each block using
                                                                                                       FMRIB’s Improved Linear Model [50]. The task conditions (social, random,
                      both the ASD and ADHD children would show hypoactivation in                      baseline) were used as explanatory variables and convolved with a
                      ToM brain regions such as the TPJ, temporal and medial frontal                   hemodynamic response function, and the pairwise contrasts of the task
                      cortices, compared with TD children, but these effects would be                  conditions (social vs. baseline, random vs. baseline, social vs. random),
                      more marked in the ASD group.                                                    were examined, controlling for signals from the white matter, cerebrosp-
                                                                                                       inal fluid and six motion parameters. Within each participant, contrasts
                                                                                                       were averaged across blocks using FSL’s FMRI Expert Analysis Tool with
                      MATERIALS AND METHODS                                                            fixed effects. Group-level analyses were performed using FMRIB’s Local
                      Participants                                                                     Analysis of Mixed Effects [51]. The across-group, within-group and
                      Participants were recruited through the Province of Ontario Neurodevelop-        between-group effects of the social vs. random and social help vs. threat
                      mental Disorders (POND) network, and participants who completed the full         contrasts were examined, covarying for age and sex. (Z = 2.3, pcorr < 0.05,
                      imaging protocol between November 2016 and January 2020 were selected            Gaussian Random Field theory familywise error corrected). The main
                      for this study. The cohort included children and adolescents 5–19 years of age   effects of age and diagnosis-by-age interactions were also investigated. For
                      who were either TD (N = 55, 40 males) or received a primary diagnosis based      all analyses, significant clusters were localised using the Automated
                      on expert clinical judgment of ASD (N = 81, 62 males), confirmed with the         Anatomical Labelling (AAL) atlas [52]. Brain–behaviour relations were
                      Autism Diagnostic Observation Schedule-2 [46] and Autism Diagnostic              investigated between each significant cluster identified by a pairwise
                      Interview-Revised [47], or ADHD (N = 88, 68 males), confirmed with the            between-group test and the NEPSY-TM. See Supplementary Information
                      Kiddie Schedule for Affective Disorders and Schizophrenia [48] and Parent        for further details.
                      Interview for Child Symptoms [49]. TD participants with a history of
                      prematurity, neurodevelopmental, psychiatric or neurological diagnoses, or       Data-driven subgrouping
                      who have a first-degree relative with an NDD were not included. Participants      Given the heterogeneity within ASD and ADHD and shared symptomology
                      were not excluded on the presence of comorbidities or usage of psychotropic      across the disorders, a diagnosis-agnostic subgrouping approach was used
                      medication (see Supplemental Tables 1 and 2). Clinical behavioural measures      across the TD, ASD and ADHD participants. For each of the four main
                      were obtained (see Supplemental Information for further details).                effects examined (bidirectional social vs. random, social help vs. social
                                                                                                       threat), the mean subject-level COPE values were extracted across the
                      Social Attribution Task (SAT)                                                    significant voxels for each participant. The four sets of COPE values were
                      The SAT, adapted by Klin et al. [16] and Schultz et al. [24] for neuroimaging,   each regressed against age and sex, and the residuals were z scored and
                      consists of 15 s videos of three shapes in motion, designed to elicit social

                                                                                                                              Translational Psychiatry (2021)11:493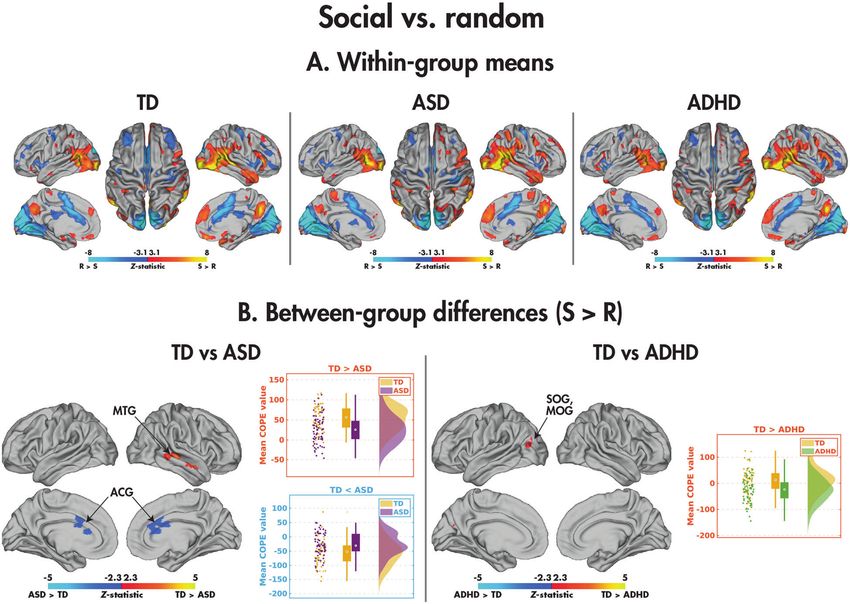
M.M. Vandewouw et al.
                                                                                                                                                                     3
used together as observations in the subgrouping analysis (see                      random videos (F(1,193) = 308.49, p = 8.28 × 10−42); there was no
Supplementary Information).                                                         difference in word count amongst the three diagnostic groups (F
                                                                                    (2,192) = 1.51, p = 0.22) nor a group-by-condition interaction (F
                                                                                    (2,197) = 2.53, p = 0.08). The diagnostic groups differed, however, in
RESULTS                                                                             the number of errors made (F(2,197) = 4.90, p = 0.01); post hoc tests
Participant demographics and behavioural measures                                   revealed that TD made fewer errors than the ASD (p = 0.02) and
From an initial sample of 223 participants, after removing those with               ADHD groups (p = 2.75 × 10⁻³). There was no main effect of social
excessive motion, data from 50 TD, 76 ASD and 74 ADHD children                      vs. random condition (F(2,197) = 0.77, p = 0.38) nor a group-by-
remained (Table 1; see Supplementary Information for statistical                    condition interaction (F(2,197) = 1.02, p = 0.36) on the number of
details on demographics and clinical behavioural measures).                         errors. The animation index was higher to the social compared with
  With the behavioural measures obtained during the video                           random videos (F(1,198) = 582.64, p = 4.61 × 10−60). Although there
descriptions outside the scanner (summarised in Table 2), partici-                  was no main effect of diagnosis (F(2,197) = 1.58, p = 0.21), there was
pants used more words to describe the social compared with                          a group-by-condition interaction (F(2,197) = 3.94, p = 0.02): while
                                                                                    there were no between-group differences in the animation index
                                                                                    when describing the random videos, the ASD participants scored
                                                                                    lower than both the TD (p = 0.02) and ADHD (p = 4.86 × 10⁻³)
 Table 1. Participant demographics and descriptive statistics for the               participants when describing the social videos. Descriptive statistics
 clinical behavioural measures for the TD, ASD, and ADHD participants.              for the accuracy and reaction time to the picture question during
                                                                                    the task are reported in Supplemental Table 3.
                               TD                ASD               ADHD
N                              50                76                74               fMRI analyses
Sex (M:F)                      36:14             58:18             56:18            Main effects of the condition. Across the TD, ASD and ADHD
Mean age (years; ±std.)        12.27 ± 4.19      12.81 ± 3.49      12.23 ± 2.92     groups, there was widespread differential activation of the brain
Mean FD (mm; ±std.)            0.19 ± 0.06       0.21 ± 0.07       0.20 ± 0.07
                                                                                    between the social and random videos (Fig. 2A; Table 3). Activation
                                                                                    was increased to the social compared with random videos in the
Mean FSIQ (±std.)              111 ± 11          97 ± 20           105 ± 13         bilateral inferior and middle occipital gyri, supramarginal gyri and
Mean CBCL-AP (±std.)           55 ± 8            88 ± 9            92 ± 10          temporal poles. Other regions included more extensive activation in
Mean SCQ-TOT (±std.)           2±2               19 ± 7            6±5              the right hemisphere, including the right middle temporal, amygdala,
                                                                                    supramarginal and angular gyrus, and inferior frontal regions.
Mean ABAS-GAC (±std.)          100 ± 14          69 ± 14           83 ± 14
                                                                                    Activation was increased to the random compared with social
Mean NEPSY-TM (±std.)          24 ± 3            21 ± 5            24 ± 3           videos in regions predominantly localised to the medial occipital and
 TD typically developing, ASD autism spectrum disorder, ADHD attention-             cingulate cortices. Contrasting the social help and threat conditions
 deficit/hyperactivity disorder, M male, F female, std standard deviation, FD        (Fig. 2B; Table 3), the social help videos activated the bilateral
 framewise displacement, FSIQ full-scale intelligence quotient, CBCL-AP             superior parietal and precentral gyri, precuneus, and dorsolateral
 Child Behaviour Checklist attention problem subscale, SCQ-TOT Social
                                                                                    superior frontal gyri and left ventromedial occipital regions more
 Communication Questionnaire total scale, ABAS-GAC Adaptive Behaviour
 Assessment System’s General Adaptive Composite score, NEPSY-TM
                                                                                    than social threat videos. In contrast, the threat condition induced
 Developmental Neuropsychological Assessment Theory of Mind                         increased activation in the bilateral medial occipital and inferior
 total score.                                                                       frontal cortices.

 Table 2. Means and standard deviations for the task behavioural measures (word count, number of errors, and animation index) for the TD, ASD, and
 ADHD participants, along with statistical results from repeated-measure ANOVAs examining main effects of the condition, group, and their
 interaction.
                                                                                          TD                             ASD                          ADHD
Word count                              Mean social (±std.)                               28 ± 13                        23 ± 15                      26 ± 13
                                        Mean random (±std.)                               15 ± 9                         13 ± 10                      14 ± 10
                                        Main effect of condition                          *F(1,193) = 308.49, p = 8.28 × 10−42: S > R
                                        Main effect of group                              F(2,192) = 1.51, p = 0.22
                                        Group-by-condition interaction                    F(2,197) = 2.53, p = 0.08
# Errors                                Mean social (±std.)                               0.35 ± 0.36                    0.52 ± 0.46                  0.52 ± 0.40
                                        Mean random (±std.)                               0.27 ± 0.28                    0.47 ± 0.42                  0.56 ± 0.70
                                        Main effect of condition                          F(2,197) = 0.77, p = 0.38
                                        Main effect of group                              *F(2,197) = 4.90, p = 0.01: TD < ASD, ADHD
                                        Group-by-condition interaction                    F(2,197) = 1.02, p = 0.36
Animation index                         Mean social (±std.)                               2.12 ± 0.41                    1.92 ± 0.57                  2.14 ± 0.42
                                        Mean random (±std.)                               1.05 ± 0.42                    1.06 ± 0.50                  1.04 ± 0.46
                                        Main effect of condition                          *F(1,198) = 582.64, p = 4.61 × 10−60: S > R
                                        Main effect of group                              F(2,197) = 1.58, p = 0.21
                                        Group-by-condition interaction                    *F(2,197) = 3.94, p = 0.02: S, ASD < TD, ADHD
 Significant results are highlighted by an asterisk. TD typically developing, ASD autism spectrum disorder, ADHD attention-deficit/hyperactivity disorder, S social,
 R random, std standard deviation.

Translational Psychiatry (2021)11:493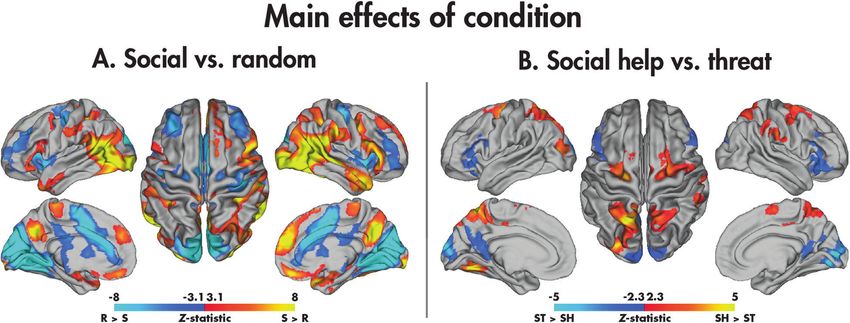
M.M. Vandewouw et al.
4

    Fig. 2 Main effects of the condition in the SAT. Significant (pcorr < 0.05) across-group main effects are shown for the social vs. random (A) and
    social help vs. social threat (B) contrasts.

     Table 3. Brain regions showing significant main effects of condition (across groups) for the social vs. random and social help vs. threat contrasts (Z >
     2.3, pcorr < 0.05).
    Contrast                       Cluster     Nvoxels    pcorr         Max Z     Max Z coordinates            AAL regions
                                                                                  (x, y, z) (mm)
    Social>random                  1           37200      0             12.40     (48, −68, −6)                IOG.R, MTG.R, SMG.R, IFGo.R, ANG.R, MOG.R, HIP.
                                                                                                               R, SFGm.R, REC.L, AMYG.R, TPOm.R
                                   2           14173      7.26−31       11.40     (−26, −94, −4)               IOG.L, SMG.L, MOG.L
                                                                  −15
                                   3           4954       9.51e         6.73      (−22, −6, −20)               TPOm.L
    Random>social                  1           54149      0             14.30     (−12, −94, 22)               CAL.L, CUN.R, HES.R, LING.L, CAL.R, CUN.L, LING.
                                                                                                               R, PUT.R, SOG.L, ACG.L, MCG.R, INS.L, MCG.L, INS.
                                                                                                               R, PUT.L
    Social help>social threat      1           3597       7.23e−12      5.50      (−18, −58, 60)               SPG.L, PCUN.L, SPG.R, MOG.L, SOG.L, PCUN.R
                                   2           1507       3.81e−6       4.09      (28, −6, 52)                 SFGd.R, SMA.R, PreCG.R
                                   3           1169       5.20e−5       5.78      (−26, −68, −16)              FFG.L, LING.L
                                                                  −4
                                   4           1019       1.79e         4.84      (−22, −16, 58)               SFGd.L, PreCG.L
                                   5           532        1.67e−2       3.97      (60, −26, 30)                SMG.R, IPL.R
    Social threat>social help      1           3421       1.94e−11      6.33      (14, −84, 4)                 CAL.R, CUN.L, CUN.R, CAL.L, LING.R, SOG.L,
                                                                                                               PCUN.R, PCUN.L, SOG.R
                                   2           1153       5.91e−5       4.52      (42, 34, −8)                 ORBi.R, IFGt.R, ORBm.R
                                   3           914        4.42e−4       3.90      (−32, 28, 0)                 ORBi.L, IFGt.L, IFGo.L
     Nvoxels Number of voxels, pcorr corrected p value, Z Z-statistic, AAL Automated Anatomical Labelling atlas, TD typically developing, ASD autism spectrum
     disorder, ADHD attention-deficit/hyperactivity disorder, R right, L left, IOG inferior occipital gyrus, MTG middle temporal gyrus, SMG supramarginal gyrus, IFGo
     opercular part of the inferior frontal gyrus, ANG angular gyrus, MOG middle occipital gyrus, HIP hippocampus, SFGm medial superior frontal gyrus, REC gyrus
     rectus, AMYG amygdala, TPOm pole of the middle temporal gyrus, CAL calcarine fissure and surrounding cortex, CUN cuneus, HES Heschl’s gyrus, LING lingual
     gyrus, PUT putamen, SOG superior occipital gyrus, ACG anterior cingulate gyrus, MCG middle cingulate gyrus, INS insula, SPG superior parietal gyrus, PCUN
     precuneus, SFGd dorsolateral superior frontal gyrus, SMA supplemental motor area, PreCG precentral gyrus, FFG fusiform gyrus.

    Between-group differences: social vs. random. Within the TD, ASD                   cingulate gyrus (ACG). Although both groups activated this region
    and ADHD groups (Fig. 3A; Table 4), significant differences                         more to the random than social videos, the effect in the TD
    between the social and random conditions appeared similar.                         participants was more substantial. The TD children also showed
    Pairwise between-group differences were found, however,                            increased activation in the left superior and middle occipital gyri
    between the TD and both the ASD and ADHD participants for                          compared to those with ADHD; whereas the TD activated this
    the social compared to random contrast (Fig. 3B; Table 4). The TD                  region more to the social than random videos, the ADHD showed
    youth demonstrated significantly greater activation in the right                    the reverse pattern. There were no significant group differences
    middle temporal gyrus. The mean COPE values revealed that while                    between the ASD and ADHD youth, nor did any of the identified
    both diagnostic groups recruited this region more when proces-                     clusters in the pairwise comparisons relate to the NEPSY-TM (see
    sing the social than random videos, the TD participants did so to a                Supplemental Table 4). The main effects of age and diagnosis-by-
    greater degree. Comparatively, the TD children showed decreased                    age interactions are presented in Supplemental Tables 5 and 6
    activation compared to the ASD children in the bilateral anterior                  and Supplemental Fig. 1.

                                                                                                              Translational Psychiatry (2021)11:493
M.M. Vandewouw et al.
5
Fig. 3 Comparing the social and random conditions in the SAT. Significant (pcorr < 0.05) within-group effects are shown for the TD, ASD, and
ADHD participants (A), and significant (pcorr < 0.05) between-group effects are shown for the TD vs. ASD and TD vs. ADHD participants (B); no
differences were observed between the ASD and ADHD groups.
Table 4. Brain regions showing significant between-group differences in the social > random contrast (Z > 2.3, pcorr < 0.05).
Contrast Cluster Nvoxels pcorr Max Z Max Z Coordinates (x, y, z) (mm) AAL regions
TD > ASD 1 581 0.01 4.03 (46, −28, −2) MTG.R
TD < ASD 1 548 0.02 3.65 (14, 30, 12) ACG.R, ACG.L
TD > ADHD 1 439 0.048 3.92 (−28, −86, 26) SOG.L, MOG.L
Nvoxels Number of voxels, pcorr corrected p value, Z Z-statistic, AAL Automated Anatomical Labelling atlas, TD typically developing, ASD autism spectrum disorder,
ADHD attention-deficit/hyperactivity disorder, R right, L left, MTG middle temporal gyrus, ACG anterior cingulate gyrus, SOG superior occipital gyrus, MOG
middle occipital gyrus.
Between-group differences: social help vs. social threat. The within- more to the social threat than help condition, whereas the ADHD
group means representing the differences between the social help participants showed the opposite pattern. Finally, a between-
and social threat conditions are presented in Fig. 4A and Table 5, group difference was observed in the NDD children in a cluster
with pairwise group comparisons in Fig. 4B and Table 5. including the right fusiform and parahippocampal gyri: the ASD
Comparing the TD and ASD groups, the TD children activated recruited this region more to the social help compared with social
the bilateral middle cingulate gyri, the right paracentral lobule, threat videos, whereas the ADHD showed no difference. None of
supplementary motor area, supramarginal gyrus and superior the identified clusters in the pairwise comparisons related to the
temporal gyrus more to the social help than social threat NEPSY-TM (see Supplemental Table 4). The main effects of age
condition, whereas the ASD children showed the opposite effect, and diagnosis-by-age interactions are presented in Supplemental
greater activation in these regions to social threat than social help. Tables 5 and 6, and Supplemental Fig. 1.
Group-by-condition interactions were also found between the TD
and ADHD participants; the TD children activated the bilateral Data-driven subgrouping. The consensus similarity matrix was
middle cingulate cortex, right supramarginal and superior constructed from the z scored age and sex-regressed residuals of
temporal gyri more to the social help than social threat videos, the mean COPE values across the four main effects of the
whereas the ADHD participants showed the opposite effect. The condition (pairwise social vs. random and social help vs. social
TD participants also activated the bilateral orbital frontal cortices threat). The eigengap heuristic revealed that the optimal number
Translational Psychiatry (2021)11:493M.M. Vandewouw et al.
6
Fig. 4 Comparing the social help and social threat conditions in the SAT. Significant (pcorr < 0.05) within-group effects are shown for the TD,
ASD, and ADHD participants (A), and significant (pcorr < 0.05) between-group effects are shown for the TD vs. ASD, TD vs. ADHD, and ASD vs.
ADHD participants (B).
Table 5. Brain regions showing significant between-group differences in the social help > social threat contrast (Z > 2.3, pcorr < 0.05).
Contrast Cluster Nvoxels pcorr Max Z Max Z coordinates (x, y, z) (mm) AAL regions
TD > ASD 1 1603 1.91e−6 4.40 (8, −22, 42) PCL.R, MCG.R, MCG.L, SMA.R
2 533 0.02 3.69 (70, −24, 0) SMG.R, STG.R
TD > ADHD 1 1009 1.95e−4 4.57 (2, −4, 34) MCG.R, MCG.L
2 963 2.89e−4 4.40 (58, −10, −8) STG.R, SMG.R, ROL.R
TD < ADHD 1 1057 1.30e−4 4.14 (38, 54, −8) ORBm.R, ORBs.R, ORBi.R
2 568 0.01 4.04 (−36, 40, −12) ORBm.L, ORBi.L
ASD > ADHD 1 985 2.39e−4 3.95 (24, −54, −34) PHG.R, FFG.R
Nvoxels Number of voxels, pcorr corrected p value, Z Z-statistic, AAL Automated Anatomical Labelling atlas, TD typically developing, ASD autism spectrum disorder,
ADHD attention-deficit/hyperactivity disorder, R right, L left, PCL paracentral lobule, MCG middle cingulate gyrus, SMA supplemental motor area, SMG
supramarginal gyrus, STG superior temporal gyrus, ROL rolandic operculum, ORBm orbital part of the middle frontal gyrus, ORBs orbital part of the superior
frontal gyrus, ORBi orbital part of the inferior frontal gyrus, PHG parahippocampal gyrus, FFG fusiform gyrus.
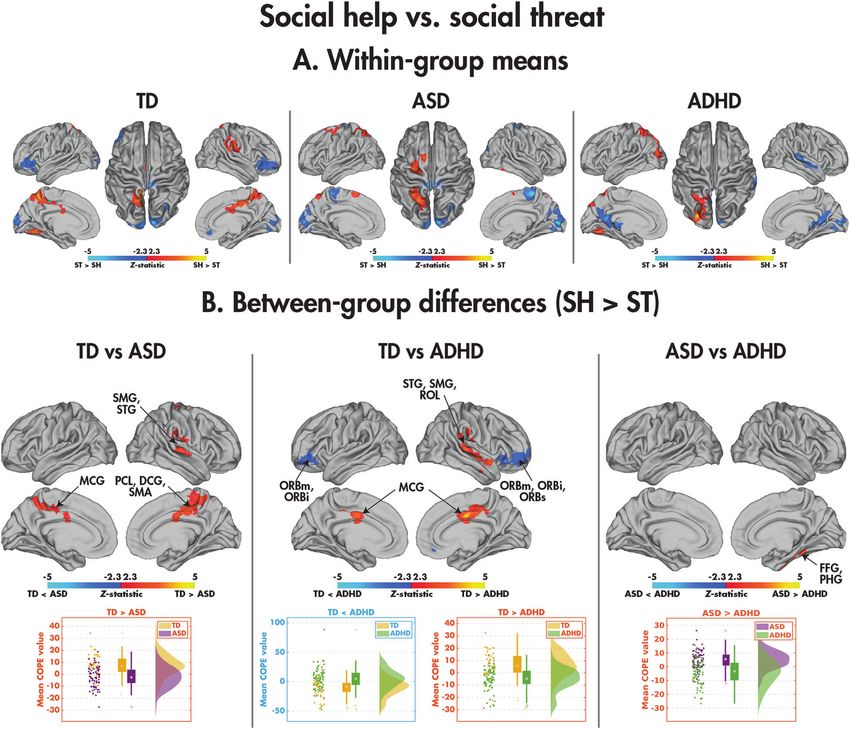
of subgroups was two. The consensus similarity matrix organised the diagnostic groups (top) and subgroups (bottom). Although the
by the diagnostic group is shown in Fig. 5A alongside its diagnostic groups did not differ in any of the observations, the
reorganisation by subgroup membership, highlighting the lack subgroups differed on all four observations (social > random: H(2)
of similarity within the diagnostic groups. Figure 5B shows the = 91.83, p = 9.44e−22; random>social: H(2) = 98.76, p = 2.85e−23;
distribution of the four observations used in the subgrouping in social help>threat: H(2)=36.71, p = 1.37e−9; social threat>help: H
Translational Psychiatry (2021)11:493M.M. Vandewouw et al.
7
Fig. 5 Results of the data-driven subgrouping analysis. The consensus similarity matrix organised by the diagnostic group is shown (A)
alongside its reorganisation by cluster membership, with the distributions (B) of the four observations used in the clustering in the diagnostic
groups (top) and subgroups (bottom). A significant brain–behaviour interaction was found with the NEPSY-TM (C).
(2) = 27.16, p = 1.87e−7). Examining the subgroup means, sub- = 200) = 0.17, p = 0.67). A chi-squared test across all subgroups
group 1 was characterised by increased activity to the social revealed that the proportion of ASD, ADHD and TD participants
compared with random and social help compared with threat, did not differ among the subgroups (χ2(2, N = 200) = 5.11, p =
with subgroup 2 showing the opposite pattern (Fig. 5C). 0.08), although this was trending towards significance, the
The demographic information and descriptive statistics for the majority of TDs belonging to subgroup 1. For clinical measures,
clinical behavioural measures for the data-driven subgroups are those in subgroup 1 were overall better performing. Compared
presented in Table 6. The subgroups did not differ in age (H(2);= with subgroup 2, participants in subgroup 1 had a higher FSIQ (H
0.10, p = 0.75), mean FD (H(2) = 0.76, p = 0.38) or sex ratio (χ2(2, N (2) = 4.41, p = 0.04), and scored lower on the CBCL-AP (H(2) =
Translational Psychiatry (2021)11:493M.M. Vandewouw et al.
8
social videos than the ASD group, whereas the ASD children
Table 6. Participant demographics and descriptive statistics for the
showed greater activity to random than social movement. The
clinical behavioural measures for the data-driven subgroups.
middle temporal gyrus is critical in processing social signals and is
Subgroup 1 Subgroup 2 consistently activated in ToM tasks (see [54] for a review),
N 121 79 including social attribution [21, 31]. Our results extend those of
Ammons and colleagues [31] to children, as they found that TD,
(NASD, NADHD, NTD) (41, 43, 37) (33, 33, 13)
but not ASD adults recruited middle temporal regions during an
Sex (M:F) 92:29 58:21 SAT more to social than random movements; others have also
Mean age (years; ±std.) 12.06 ± 3.48 12.51 ± 3.50 reported right middle temporal atypicalities in ASD related to ToM
Mean FD (mm; ±std.) 0.20 ± 0.07 0.20 ± 0.07 processes [55, 56]. Assaf and colleagues [55] also observed that
children and young adults with ASD engaged the middle temporal
Mean FSIQ (±std.) 106 ± 17 100 ± 16
gyrus less compared to typical controls during mentalizing and
Mean CBCL-AP (±std.) 79 ± 19 86 ± 16 thinking about the intentions of others, supporting an impaired
Mean SCQ-TOT (±std.) 10 ± 9 12 ± 10 ability to establish mental representations of others (i.e., mind
Mean ABAS-GAC (±std.) 83 ± 18 80 ± 19 blindness) in ASD. These data taken together with the present
findings, suggest that those with ASD are not processing social
Mean NEPSY-TM (±std.) 23 ± 4 23 ± 5
movements, a critical factor in understanding social behaviours
TD typically developing, ASD autism spectrum disorder, ADHD attention- and emotions, normally, likely contributing to the deficits seen in
deficit/hyperactivity disorder, M male, F female, std standard deviation, FD these domains in those with ASD.
framewise displacement, FSIQ full-scale intelligence quotient, CBCL-AP
Both the TD and ASD children demonstrated greater recruit-
Child Behaviour Checklist attention problem subscale, SCQ-TOT Social
Communication Questionnaire total scale, ABAS-GAC Adaptive Behaviour ment of the bilateral ACG to random than social videos, with
Assessment System’s General Adaptive Composite score, NEPSY-TM greater differential activation in the TD than ASD participants. The
Developmental Neuropsychological Assessment Theory of Mind ACG has a central role in integrating social information among key
total score. regions of the social brain network [57]. In addition, it is critical for
attending to and tracking “other-oriented information”, which is
crucial for understanding interpersonal perspectives [57]. In
particular, the ACG is engaged when detecting errors in predictive
6.45, p = 0.01). The subgroup did not differ on SCQ-TOT (H(2) = coding (i.e., the discrepancy between expected vs. actual out-
1.95, p = 0.16), ABAS-GAC (H(2) = 1.19, p = 0.27), or NEPSY-TM (H comes) of others’ behaviour [57]. The anterior cingulate is also vital
(2) = 0.06, p = 0.80). for processing information with a high degree of ambiguity or
Finally, we performed the brain–behaviour ANCOVAs on the uncertainty [58]. In the current study, it is possible that viewing the
four observations, with subgroup membership as the factor and random shape animations evoked higher-level predictive errors
NEPSY-TM as the covariate (Supplemental Table 7, Fig. 5C). associated with increased activity in the anterior cingulate gyri in
Subgroup 1 showed a negative relation (F(1,144) = 4.80, p = 0.03) TD children owing to greater uncertainty when deciding whether
between the NEPSY-TM and the Z scored residual from the the shapes were interacting socially or randomly. Of note, the
random> social contrast (R = −0.25, p = 0.02), whereas subgroup random videos in the present study were not mechanical as in
2 showed no relation (R = 0.11, p = 0.42). other papers [22], still requiring some mentalizing to determine
whether the shapes were interacting socially. Thus, reduced
activation of the bilateral ACG to random videos in children with
DISCUSSION ASD suggests less engagement of this region when making
This is the first investigation of the neural mechanisms under- prediction errors and social decision-making relative to their
pinning ToM in the SAT in youth with ASD and ADHD compared typical peers. Atypical processing of social prediction errors when
with their TD peers. Behaviourally, the TD children showed greater tracking expectations of others has also been reported in ASD,
proficiency in describing social and random videos compared with associated with atypical ACG activity [59]. For example, Balsters
those with NDDs, and the TD and NDD children also showed and colleagues [59] observed an absence of ACG activation during
differences in neural activation in social brain areas while social prediction errors in ASD, and ACG activity was shown to be
watching the social videos. The only effect seen between the associated with the severity of social deficits, such that more
ASD and ADHD group was enhanced activity in the ASD compared typical ACG activation was correlated with reduced impairment in
with ADHD individuals in the right fusiform gyrus to social help vs. the ASD group. The authors suggested that engagement of the
threat animations. We discuss these findings in detail below. ACG during social prediction errors is a critical aspect of social
Behaviourally, there was no word count differences across the function in typical development, and the atypical recruitment of
groups, but the TD children made fewer errors when describing this region that we see in the current data would also underpin
the social and random animations than the NDD children. The social impairments in ASD.
animation index, the ability to attribute intentions to the Exciting, novel results were also found when comparing social
interacting shapes, was significantly lower in those with ASD for help and social threat animations, as this analysis is rarely
the social but not random animations compared to the ADHD and completed. The TD children activated the right supramarginal
TD children. Thus, although children with ASD and ADHD both and superior temporal gyri, ToM regions [5, 19, 26, 28, 60, 61],
demonstrated ToM deficits, they were less marked in ADHD. These along with the bilateral middle anterior cingulate, implicated in
findings buttress reports of poor social attribution ability in empathy [62], more to the social help videos, whereas children
children and adolescents with ASD [16, 30, 32], and poorer with NDDs showed greater activation of these regions to social
performance in those with ASD compared to ADHD on social tasks threat. Few studies have specifically examined how the nature of
[12, 13, 53]. social interactions influences the neural mechanisms underpin-
In the neuroimaging analyses, all three groups showed greater ning social attribution. In typical adults, differences in activity in
activation to the social than random videos in classic social brain the right posterior superior temporal sulcus have been reported
regions. However, differences emerged in between-group ana- when shapes engage in competitive vs. cooperative behaviour
lyses: when contrasting social and random videos, the TD children [21, 60, 61] and pro-social behaviour [63], suggesting that this
activated the middle temporal gyrus to a greater extent to the region may be sensitive to the meaning and content of social
interactions. We established that in addition to the right superior
Translational Psychiatry (2021)11:493M.M. Vandewouw et al.
9
temporal area, TD children also preferentially engaged other in their poorer behavioural explanations, as well as atypical
social-cognitive areas when processing animations depicting activation patterns compared to the TD youth.
social help compared with threat, compared to those with NDDs. In conclusion, the present study is the first to investigate the
Although previous work has shown dysfunction of these brain neural mechanisms underlying ToM during the SAT in youth with
areas in adults with ASD and ADHD during ToM processing [38], ASD and ADHD, and their TD peers. We established that TD
we are the first to show that neural activation to different types of children and adolescents demonstrate better behavioural abilities
social interactions (i.e., help or threat) differs from that of typical to attribute social meaning to the social animations compared
controls. All three groups activated social brain regions in the with those with NDDs. Neuroimaging results showed that all three
comparison of social vs. random videos, although group groups engaged classic ToM brain areas during the social
differences emerged, as discussed above. The fact that further compared with random scenarios; however, atypical activation
differences were found, however, between social help and threat of these areas in ASD and ADHD was seen when contrasting social
indicates that those with NDDs are less able to distinguish these and random videos and critically, also depended on the nature of
social behaviours, which would contribute to greater social social attributions.
difficulties for them. This also may be an important difference to
target in behavioural interventions in the future.
Furthermore, in the opposite contrast of social threat vs. social REFERENCES
help, we found that the TD children recruited bilateral orbito- 1. Premack D, Woodruff G. Does the chimpanzee have a theory of mind? Behav
frontal areas more than ADHD participants. The orbitofrontal Brain Sci. 1978;1:515–26.
cortex (OFC) is part of social brain circuitry important for decoding 2. Wellman HM, Cross D, Watson J. Meta-analysis of theory-of-mind development:
the truth about false belief. Child Dev. 2001;72:655–84.
others’ emotional states and is implicated in ToM reasoning [64].
3. Wimmer H, Perner J. Beliefs about beliefs: representation and constraining
The OFC has also been shown in adults to be involved in function of wrong beliefs in young children’s understanding of deception.
processing facial and body expressions of anger, attributing Cognition. 1983;13:103–28.
negative emotions to others, and recognising socially inappropri- 4. Kobayashi C, Glover GH, Temple E. Children’s and adults’ neural bases of verbal
ate conduct [65–67]; our results in the TD group extend this to a and nonverbal ‘theory of mind’. Neuropsychologia. 2007;45:1522–32.
younger age range. Although research examining the neural 5. Ohnishi T, Moriguchi Y, Matsuda H, Mori T, Hirakata M, Imabayashi E, et al. The
mechanisms underlying ToM in ADHD is scarce, it is proposed that neural network for the mirror system and mentalizing in normally developed
atypical OFC function may contribute to deficits in social cognition children: an fMRI study. Neuroreport. 2004;15:1483–7.
[68, 69]. Therefore, our findings of greater activation in the OFC to 6. Frith U, Frith C. The biological basis of social interaction. Curr Dir Psychol Sci.
2001;10:151–5.
social threat than help in TD children strengthens both findings
7. Baron-Cohen SE, Tager-Flusberg HE, Cohen DJJ. (Ed) Cohen D Understanding
delineating the typical function of this cortical area and abnormal other minds: Perspectives from autism. Oxford University Press, 1994 https://doi.
OFC activation in children with ADHD. org/10.1192/s0007125000051552.
Interestingly, the only significant difference between the ASD 8. Uekermann J, Kraemer M, Abdel-Hamid M, Schimmelmann BG, Hebebrand J,
and ADHD groups was seen in the right fusiform gyrus, in the Daum I, et al. Social cognition in attention-deficit hyperactivity disorder (ADHD).
social threat vs. social help contrast. Several social attribution Neurosci Biobehav Rev. 2010;34:734–43.
studies reported enhanced activity in the fusiform gyrus to social 9. Lai M-C, Kassee C, Besney R, Bonato S, Hull L, Mandy W, et al. Prevalence of co-
compared with random shape interactions in typical development occurring mental health diagnoses in the autism population: a systematic review
[19, 22, 24, 26], in ASD and ADHD combined [38], as well as and meta-analysis. Lancet Psychiatry. 2019;6:819–29.
10. Hollingdale J, Woodhouse E, Young S, Fridman A, Mandy W. Autistic Spectrum
reduced activation in ASD compared to controls [28]. Individuals
Disorder symptoms in children and adolescents with Attention-deficit/hyper-
with ASD recruit this region less when interpreting the social activity disorder: a meta-analytical review – Corrigendum. Psychol Med. 2019;
animations and relating them to real-life interactions [24], relative 50:1.
to individuals with ADHD and TD [28], consistent with behavioural 11. Baribeau DA, Doyle-Thomas KA, Dupuis A, Iaboni A, Crosbie J, McGinn H, et al.
findings of greater social-cognitive deficits in ASD relative to Examining and comparing social perception abilities across childhood-onset neu-
ADHD [69]. Although there were clusters that emerged as rodevelopmental disorders. J Am Acad Child Adolesc Psychiatry. 2015;54:479–486.
significant in the TD contrasts with one NDD group that were e1.
not present in the other NDD group, in all cases, the omitted 12. Hutchins TL, Prelock PA, Morris H, Benner J, LaVigne T, Hoza B. Explicit vs. applied
group had a mean COPE value that fell in between the other two theory of mind competence: a comparison of typically developing males, males
with ASD, and males with ADHD. Res Autism Spectr Disord. 2016;21:94–108.
groups (see Supplemental Fig. 2 and Supplemental Table 8).
13. Demurie E, De Corel M, Roeyers H. Empathic accuracy in adolescents with autism
Thus, the overlap between TD, ASD, and ADHD suggests a spectrum disorders and adolescents with attention-deficit/hyperactivity disorder.
continuum from typical to atypical ToM neural processing, whose Res Autism Spectr Disord. 2011;5:126–34.
order critically depends on the brain region. This is also 14. Yang J, Zhou S, Yao S, Su L, McWhinnie C. The relationship between theory of
demonstrated by the subgrouping results, where diagnosis- mind and executive function in a sample of children from mainland China. Child
agnostic analyses showed no group differentiation of the NDDs. Psychiatry Hum Dev. 2009;40:169–82.
The two subgroups were distinguished by behavioural metrics that 15. Heider F, Simmel M. An experimental study of apparent behavior. Am J Psychol.
crossed diagnostic boundaries, with most TDs belonging to the 1944;57:243.
subgroup with higher intelligence and attentional skills. The two 16. Klin A. Attributing social meaning to ambiguous visual stimuli in higher-
functioning Autism and Asperger syndrome: the social attribution task. J Child
subgroups were also characterised by differing brain–behaviour
Psychol Psychiatry Allied Discip. 2000;41:831–46.
relations with ToM ability. This strongly supports taking a trans- 17. Vanderwal T, Hunyadi E, Grupe DW, Connors CM, Schultz RTSelf. mother and
diagnostic approach to studying these populations and consider- abstract other: an fMRI study of reflective social processing. Neuroimage.
ing the NDDs and TDs to be part of the same continuum. 2008;41:1437–46.
The fact that both NDD groups showed activation of the classic 18. Osaka N, Ikeda T, Osaka M. Effect of intentional bias on agency attribution of
ToM brain areas to the social videos even in childhood, is animated motion: an event-related fMRI study. PLoS One. 2012;7:e49053.
encouraging for interventions aimed at improving and strength- 19. Gobbini MI, Koralek AC, Bryan RE, Montgomery KJ, Haxby JV. Two takes on the
ening these social-cognitive abilities. Interventions that reinforce social brain: a comparison of theory of mind tasks. J Cogn Neurosci.
these networks may help reduce the difficulties these groups 2007;19:1803–14.
20. Jack A, Pelphrey KA. Neural correlates of animacy attribution include neocer-
experience. Furthermore, therapies could pay special attention to
ebellum in healthy adults. Cereb Cortex. 2015;25:4240–7.
social help vs. threat learning, as more subtle meaning of social 21. Walbrin J, Downing P, Koldewyn K. Neural responses to visually observed social
interactions is evidently missed by ASD and ADHD youth, reflected interactions. Neuropsychologia. 2018;112:31–9.
Translational Psychiatry (2021)11:493M.M. Vandewouw et al.
10
22. Martin A, Weisberg J. Neural foundations for understanding social and lifetime version (K-SADS-PL): initial reliability and validity data. J Am Acad Child
mechanical concepts. Cogn Neuropsychol. 2003;20:575–87. Adolesc Psychiatry. 1997;36:980–8.
23. Moriguchi Y, Ohnishi T, Mori T, Matsuda H, Komaki G. Changes of brain activity in 49. Ickowicz A, Schachar RJ, Sugarman R, Chen SX, Millette C, Cook L. The parent
the neural substrates for theory of mind during childhood and adolescence. interview for child symptoms: a situation-specific clinical research interview for
Psychiatry Clin Neurosci. 2007;61:355–63. attention-deficit hyperactivity and related disorders. Can J Psychiatry. 2006;
24. Schultz RT, Grelotti DJ, Klin A, Kleinman J, Van der Gaag C, Marois R, et al. The role 51:325–8.
of the fusiform face area in social cognition: Implications for the pathobiology of 50. Woolrich MW, Ripley BD, Brady M, Smith SM. Temporal autocorrelation in uni-
autism. Philos Trans R Soc B Biol Sci. 2003;358:415–27. variate linear modeling of FMRI data. Neuroimage. 2001;14:1370–86.
25. Tavares P, Barnard PJ, Lawrence AD. Emotional complexity and the neural 51. Woolrich MW, Behrens TEJ, Beckmann CF, Jenkinson M, Smith SM. Multilevel
representation of emotion in motion. Soc Cogn Affect Neurosci. 2011;6:98–108. linear modelling for FMRI group analysis using Bayesian inference. Neuroimage.
26. Castelli F, Happé F, Frith U, Frith C. Movement and mind: a functional imaging 2004;21:1732–47.
study of perception and interpretation of complex intentional movement pat- 52. Tzourio-Mazoyer N, Landeau B, Papathanassiou D, Crivello F, Etard O, Delcroix N,
terns. Neuroimage. 2000;12:314–25. et al. Automated anatomical labeling of activations in SPM using a macroscopic
27. Pavlova M, Guerreschi M, Lutzenberger W, Krägeloh-Mann I. Social interaction anatomical parcellation of the MNI MRI single-subject brain. Neuroimage.
revealed by motion: dynamics of neuromagnetic gamma activity. Cereb Cortex. 2002;15:273–89.
2010;20:2361–7. 53. Bühler E, Bachmann C, Goyert H, Heinzel-Gutenbrunner M, Kamp-Becker I. Dif-
28. Autism CastelliF. Asperger syndrome and brain mechanisms for the attribution of ferential diagnosis of autism spectrum disorder and attention deficit hyper-
mental states to animated shapes. Brain. 2002;125:1839–49. activity disorder by means of inhibitory control and ‘theory of mind’. J Autism
29. Fitzpatrick P, Frazier JA, Cochran D, Mitchell T, Coleman C, Schmidt RC. Rela- Dev Disord. 2011;41:1718–26.
tionship between theory of mind, emotion recognition, and social synchrony in 54. Carrington SJ, Bailey AJ. Are there theory of mind regions in the brain? A review
adolescents with and without autism. Front Psychol. 2018;9:1337. of the neuroimaging literature. Hum Brain Mapp 2009;30:2313–35.
30. Abell F, Happé F, Frith U. Do triangles play tricks? Attribution of mental states to 55. Assaf M, Hyatt CJ, Wong CG, Johnson MR, Schultz RT, Hendler T, et al. Mentalizing
animated shapes in normal and abnormal development. Cogn Dev. 2000; and motivation neural function during social interactions in autism spectrum
15:1–16. disorders. NeuroImage Clin. 2013;3:321–31.
31. Ammons CJ, Doss CF, Bala D, Kana RK. Brain responses underlying anthro- 56. Cheng W, Rolls ET, Gu H, Zhang J, Feng J. Autism: Reduced connectivity between
pomorphism, agency, and social attribution in autism spectrum disorder. Open cortical areas involved in face expression, theory of mind, and the sense of self.
Neuroimag J. 2018;12:16–29. Brain. 2015;138:1382–93.
32. Klin A, Jones W. Attributing social and physical meaning to ambiguous visual 57. Apps MAJ, Rushworth MFS, Chang SWC. The anterior cingulate gyrus and social
displays in individuals with higher-functioning autism spectrum disorders. Brain cognition: tracking the motivation of others. Neuron. 2016;90:692–707.
Cogn. 2006;61:40–53. 58. Diaconescu AO, Mathys C, Weber L, Kasper L, Mauer J, Stephan KE. Hierarchical
33. Kim E, Kyeong S, Cheon K-A, Park B, Oh M-K, Chun JW, et al. Neural responses to prediction errors in midbrain and septum during social learning. Soc Cogn Affect
affective and cognitive theory of mind in children and adolescents with autism Neurosci. 2017;12:618–34.
spectrum disorder. Neurosci Lett. 2016. https://doi.org/10.1016/j. 59. Balsters JH, Apps MA, Bolis D, Lehner R, Gallagher L, Wenderoth N. Disrupted
neulet.2016.04.026. prediction errors index social deficits in autism spectrum disorder. Brain.
34. White SJ, Frith U, Rellecke J, Al-Noor Z, Gilbert SJ. Autistic adolescents show 2017;140:235–46.
atypical activation of the brain’s mentalizing system even without a prior history 60. Isik L, Koldewyn K, Beeler D, Kanwisher N. Perceiving social interactions in the
of mentalizing problems. Neuropsychologia. 2014. https://doi.org/10.1016/j. posterior superior temporal sulcus. Proc Natl Acad Sci USA. 2017;114:9145.
neuropsychologia.2013.12.013. 61. Tavares P, Lawrence AD, Barnard PJ. Paying attention to social meaning: an fMRI
35. O’Nions E, Sebastian CL, McCrory E, Chantiluke K, Happé F, Viding E. Neural bases study. Cereb Cortex. 2008;18:1876–85.
of Theory of Mind in children with autism spectrum disorders and children with 62. Dong D, Ming Q, Wang X, Yu W, Jiang Y, Wu Q, et al. Temporoparietal junction
conduct problems and callous-unemotional traits. Dev Sci. 2014. https://doi.org/ hypoactivity during pain-related empathy processing in adolescents with con-
10.1111/desc.12167. duct disorder. Front Psychol. 2017;7:2085.
36. Kana RK, Patriquin MA, Black BS, Channell MM, Wicker B. Altered medial frontal 63. Tashjian SM, Weissman DG, Guyer AE, Galván A. Neural response to prosocial
and superior temporal response to implicit processing of emotions in autism. scenes relates to subsequent giving behavior in adolescents: a pilot study. Cogn
Autism Res. 2016;9:55–66. Affect Behav Neurosci. 2018;18:342–352.
37. Moessnang C, et al. Social brain activation during mentalizing in a large autism 64. Sabbagh MA. Understanding orbitofrontal contributions to theory-of-mind rea-
cohort: the Longitudinal European Autism Project. Mol Autism. 2020;11. https:// soning: implications for autism. Brain Cogn. 2004;55:209–19.
doi.org/10.1186/s13229-020-0317-x. 65. Blair RJR, Cipolotti L. Impaired social response reversal. A case of ‘acquired
38. Ilzarbe D, Lukito S, Moessnang C, Daly OO. Neural correlates of theory of mind in sociopathy’. Brain. 2000;123:1122–41.
autism spectrum disorder, attention-deficit/hyperactivity disorder, and the comorbid 66. Murphy FC, Nimmo-Smith I, Lawrence AD. Functional neuroanatomy of emotions:
condition. Front Psychiatry 2020;11. https://doi.org/10.3389/fpsyt.2020.544482. a meta-analysis. Cogn Affect Behav Neurosci. 2003;3:207–33.
39. Happé F, Frith U. Theory of mind and social impairment in children with conduct 67. Pichon S, de Gelder B, Grèzes J. Two different faces of threat. Comparing the
disorder. Br J Dev Psychol. 1996;14:385–98. neural systems for recognizing fear and anger in dynamic body expressions.
40. Perner J, Kain W, Barchfeld P. Executive control and higher-order theory of mind Neuroimage. 2009;47:1873–83.
in children at risk of ADHD. Infant Child Dev. 2002;11:141–58. 68. Lukito S, Norman L, Carlisi C, Radua J, Hart H, Simonoff E, et al. Comparative meta-
41. Caillies S, Bertot V, Motte J, Raynaud C, Abely M. Social cognition in ADHD: irony analyses of brain structural and functional abnormalities during cognitive control
understanding and recursive theory of mind. Res Dev Disabil. 2014;35:3191–8. in attention-deficit/hyperactivity disorder and autism spectrum disorder. Psychol
42. Sodian B, Hülsken C, Thoermer C. The self and action in theory of mind research. Med. 2020;50:894–919.
In: Consciousness and Cognition. 2003, pp 777–782. 69. Bora E, Pantelis C. Meta-analysis of social cognition in attention-deficit/hyper-
43. Braaten EB, Rosén LA. Self-regulation of affect in attention deficit-hyperactivity activity disorder (ADHD): comparison with healthy controls and autistic spectrum
disorder (ADHD) and non-ADHD boys: Differences in empathic responding. J disorder. Psychol Med. 2016;46:699–716.
Consult Clin Psychol. 2000;68:313–21.
44. Dyck MJ, Ferguson K, Shochet IM. Do autism spectrum disorders differ from each
other and from non-spectrum disorders on emotion recognition tests? Eur Child
Adolesc Psychiatry. 2001;10:105–16. ACKNOWLEDGEMENTS
45. Downs A, Smith T. Emotional understanding, cooperation, and social behavior in We would like to thank all participants and their families for their involvement in this
high-functioning children with autism. J Autism Dev Disord. 2004;34:625–35. study. We would also like to thank Kathrina de Villa, Ruth Weiss and Tammy Rayner
46. Lord C, Rutter M, DiLavore PC, Risi S, Gotham K, Bishop S. Autism Diagnostic for their invaluable assistance in data collection. Funding was provided by the
Observation Schedule, Second Edition (ADOS-2) Manual (Part I): Modules 1–4. Ontario Brain Institute (IDS-I l-02).
Western Psychological Services: Torrance, CA, 2012.
47. Lord C, Rutter M, Le Couteur A. Autism diagnostic interview-revised: a revised
version of a diagnostic interview for caregivers of individuals with possible
AUTHOR CONTRIBUTIONS
pervasive developmental disorders. J Autism Dev Disord. 1994;24:659–85.
M.M. Vandewouw performed the data analysis and contributed to writing the
48. Kaufman J, Birmaher B, Brent D, Rao U, Flynn C, Moreci P, et al. Schedule for
manuscript. K. Safar contributed to writing the manuscript. S.I. Mossad assisted in
affective disorders and schizophrenia for school-age children-present and
developing the task and edited the manuscript. J.Lu collected the behavioural data. J.
Translational Psychiatry (2021)11:493M.M. Vandewouw et al.
11
P. Lerch, E. Anagnostou and M.J. Taylor conceived this study and contributed to reprints
editing the manuscript. E. Anagnostou also provided funding for the project, and M.J.
Taylor provided project supervision and contributed to draughting the manuscript. Publisher’s note Springer Nature remains neutral with regard to jurisdictional claims
in published maps and institutional affiliations.
COMPETING INTERESTS
E. Anagnostou has served as a consultant to Roche and Quadrant Therapeutics, has
received consultation fees from Roche, holds a patent for the device, “Anxiety Meter”,
and has received in-kind support from AMO pharma, royalties from APPI and Open Access This article is licensed under a Creative Commons
Springer, and editorial honoraria from Wiley. The remaining authors (M.M. Attribution 4.0 International License, which permits use, sharing,
Vandewouw, K. Safar, S.I. Mossad, J. Lu, J.P. Lerch and M.J. Taylor) have reported adaptation, distribution and reproduction in any medium or format, as long as you give
no biomedical financial interests or potential conflicts of interest. appropriate credit to the original author(s) and the source, provide a link to the Creative
Commons license, and indicate if changes were made. The images or other third party
material in this article are included in the article’s Creative Commons license, unless
indicated otherwise in a credit line to the material. If material is not included in the
ADDITIONAL INFORMATION
article’s Creative Commons license and your intended use is not permitted by statutory
Supplementary information The online version contains supplementary material regulation or exceeds the permitted use, you will need to obtain permission directly
available at https://doi.org/10.1038/s41398-021-01625-y. from the copyright holder. To view a copy of this license, visit http://creativecommons.
org/licenses/by/4.0/.
Correspondence and requests for materials should be addressed to Marlee M.
Vandewouw.
© The Author(s) 2021
Reprints and permission information is available at http://www.nature.com/
Translational Psychiatry (2021)11:493You can also read