Allegro: Analyzing expression and sequence in concert to discover regulatory programs
←
→
Page content transcription
If your browser does not render page correctly, please read the page content below
Nucleic Acids Research Advance Access published January 16, 2009
                                                                                                            Nucleic Acids Research, 2009, 1–14
                                                                                                                       doi:10.1093/nar/gkn1064

Allegro: Analyzing expression and sequence
in concert to discover regulatory programs
Yonit Halperin, Chaim Linhart, Igor Ulitsky and Ron Shamir*
School of Computer Science, Tel Aviv University, Tel Aviv 69978, Israel

Received November 10, 2008; Revised and Accepted December 16, 2008

ABSTRACT                                                                        in various environmental conditions, biological samples
                                                                                and time-points (henceforth we use the term condition
A major goal of system biology is the characteriza-                             to refer to each microarray assay). The purpose of this
tion of transcription factors and microRNAs                                     analysis is to identify groups of genes that are co-regu-
(miRNAs) and the transcriptional programs they reg-                             lated, also termed transcriptional modules (TMs), and
ulate. We present Allegro, a method for de-novo dis-                            to characterize their regulators. A two-step approach is
covery of cis-regulatory transcriptional programs                               most commonly used [see examples in (1,2) and the
through joint analysis of genome-wide expression                                review in (3)]: In the first step, a clustering procedure is
data and promoter or 3’ UTR sequences. The algo-                                executed to partition the genes into groups believed to be
rithm uses a novel log-likelihood-based, non-                                   co-regulated, based on expression profile similarity (4).
parametric model to describe the expression pat-                                In the second step, a motif discovery tool is applied to
tern shared by a group of co-regulated genes. We                                search for abundant sequence patterns in the promoters
                                                                                (or 30 UTRs) of each group that may represent the binding
show that Allegro is more accurate and sensitive
                                                                                sites (BSs) of TFs (or miRNAs) that regulate the corre-
than existing techniques, and can simultaneously
                                                                                sponding genes.
analyze multiple expression datasets with more                                     Despite extensive research, motif discovery has had lim-
than 100 conditions. We apply Allegro on datasets                               ited success due to the short and degenerate nature of BSs,
from several species and report on the transcrip-                               and the high levels of complexity of transcriptional net-
tional modules it uncovers. Our analysis reveals                                works, especially in metazoans. Since both the expression
a novel motif over-represented in the promoters                                 profiles and the promoter sequences of the genes carry
of genes highly expressed in murine oocytes, and                                information regarding their regulation, a methodology
several new motifs related to fly development.                                  that utilizes both sources of information may give better
Finally, using stem-cell expression profiles, we iden-                          results than the two-step approach. Several studies pro-
tify three miRNA families with pivotal roles in                                 posed computational schemes for this parallel analysis.
human embryogenesis.                                                            Most of these algorithms use a unified probabilistic
                                                                                model over both gene expression and sequence data, and
                                                                                assume a Gaussian distribution of the expression values
                                                                                (5–7). Additional examples are the algorithms Reduce (8)
INTRODUCTION
                                                                                and Motif Regressor (9), which search for motifs corre-
One of the main challenges in molecular biology is                              lated with a single condition using linear regression, and
to understand the regulatory program that controls                              assume that the number of BSs and their affinity are lin-
mRNA levels. The key components of this program are                             early correlated with the gene’s expression. The algorithm
transcription factors (TFs), proteins that activate or                          DRIM (10) uses the hypergeometric (HG) score to com-
repress transcription of a gene by binding to short DNA                         pute the enrichment of motif occurrences among the top-
sequences, termed transcription factor binding sites                            ranked genes. However, it too is limited to a single
(TFBSs), which usually reside in the gene’s promoter.                           condition.
The level of translated mRNA of a gene can also be                                 Here we present Allegro (A Log-Likelihood based
decreased post-transcriptionally, through annealing of                          Engine for Gene expression Regulatory motifs Over-
microRNAs (miRNAs) to the 30 UTR of the mRNA.                                   representation discovery), a de-novo motif discovery plat-
A key step in reverse engineering regulatory networks is                        form for simultaneously detecting gene sets with coherent
computational analysis of genome-wide measurements                              expression profiles and corresponding over-represented
of mRNA levels obtained from DNA microarray assays                              sequence patterns. A graphic overview of the Allegro

*To whom correspondence should be addressed. Tel: +972 3 640 5383; Fax: +972 3 640 5384; Email: rshamir@post.tau.ac.il

The authors wish it to be known that, in their opinion, the first two authors should be regarded as joint First Authors.

ß 2009 The Author(s)
This is an Open Access article distributed under the terms of the Creative Commons Attribution Non-Commercial License (http://creativecommons.org/licenses/
by-nc/2.0/uk/) which permits unrestricted non-commercial use, distribution, and reproduction in any medium, provided the original work is properly cited.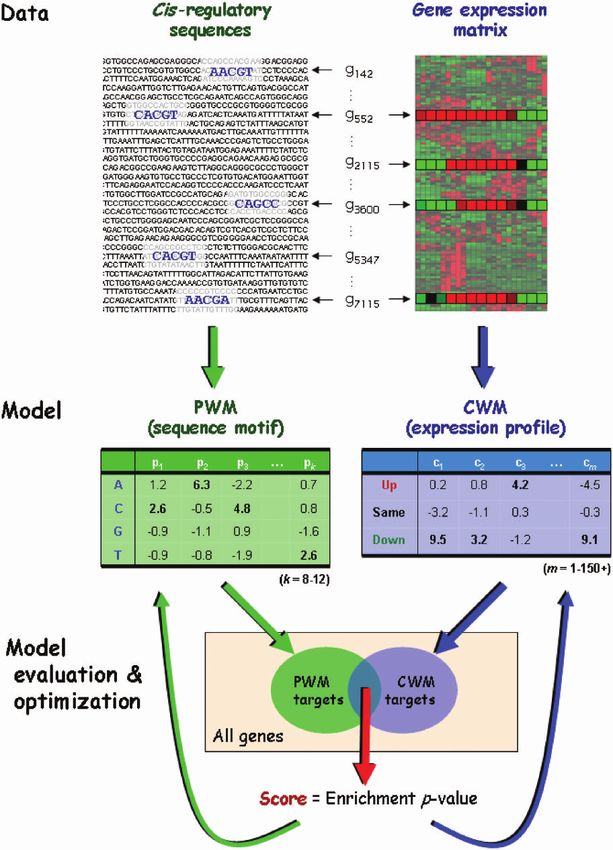
2 Nucleic Acids Research, 2009

Figure 1. Overview of the Allegro computational approach. Given a genome-wide expression matrix and cis-regulatory sequences (promoters or 30
UTRs), Allegro executes efficient algorithms and statistical analyses to search for transcriptional modules. A transcriptional module is a set of genes
sharing a sequence motif, modeled using a PWM, and a common expression profile described using a novel model called CWM. The CWM is
analogous to the PWM: it assigns a weight to each discrete expression level in each of the experimental conditions. Allegro uses a multi-phase motif
enumeration engine to generate candidate motifs. For each motif, it applies a cross-validation-like procedure to construct a CWM (Supplementary
Figure 2), such that there is a significantly large overlap between the targets of the motif (the set of genes whose cis-regulatory sequence has an
occurrence of the PWM, left arrows at the top) and the targets of the CWM (the genes whose expression levels match the CWM, right arrows). The
statistical significance of this overlap is evaluated using one of two enrichment scores: the HG score or the binned enrichment score, which accounts
for biases in the length and GC-content of the cis-regulatory sequences. The scores obtained by the motifs and their CWMs are iteratively modified
to improve the models and eventually converge to high-scoring transcriptional modules.

approach is presented in Figure 1. Unlike existing meth-                     motif discovery software platform we recently developed
ods, which rely on statistical assumptions, Allegro uses a                   called Amadeus (11). In brief, given a set of co-regulated
novel non-parametric model called Condition Weight                           genes, Amadeus searches for motifs that are over-repre-
Matrix (CWM) to describe the expression profile of a                          sented in their cis-regulatory sequences with respect to
group of co-regulated genes. We show that this model                         (w.r.t.) the rest of the cis-regulatory sequences in the
represents the expression profiles of sets of co-regulated                    genome or some other background (BG) set (see
genes more accurately than do commonly used expression                       Supplementary Data for additional information).
metrics and statistical distributions. Allegro builds upon a                 Allegro utilizes the efficient motif search engine of
Nucleic Acids Research, 2009 3

Amadeus to enumerate a huge number of candidate motifs          material of (14). The values in the data are log2 of
and to converge to high-scoring ones. For each candidate        the fold change w.r.t. wild-type (WT) grown on YPD
motif, Allegro fits a CWM to its putative targets using a        medium at standard osmolarity.
cross-validation-like     procedure.     In      order     to      The human cell-cycle dataset was obtained from the sup-
ascertain whether the motif and the CWM are significantly        porting web-site of (15) (http://genome-www.stanford.edu/
correlated, Allegro computes one of two enrichment              Human-CellCycle/HeLa). Expression values are log2 of the
scores: the HG score or the binned enrichment score             fold change w.r.t. asynchronously grown HeLa cells.
(11). As we demonstrate, the latter is very useful in cases        Human and mouse tissue expression datasets were
where the expression profiles are correlated to the length       downloaded from the GNF SymAtlas web-site (http://
and GC-content of the cis-regulatory sequences. Such            symatlas.gnf.org/SymAtlas, version 1.2.4, gcRMA-ana-
expression-sequence dependencies are ignored by most            lzyed) (16). We applied quantile normalization (17), as
existing methods, leading to many false predictions.            implemented in Expander (18), in order to rescale the
   To test the performance of our method and highlight its      expression values in each tissue to a common distribution.
unique features and advantages over existing approaches,        We then normalized the values of each gene by computing
we applied Allegro on several large-scale datasets from         the log2 of the fold change w.r.t. the gene’s average expres-
yeast, fly, mouse and human. In all cases, Allegro success-      sion value.
fully recovered binding motifs of TFs and miRNAs that              The human stem cells dataset is the stem cell matrix
are known to regulate the relevant processes, together with     described in (19) (GEO accession number GSE11508).
their corresponding expression profiles. In addition, we         After averaging technical replicates, this dataset contains
report on novel transcriptional modules discovered by           124 samples. The full list of cell types used appears in
Allegro in datasets of human and murine tissues, and in         Supplementary Table V. The expression pattern of each
Drosophila tissues profiled during various stages of devel-      gene was normalized to mean 0 and SD 1.
opment. For example, we discovered a novel motif that is           The datasets analyzed in this study are summarized in
over-represented in the promoters of genes that are highly      Supplementary Table I. See Supplementary Data for addi-
induced in oocytes and fertilized eggs. Application of          tional details.
Allegro to expression profiles of human stem cell lines
highlighted three miRNA families as key players in regu-        CWM for a motif target set
lation of cell fate in embryogenesis. The miRNA activities      Denote by B the set of genes in the expression data, and
predicted based on these findings are in good agreement          let eg(1), . . . , eg(m) denote the discrete expression levels
with evidence from recent miRNA expression studies.             (DELs) of gene g 2 B (81  j  m, eg(j) 2 {e1, . . . , el}). The
A comparison of our results with those obtained by              background condition frequency matrix (CFM), R = {ri,j},
several current methods for clustering and motif finding         holds the frequencies of the DELs in each condition across
indicates that Allegro is more sensitive and accurate. We       all genes: ri,j = |{g 2 B | eg(j) = ei}|/|B|. For a candidate
also demonstrate additional important advantages of our         motif M, denote by T its target set, i.e. the group of genes
approach, including joint analysis of multiple expression       whose cis-regulatory sequences contain an occurrence of
datasets from several organisms, and accounting for cor-        M. As described in the Results section, Allegro samples a
relations between the expression levels of genes and the        training set S from T, and constructs a CFM F = { fi, j}
length and GC-content of their cis-regulatory sequences.        based on the DELs of the genes in S: fi,j = |{g 2 S |
We believe that Allegro introduces significant novel ideas       eg(j) = ei}|/|S|. The training-set sampling procedure is
in computational motif finding and gene expression ana-          described in the Supplementary Data. Allegro then calcu-
lysis. On the practical side, our software can serve as an      lates the CWM, which contains the log-ratios between
accurate, feature-rich, user-friendly tool for the biological   F and R:
community.
                                                                                                            fi, j
                                                                81  i  l,1  j  m CWMði, jÞ ¼ log
                                                                                                           ri, j
METHODS
                                                                Allegro uses the CWM to compute the log-likelihood ratio
Genomic sequences and binding patterns                          (LLR) score of every gene, as explained below.
Promoter sequences (repeat- and coding-sequence-
masked) of human, mouse and fly, and 30 UTR sequences            LLR score computation
(repeat-masked) of human were extracted from Ensembl            Given the background CFM, R = {ri,j}, and a CFM,
(12). Yeast promoters were downloaded from SGD (http://         F = {fi,j}, learnt from the target set of a candidate motif,
www.yeastgenome.org). Motifs reported by Allegro were           Allegro computes the LLR score of all the genes, as
compared to known binding patterns of TFs and miRNAs            described in the Results section. The naı̈ve computation
taken from Transfac (13) and miRBase (http://microrna.          takes O(|B||C|) time, where B is the set of genes and C is
sanger.ac.uk/sequences), respectively. See Supplementary        the set of conditions. Different genes may share the same
Data for more details.                                          discrete pattern, so the time complexity can be improved
                                                                to O(|P||C|), where P is the set of distinct discrete expres-
Gene expression datasets
                                                                sion patterns observed in the dataset. For example, in
The expression dataset for the yeast osmotic-stress             the tissues dataset (16) there are 14 698 human genes
response was downloaded from the supplementary                  but only 2112 distinct expression patterns, so the above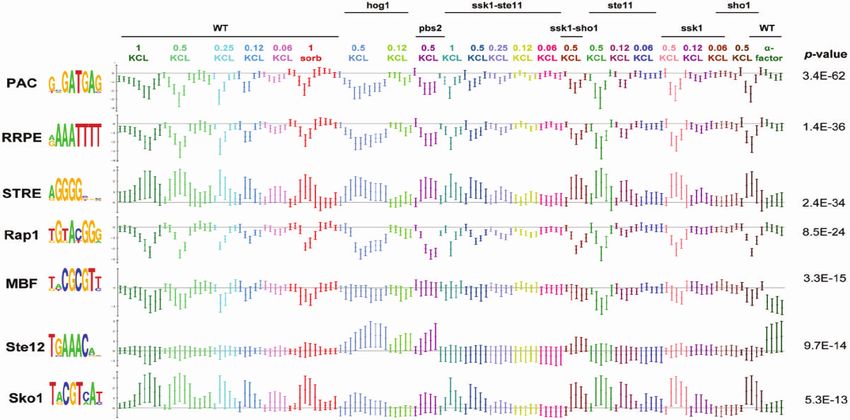
4 Nucleic Acids Research, 2009

observation gives a 7-fold speedup in this case. Another             drawn randomly, independently and without replacement
running time improvement is achieved by reducing the                 from Bs:
average number of operations per discrete pattern in the                                                                 jbjjBs jjbj
LLR computation, as follows. In a preprocessing proce-                                                         X
                                                                                                            minðjWj;jbjÞ
                                                                                                                           i    jWji
dure we build a complete weighted graph, GP, in which the            HG score ¼ HGtailðjBs j;jWj;jbj;jwjÞ ¼
                                                                                                                                jBs j
nodes correspond to the patterns in P, and the weight of                                                            i¼jwj       jWj
an edge is the Hamming distance between the two corre-
sponding patterns. We then find a minimum spanning tree               The second score, called the binned enrichment score,
(MST) of GP, denoted TP. In order to compute the LLR                 accounts for cases where the expression values are corre-
score of all the patterns in P, we scan TP in preorder, and          lated with the length or GC-content of the cis-regulatory
use the LLR score of each pattern as a basis for computing           sequences. In short, the genes are divided into bins accord-
the scores of its child nodes. Formally, let v = (ev(1), . . . ,     ing to the length and GC-content of their cis-regulatory
ev(|C|)) be a discrete expression pattern. If v is the root of       sequence. The counts of the number of genes in each bin
TP, the LLR is calculated naı̈vely, as described in the              that passed the LLR cutoff and the number of genes with
Results. Otherwise, let u = (eu(1), . . . , eu(|C|)) be the parent   a hit in their sequence are used in order to estimate the
of v in TP, then:                                                    overall enrichment. For exact details, see (11).

                   X  fvð j Þ, j
                                            fuð j Þ, j
                                                                   Clustering and motif-finding tools
LLPðvÞ ¼ LLRðuÞ þ     log             log                           K-means (20) and CLICK (21) were executed using the
                  j2D
                          rvð j Þ, j        ruð j Þ, j
                          uv                                         Expander gene expression analysis software (18). K-means
                                                                     was run twice—with k = 10, and with k = 20. CLICK was
where Duv is the set of conditions, in which the DELs in u           run with the ‘homogeneity’ parameter set to 0.3. Two
and v differ (|Duv| is the Hamming distance between u and             motif-finding tools, Weeder and Amadeus, were applied
v). Note that since TP is scanned in preorder, LLR(u) is             on all clusters found by K-means and CLICK, excluding
calculated before LLR(v), as required. In preprocess, we             huge clusters with more than 900 genes. Weeder (v1.3) was
compute a table that contains the value log(fi,j/                    executed with the ‘medium T100 S’ parameters and using
ri,j)  log(fk,j/rk,j) for every pair of DELs, ei and ek, and        the BG model files supplied with the software (22).
every condition cj. Using this table, LLR(v) can be calcu-           Amadeus (v1.0) was run with its default settings (11).
lated given LLR(u) in time c|Duv|, where, c is a very small
constant. Thus, the total time complexity of computing               GO functional analysis
the LLR score of all patterns is O(|P|d + |C|), where d             For each motif discovered by Allegro in the tissues data-
is the average Hamming distance in the MST (the second               sets, we ran the TANGO algorithm via the Expander soft-
summand, |C|, is the time for the LLR computation of the             ware (18) to test whether the CWM targets of the motif
root). In the human tissues dataset mentioned above, there           are enriched for Gene Ontology biological process terms.
are 79 tissues, but the average distance in TP is only 1.31.         TANGO performs a bootstrapping procedure to correct
Thus, using the MST gives a further 59-fold time                     the enrichment p-values for multiple testing and account
improvement.                                                         for the large overlaps between related GO terms. All
                                                                     results reported here obtained a p-value less than 109
                                                                     and a corrected p-value less than 103.
Enrichment scores
For each candidate motif, we use a subset S of its target
genes (ST) as a training set for learning a CWM, as                 RESULTS
described in the Results section. The set of all other               We developed a novel method, called Allegro, for simul-
genes in the expression data, denoted Bs (Bs = B\S), is              taneous de novo discovery of regulatory sequence motifs
used for evaluating the fit between the CWM and the                   and the expression profiles they induce in one or more
motif, as follows. Let W (W  Bs) be the set of genes,               genome-wide gene expression datasets. Given a candidate
whose expression pattern obtained an LLR score higher                motif, Allegro learns an expression model that describes
than the current CWM cutoff (Allegro tries several cut-               the shared expression profile of the genes, whose cis-regu-
offs), excluding the training-set genes. Denote by b and w            latory sequence contains the motif. It then computes a p-
the subset of genes from Bs and from W, respectively, that           value for the over-representation of the motif within the
contain at least one occurrence of the motif in their cis-           cis-regulatory sequences of the genes that best fit the
regulatory sequence, i.e. b = Bs \ T and w = W \ T.                  expression profile. We implemented Allegro and inte-
Allegro computes one of two supported enrichment                     grated it with our Amadeus motif discovery platform.
scores, as specified by the user, to assess whether                   Amadeus executes a series of refinement phases to con-
the motif is over-represented in W, i.e. whether w is                verge to high-scoring motifs. Each phase receives as
significantly larger than expected, given Bs, W and b.                input a list of candidate motifs, applies an algorithm for
The first score, called the HG enrichment score,                      refining the list, and produces a set of improved candidates
uses the HG tail distribution to compute the probability             that constitute the starting point for the next phase. The
of observing at least |w| sequences in W with a motif                output of Amadeus is a non-redundant list of top-scoring
hit, under the null hypothesis that the genes in W were              motifs, modeled using position weight matrices (PWMs).
Nucleic Acids Research, 2009 5
Additional scoring functions and features available in score of g is the logarithm of the ratio between the prob-
Amadeus are described in (11). In the current study, ability of observing these expression levels under the
motifs in each phase are evaluated using Allegro. assumption that gene g belongs to T, and the probability
Thus, the motifs reported by the algorithm are those of observing them under the null hypothesis:
that possess the highest correlation to the expression
X m
fgð j Þ, j
data in terms of the aforementioned p-value. LLRðexpression of gene gÞ ¼ log
In the following sections we introduce the expression j¼1
rgð j Þ; j
model used by Allegro and demonstrate its advantages
over commonly used approaches. We then describe the The l m matrix whose entries are log(fi,j/ri,j) is called the
algorithm Allegro applies to ascribe a p-value for a CWM. The CWM can be used to classify genes as belong-
given motif. Finally, we present results of applying ing to the transcriptional module T in the standard way:
Allegro to several large-scale expression datasets repre- for a given threshold h, a gene is considered to belong to T
senting a diverse set of biological systems and species, if its LLR score is above h. In a sense, the CWM repre-
and compare them to those obtained by existing tools. sents an expression motif similarly to the standard
sequence motif representation using a PWM. In the next
Modeling the expression profile of co-regulated genes section we explain how the CWM and the threshold h are
computed for a putative transcriptional module.
We developed a new method for modeling the expression We tested how well the CWM model identifies the
profile shared by a group of co-regulated genes. Unlike expression profile of known transcriptional modules, and
existing approaches, it does not make complex statistical compared its performance to that of popular expression
assumptions about the distribution of the expression metrics: Pearson correlation, Spearman’s rank correlation,
values in each condition. Furthermore, unlike expression and Euclidean distance (4). The results show that in most
similarity measures employed by clustering techniques, cases (16 out of 18) our model describes the expression
our model is robust against extreme values and can profile of TMs more accurately than existing approaches
describe profiles that differ across a very small number (Supplementary Table II). The experimental procedure
of conditions. The model is analogous to the PWM and results are detailed in the Supplementary Data.
model for sequence motifs (23,24), with DNA bases sub-
stituted here by discrete expression levels, and the posi-
Learning the expression profile induced by a motif
tions along the motif replaced by the experimental
conditions. For each candidate motif, Allegro tries to learn a CWM
Given continuous expression values, Allegro first trans- that describes the expression of (some of) its targets. If the
forms them into discrete expression levels (DELs, in short): motif represents BSs of a TF that is active in the measured
e1, e2, . . . , el. The number of expression levels (l) and the conditions, Allegro will likely find a CWM that is charac-
range of values that define each one are set by the user. teristic of the motif’s targets; otherwise, the expression
For example, if the expression values are given in log2 values of the target genes are expected to behave like the
ratios w.r.t. some base condition, then one may use BG distribution, and no such CWM will be found. Let T
three DELs, as illustrated in Supplementary Figure 1: denote the set of genes whose cis-regulatory sequences
Expression values above 1.0 are replaced by e1 (or ‘U’, contain at least one occurrence, or hit, of the motif M.
for ‘Up-regulated’), values between 1.0 and 1.0 are Allegro finds a CWM that models the expression profile of
replaced by e2 (or ‘S’, for ‘Similar to base condition’) T by executing a cross-validation-like procedure, illu-
and values below 1.0 are replaced by e3 (or ‘D’, for strated in Supplementary Figure 2. First, it samples a
‘Down-regulated’). The DELs may also be defined using training set from T and generates a CFM F based on
percentiles rather than cutoffs. the frequencies of DELs in that training set. A CWM is
Let c1, c2, . . . , cm be the set of m conditions in the given computed from F and from the background CFM, as
expression matrix. The expression model assigns to each explained earlier (see Methods section). Then, for all
condition a discrete probability distribution. Define an l x genes excluding those in the training set, it computes the
m matrix, called condition frequency matrix (CFM), in LLR score described above. In order to ascertain that the
which column j holds the distribution of the DELs in con- motif M is over-represented in the genes with a high LLR
dition cj according to the model. Hence, the value in row i score (i.e. genes whose expression is more similar to the
and column j is the probability of generating expression profile represented by F than to the background CFM),
level ei in condition cj (Supplementary Figure 1). The Allegro computes one of two enrichment scores developed
background CFM, R = {ri,j}, is computed from the in Amadeus: the HG score and the binned enrichment
observed DELs of all given genes; i.e. ri,j is the BG fre- score. The latter accounts for biases in the length and
quency of expression level ei in condition cj (see Methods nucleotide composition of the regulatory sequences (see
section). Methods section). Note that the training-set genes are
Given another CFM F = {fi,j}, which models the ignored when computing the enrichment score in order
expression levels of a transcriptional module T, we to avoid over-fitting. The enrichment score is computed
would like to assign to each gene a score that quantifies for several LLR cutoffs and the best one is chosen and
its similarity to F. To this end, we use the standard like- Bonferroni-corrected for multiple testing. Allegro repeats
lihood ratio approach, as follows. Let eg(j) (1 j m) this process for several training sets, which are sampled in
denote the DEL of gene g in condition cj. The LLR a judicious procedure that takes into account both the6 Nucleic Acids Research, 2009
expression and sequence data (see Supplementary Data). Comparison to the two-step approach: yeast HOG pathway
Finally, Allegro chooses the CWM that yielded the best The Saccharomyces cerevisiae high osmolarity glycerol
enrichment score, and this score is set as the p-value of the (HOG) pathway is required for osmoadaptation. It con-
motif. We use the term CWM targets to refer to the genes tains two branches that activate the protein Hog1 via
that passed the LLR cutoff of the top-scoring CWM. For Pbs2, one containing Ssk1 and the other containing
an arbitrary motif, only a relatively small fraction of the Sho1 and Ste11. O’Rourke et al. characterized the roles
CWM targets are also targets of the motif (i.e. contain a of Hog1, Pbs2, Ssk1, Sho1 and Ste11 in response to ele-
hit for the PWM in their cis-regulatory sequence), vated osmolarity using whole-genome expression profiling
whereas, for a biologically relevant motif, the overlap (14). The expression data contain osmotic shock profiles
between the set of its PWM targets and the set of its of the WT strain, and of mutant strains in which compo-
CWM targets is significantly large (in the sense of the nents of the HOG pathway were knocked-out. The pro-
enrichment score). files were monitored at different levels of hyper-osmolarity
As described earlier, Allegro examines a large number at several time points. In addition, the transcriptional
of candidate motifs in a series of refinement phases. The response of the WT strain to the mating pheromone
motifs in each phase are ranked according to the above a-factor was measured at four time points. Overall, the
enrichment score. We implemented sophisticated data- dataset consists of expression values of 5758 genes in
structures and algorithms in order to speed-up the 133 conditions.
CWM learning procedure (see Methods section). The The seven top-scoring motifs reported by Allegro for
output of the Allegro algorithm is a list of transcriptional this dataset are the RRPE, PAC and STRE (stress
modules, each one comprised of a sequence motif (PWM) response element) motifs, and the BS patterns of Rap1,
and an expression profile (CWM) that are highly corre- MBF, Ste12 and Sko1 (Figure 3). Remarkably, all seven
lated in terms of the genes they match. motifs are related to osmotic shock (30–33). For example,
Msn2 and Msn4 mediate a general stress response through
binding to STRE (31,34), and they are also controlled by
Test case: human cell cycle Hog1 (33). Indeed, the CWM targets of STRE are up-
regulated in the time series of exposure to high osmolarity.
Whitfield et al. studied cell-cycle regulation using cDNA Another example, which provides further evidence of the
microarrays that measured gene expression profiles of sensitivity of our approach, is Sko1, one of the main TFs
HeLa cells over five time courses (15). In each time that control the specific response to hyper-osmolarity (33).
course, the cells were synchronized to the same cell-cycle Under normal conditions, Sko1 recruits the general
phase by one of three different methods. In order to iden- repressor complex Tup1–Ssn6 and together they act to
tify cell-cycle genes and the phases in which they are active, repress their target genes. After osmotic shock, Hog1
Whitfield et al. quantified the periodicity of the expression phosphorylates Sko1, resulting in decreased affinity for
levels of each gene using Fourier transform, and compared Tup1, and Sko1 then activates transcription by an
it to that of known cell-cycle genes. Several studies utilized unknown mechanism. Reassuringly, Allegro uncovered
their findings to analyze the transcriptional programs the Sko1 binding motif, and its CWM targets are consid-
underlying the cell-cycle phases (25–28). erably up-regulated in response to high osmolarity only in
In order to test the ability of our method to uncover strains in which Hog1 and Pbs2 were not knocked out. See
transcriptional modules ab initio from a large mammalian Supplementary Data for additional analysis of the results.
dataset, we applied it to the cell-cycle data of Whitfield We applied the standard two-step approach to the
et al. The input to Allegro consisted of expression values HOG dataset to check whether the transcriptional mod-
across 111 time points and of 1200 bps-long promoter ules discovered by Allegro can also be found using existing
sequences of 15 000 genes. Consistent with biological techniques. We first performed clustering using three
knowledge and previous studies, the three top-scoring methods—k-means with k = 10 and k = 20 (20), and the
motifs found by Allegro are the BS patterns of E2F and CLICK algorithm (21), which resulted in 38 clusters. Four
NF-Y (CCAAT-box), and the motif termed CHR (cell- of these clusters were huge (>900 genes, i.e. >20% of the
cycle genes homology region), whose binding protein is entire gene set) and did not exhibit an interesting expres-
yet to be discovered (29) (see Supplementary Data for sion profile, so we ignored them. We then executed two
information on how the motifs are matched to known motif finding tools on each of the 34 remaining clusters:
BS patterns). As shown in Figure 2, the expression Weeder (22), which out-performed 13 other tools in a
of the CWM targets of E2F peaks in the G1/S phase, large-scale assessment (35), and Amadeus, our recently
whereas genes associated with NF-Y and CHR are published software (11). Following (11,35), from each
active in the G2 and M phases. Importantly, these such execution we examined the two top-scoring motifs
results were obtained by analyzing the expression and reported by the motif finder. We thus examined a total
sequence data alone, without using any prior knowledge of 68 motifs discovered by the clustering and motif-finding
on periodicity of human cell-cycle or on known phase- pipeline. As listed in Table 1, out of the seven motifs
specific genes. Allegro discovered, only four were found by the two-
An additional test case on expression data of the step approach—RRPE, PAC, MBF and STRE. We also
innate immune response in mouse is described in the applied the clustering and motif-finding tools developed
Supplementary Data. by Slonim et al., Iclust (36) and FIRE (37). Again, onlyNucleic Acids Research, 2009 7
Figure 2. Results of Allegro on the human cell cycle dataset (15). (A) Screenshot of Allegro. The left panel presents the input parameters: organism,
expression data file, scores, etc. The top-scoring motifs discovered by Allegro are shown in the output panel on the right. Additional information is
displayed for each motif, such as the average expression profile of the CWM targets that contain a hit of the motif, statistics on the number of hits
and their locations, similar binding patterns from Transfac or miRBase, and more. Here, the three top-scoring motifs reported by Allegro represent
the BS patterns of key regulators of the human cell cycle: E2F, CHR (whose binding TF is unknown), and NF-Y (not shown). (B) Expression
profiles of the five CWM targets with the highest LLR score of the three motifs found by Allegro. High and low expression values w.r.t. time 0 are
colored in red and green, respectively. The purple bars represent S phase and the blue vertical lines indicate mitoses, as reported in (15). In agreement
with biological knowledge and previous computational analyses (25–28,50), E2F induces genes mainly in the G1/S phase, whereas CHR and NF-Y
are highly specific to the G2 and G2/M phases.
four out of the seven motifs Allegro recovered were Analysis of multiple datasets: tissue-specific regulators
reported by FIRE. Specifically, the BS motifs of Sko1
A unique feature of Allegro is simultaneous analysis of
and Ste12 were found by Allegro but not by any other
multiple datasets from one or more species. Given several
method.
We could not compare Allegro to other published meth- expression matrices and corresponding sequence data,
ods that infer motifs by simultaneous analysis of sequence Allegro explores the motif search space as described
and expression data (5–7), either because they are not above. For each candidate motif, it computes its enrich-
publicly available or we could not execute them and ment score in each of the datasets separately; i.e. it finds a
obtain reasonable results. CWM whose top-scoring genes have a significantly large8 Nucleic Acids Research, 2009
Figure 3. Results of Allegro on the yeast HOG pathway expression dataset (14). Allegro finds the motifs PAC, RRPE, STRE and the binding
patterns of Rap1, MBF, Ste12 and Sko1. Each motif is presented together with the average expression profile ( 1 SD) of its CWM targets which
contain a hit for the motif in their promoter. The titles above the expression series indicate the yeast strain the expression was sampled from: WT,
and knockout strains [indicated by the name(s) of the gene(s) that were knocked-out]. The concentrations of KCL and sorbitol are given in molar
units.
Table 1. Results of Allegro and existing tools on the yeast HOG MAPK dataset (14)
Biological process Motif/TF Reference K-means/CLICK Iclust Allegro
Amadeus/Weeder FIRE
General stress response RRPE (31,72) + + +
PAC (31,72) + + +
Rap1 (31) + +
HOG and pheromone response pathways Sko1 (32,33) +
Ste12 (30,33) +
MBF (33,73,74) + +
Smp1 (32)
Skn7 (32)
General stress response and HOG pathway STRE (31–33) + + +
There are nine TFs and motifs known to be involved in the regulation of genes in the studied conditions. In a single execution, Allegro successfully
recovered seven of these binding patterns as the seven top-scoring motifs. In contrast, only four motifs were discovered when the two-step approach
was applied using various combinations of existing clustering and motif discovery tools.
overlap with the genes that contain the motif in their cis- (Supplementary Figure 3). Indeed, CREB is known to
regulatory sequence. Allegro then combines these scores activate transcription of genes essential for proper germ
into a single p-value using the Z-transform (38). cell differentiation (39), and its disruption in mice severely
We tested this feature on the human and mouse gene impairs spermatogenesis (40,41). Allegro reported four
atlas (16) in search of tissue-specific regulators. Given the additional testis-specific motifs: RFX, MYB and two
expression levels of 15 000 human and mouse genes novel motifs (motifs 2–5 in Table 2). Members of the
across 79 human tissues and 61 mouse tissues, Allegro RFX and MYB families are expressed at high levels in
found known and novel motifs. The main results are sum- the testis (42–46). Interestingly, all three known testis-
marized in Table 2. The motifs reported by Allegro are related TF families—CREB, RFX and MYB—have
non-redundant: for every pair of reported motifs—M1 and testis-specific gene products (42,46,47). We performed
M2—no more than 5% of their hits overlap, i.e. 95% of functional analysis on the sets of CWM targets of the
the occurrences of M1 do not overlap any occurrence of motifs found by Allegro in order to identify GO terms
M2, and vice versa. Thus, each reported motif is likely to over-represented in these sets (see Methods section).
represent a biologically distinct binding pattern. Reassuringly, the CWM targets of all five testis-related
The top-scoring motif is the binding pattern of CREB/ motifs in both species are highly enriched for
ATF, and its target genes are up-regulated in testis tissues spermatogenesis.Nucleic Acids Research, 2009 9
Table 2. Main results of Allegro for the combined analysis of the human and mouse tissue gene atlas datasets (16)
Logo TF/motif p-value Tissues Gene Ontology (BP; CC)
1 CREB/ATF 10–32 Testis: Testis, testis germ cell, Spermato-genesis; Flagellum
–24 testis interstitial, testis Leydig
2 RFX 10 cell, testis seminiferous tubule
3 – 10–23
4 MYB 10–21
5 – 10–15
6 MEF2 10–29 Muscle: Heart, skeletal muscle, Muscle contraction; Myofibril
tongue
7 ETS/ELF 10–27 Immune system: Peripheral blood Immune response; Plasma
cells, B/T-cells, lymphnode, membrane
BM myeloid, thymus
8 IRF 10–15
9 E2F 10–23 Proliferating cells: Oocyte, Cell cycle, DNA replication;
–13 embryo, bone marrow, thymus, Chromosome
10 NF-Y 10 lymphoblasts, cancers
11 NRF1 10–14
12 HNF1 10–22 Digestive tract: Liver, kidney, Metabolism (carboxylic acid, lipid,
pancreas, intestine amine, . . . ); Mitochondrion
13 HNF4 10–21
14 – 10–18 Keratinocytes: Epidermis, Epidermis development,
tongue, digits keratinization; Intermediate
filament cytoskeleton
15 AP1/FOS 10–16
16 T-box 10–15
17 TATA 10–14
18 – 10–14 Oocyte: Oocyte, fertilized egg Cell cycle; Nucleus
The table lists all motifs with p-value 1015 (combined score for human and mouse datasets), as well as several motifs with high similarity to
known binding patterns (TATA, Nrf-1 and NF-Y). Three of the motifs are apparently novel. In addition, a novel motif that obtained a significant
p-value (1014) only in the mouse dataset is listed. Similar known binding patterns from the Transfac database are shown in the ‘TF/Motif’ column.
The ‘Tissues’ column lists the tissues in which the target genes of each motif are up-regulated. Some tissues were sampled in only one of the two
organisms. The ‘Gene Ontology’ column specifies the most enriched biological process (BP) and cellular component (CC) GO terms in the CWM
targets of each motif.
p-value, tissues and GO terms for motif #18 are based only on the mouse dataset; oocyte and fertilized egg were not sampled in human.
Additional known TF-tissue associations recovered by see also Supplementary Figure 6). Oocytes are not among
Allegro include MEF2, whose target genes are induced in the tested tissues in human, so we do not know whether
heart, skeletal muscle and tongue (48) (Supplementary this enrichment is conserved. A partial list of the putative
Figure 4); HNF1 and HNF4, which induce genes in targets of the motif is given in Supplementary Table III.
liver, and, to a lesser extent, in kidney, pancreas and intes- To further test the ability of Allegro to simultaneously
tine (49) (Supplementary Figure 5); and the cell-cycle reg- analyze multiple expression datasets, we applied it on
ulators E2F, NF-Y and NRF1, whose targets are up- three datasets that recorded expression levels of fly
regulated in various types of proliferating cells (Drosophila melanogaster) genes during various develop-
(25,27,50,51). We also found four motifs whose targets mental stages (54–56) (see Supplementary Data). Allegro
are up-regulated in the epidermis and related tissues, discovered known and novel motifs associated with vari-
such as tongue and digits: the AP1/FOS-binding pattern, ous developmental profiles. The 20 top-scoring motifs are
T-box, TATA and a novel motif (motifs 14–17 in Table 2). listed in Supplementary Table IV. Of note, this list
There is evidence of the involvement of FOS and TBP includes the top seven core promoter motifs found by
(TATA binding protein) in the regulation of keratinocyte Ohler (57), indicating that core promoter cis-regulatory
proliferation (52,53). elements play an important role in fly development.
Allegro discovered a novel motif whose target genes are Another interesting example is the TAGteam motif,
highly induced in murine oocytes (motif #18 in Table 2, which was recently identified and shown experimentally10 Nucleic Acids Research, 2009
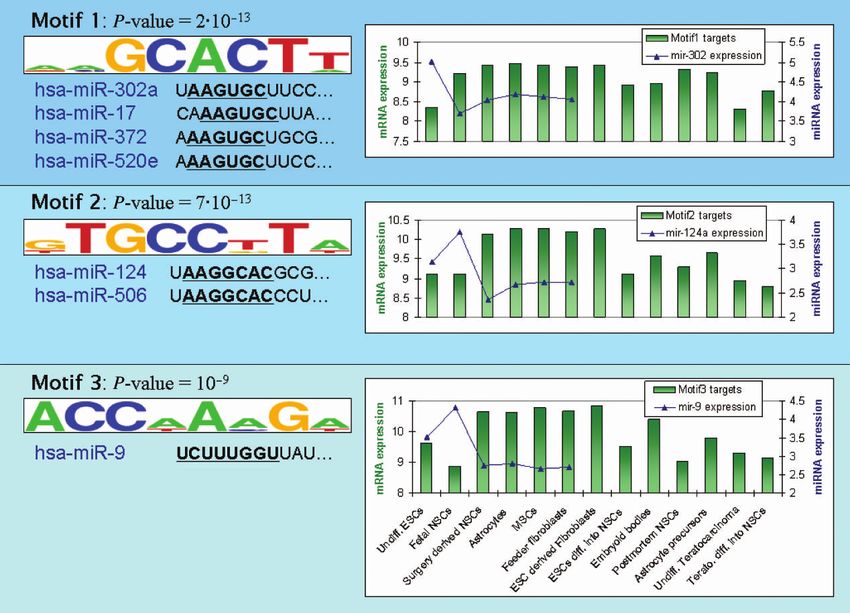
Figure 4. The top three 30 UTR motifs identified in the stem cells dataset (19). On the left, the motif p-value and logo are presented along with the
first 11 bases (starting from the 50 base of the mature microRNA) of miRNAs with a seed that matches the reverse complement of the motif. For the
first motif, only one miRNA from each of the four matching miRNA families is presented. For each motif, the graph on the right shows the average
expression values (in log2 scale) of the corresponding CWM targets that contain a hit for the motif. Each bar represents the average expression level
in one of the cell types (ESCs/NSCs/MSCs—embryonic/neural/mesenchymal stem cells; ‘Undiff.’—Undifferentiated, ‘diff.’—differentiated, ‘Terato.’—
Teratocarcinoma; see also Supplementary Table V; the full expression profile of targets of motif 1 in all 124 samples is shown in Supplementary
Figure 9). The graph also shows the expression levels (in log2 scale) of the matching miRNA(s): mir-302 for motif 1 (average expression over all mir-
302 family members), mir-124 for motif 2 and mir-9 for motif 3. miRNA expression levels are presented only for the cell types profiled in (63).
Evidently, the expression profiles of the motif targets and those of the matching miRNAs are anti-correlated, increasing our confidence that the
discovered motifs represent miRNAs that are active in the relevant cells.
to induce early zygotic genes (58,59). Allegro recovered shorter than those of genes expressed in other cell types
this motif and the expression profile it induces (61). In contrast, genes specific to the nervous system are
(Supplementary Figure 7). known to have particularly long UTRs (62). This leads to
an almost 2-fold difference in 30 UTR length between
3’ UTR analysis: human stem cells genes up-regulated in undifferentiated ESCs and genes
Stem cells, and in particular embryonic stem cells (ESCs), up-regulated in fetal neural stem cells (NSCs)
have a unique ability to differentiate into diverse cell types. (Supplementary Figure 8).
This multipotency (or pluripotency in case of ESCs) is We applied Allegro to search for enriched motifs in the
maintained by a variety of epigenetic mechanisms, includ- 30 UTRs of the Mueller et al. dataset. Due to the biases
ing DNA methylation, chromatin modifications and mentioned above, we used the binned enrichment score to
miRNAs (60). Analysis of sequence motifs in 30 UTRs compute the over-representation of each candidate motif
of genes up- or down-regulated in various types of stem in the set of CWM targets fitted to it. The results are
cells carries the promise of identifying key miRNAs main- presented in Figure 4. The top-scoring motif (GCACTT)
taining the stem cell differentiation capabilities. Mueller is the reverse complement of the hexamer AAGTGC,
et al. (19) profiled gene expression in 124 cell samples, which appears in the seed sequences of several miRNA
including a variety of stem cells. The analysis of 30 UTR families (mir-17, mir-302, mir-290 and mir-515), all of
motifs in this large dataset is hindered by biases in 30 UTR which are among the most highly expressed miRNAs in
length and base composition (Supplementary Table V). human and mouse ESCs (63,64). Indeed, genes reported
For example, proliferating cells, such as ESCs, are by Allegro as putative targets of these miRNA families are
known to express genes with 30 UTRs that are much evidently down-regulated in human ESCs compared toNucleic Acids Research, 2009 11
other cell types (Figure 4). Interestingly, as shown in most clustering metrics and existing algorithms for com-
Supplementary Figure 9, these genes are also down-regu- bined sequence-expression analysis, it does not assume a
lated in a subset of NSCs, which were differentiated from Gaussian distribution of the expression values. Instead,
ESCs or from teratocarcinoma, indicating that it is possi- Allegro utilizes the cis-regulatory sequences and expres-
ble that the expression of these miRNA families is not sion values of all the analyzed genes (typically, the entire
down-regulated immediately upon differentiation. genome) as a reference set against which to evaluate the
The second most significant motif reported by Allegro is statistical significance of the overlap between each
GTGCCTT, which corresponds to the seeds of mir-506 sequence motif and the expression profile fitted to its
and mir-124a. Inspection of the expression pattern of the targets.
CWM targets (Figure 4) shows that genes carrying this Another major contribution of the current study is the
motif are generally down-regulated in less differentiated CWM, a novel non-parametric model for describing the
cells (ESCs, NSCs, embryoid bodies and teratocarcinoma) common expression profile of a group of co-regulated
compared to more differentiated ones [mesenchymal stem genes. The model gives a likelihood ratio to the group
cells (MSCs), fibroblasts and astrocytes]. Mir-506 did not using discrete expression levels. It makes no assumptions
show any differential expression between ESCs, NSCs and about the type of distribution of the expression values,
differentiated cells (63), and was not detected in any tissue and is robust against extreme values. Unlike similarity
in a recent comprehensive sequencing effort (62); thus, it is metrics, a CWM can describe an expression profile that
not likely to be the regulator of this gene set. Mir-124a is differs from the background expression levels across a very
known to be abundant and functional in the neural cell small number of conditions (even a single condition), and
lineage (65), and is up-regulated in NSCs compared to can, in effect, assign a different weight (i.e. contribution)
MSCs and fibroblasts (63). However, it is also up-regu- to each condition. Furthermore, a CWM can model more
lated in NSCs compared to ESCs (63), while the expres- complex transcriptional patterns than existing methods.
sion levels of the CWM targets do not appear to differ For example, it can describe the effect of a TF that
between these two cell types. It is possible, therefore, activates some genes and suppresses others in the same
that the regulation of the CWM targets is carried out by conditions [e.g. Oct4 and Nanog (67)]. As we demon-
mir-124a alongside other regulatory mechanisms that may strated for experimentally derived TF target sets and
or may not involve miRNAs. for functionally related annotated groups of genes, the
The third motif reported by Allegro (ACCAAAG) CWM captures their distinct expression profiles more
matches the seed of mir-9. The expression pattern of its accurately than commonly used metrics (Supplementary
targets shows down-regulation in NSCs compared to dif- Table II). A detailed discussion on the shortcomings of
ferentiated cells, with intermediate levels in ESCs and in existing expression similarity measures is given in the
teratocarcinoma. Mir-9 is expressed specifically in the Supplementary Data. While in this study we used the
neural lineage (62,63) and is known to have an active CWM in the context of motif finding, it can be applied
role in neurogenesis (66). in other gene expression analysis tasks, such as functional
Neither the standard two-step approach (clustering with analysis (i.e. identifying GO terms whose genes exhibit a
k-means or CLICK, followed by motif finding using distinct expression profile).
Weeder or Amadeus), nor Allegro with the HG enrich- We applied Allegro to several large-scale gene expres-
ment score, recovered the above three motifs. This empha- sion datasets in human, mouse, fly and yeast. Our results
sizes the importance of accounting for sequence biases indicate that in a single run, and without any prior knowl-
when conducting cis-regulatory motif finding. edge of known binding patterns or the characteristics of
the transcriptional modules (e.g. the number of modules,
their size and the overlap between them), Allegro success-
DISCUSSION fully recovers the correct TF/miRNA motifs and reports
them as the top-scoring motifs. The transcriptional mod-
In this work we present Allegro, a software platform that ules found by Allegro are highly heterogeneous in terms of
analyzes genomic sequences and expression datasets to their expression profiles. For example, the cell-cycle reg-
infer transcriptional modules—groups of genes that are ulators induce very subtle and noisy cyclic patterns in the
co-expressed along all or some of the experimental condi- human cell cycle dataset. The yeast HOG pathway data-
tions and share an enriched regulatory motif in their pro- set, on the other hand, consists of diverse time-series
moters or 30 UTRs. This single-step methodology, which experiments, and, accordingly, the relevant TFs induce
infers transcriptional modules by simultaneously analyz- distinct complex expression profiles, some of which differ
ing the sequence and expression data, utilizes all available from the BG distribution in only a small fraction of the
information throughout the entire analysis, giving it a conditions.
clear advantage over the standard two-step approach. One of the unique features of Allegro is joint analysis of
Allegro employs a powerful motif enumeration engine multiple expression datasets. Unlike some comparative
and our CWM model to discover sequence motifs and analysis techniques, Allegro does not search for conserved
their associated expression profiles without relying on motifs within aligned promoter sequences, since the con-
pre-defined types of distribution to model the sequence servation of TFBSs is, in many cases, very limited across
and expression data. Unlike the vast majority of motif- species (68–70). Instead, for each candidate motif it exam-
finding tools, Allegro does not rely on pre-computed ines, Allegro utilizes the information from all supplied
k-mer counts to construct a sequence model; and, unlike datasets by combining the scores the motif attained on12 Nucleic Acids Research, 2009
them into a single p-value, thus improving the accuracy of or 30 UTR sequences and multiple genome-wide expres-
the analysis. We demonstrated this feature on the human sion datasets from several species and combine all avail-
and mouse tissues datasets (16), in which Allegro found 18 able information for optimal results. Running time on a
distinct motifs in various tissue types (Table 2). Notably, standard PC is between a few minutes and several hours,
some of the tissue-specific motifs obtained borderline p- depending primarily on the size of the expression data. We
values in one or both species. Many of these motifs were developed a user-friendly graphical interface, making
not reported by Allegro when it was applied on each data- Allegro accessible to a wide range of users. In order to
set separately (data not shown), underscoring the impor- help the user understand the results of the analysis,
tance of combined analysis of multiple datasets for Allegro’s graphical interface displays additional informa-
increased sensitivity. For example, E2F received a tion and statistics on each reported motif, such as the
p-value of 4 1011 in the human data, which is within scores it attained, its putative targets and their expression
the range of random scores given the huge number of profile, similar known motifs from Transfac/miRBase,
candidate motifs considered by the algorithm; the com- and more. The Allegro software (a standalone Java appli-
bined human–mouse p-value of 1023 is statistically sig- cation) is available at http://acgt.cs.tau.ac.il/allegro.
nificant. Perhaps this, together with the binned score, is
why other methods failed to recover some of the well-
known TF-tissue associations. Two cases in point: SUPPLEMENTARY DATA
Elemento et al. applied their Iclust and FIRE tools on
the human and mouse datasets separately, and did not Supplementary Data are available at NAR Online.
discover CREB/ATF, RFX, MEF2, IRF, HNF1 and
HNF4 (37). When Xie et al. searched for conserved pro-
moter elements and tested whether they were tissue-speci- FUNDING
fic (71), they failed to find many of the known TF-tissue This work was supported in part by the Israel Science
associations such as HNF1 and HNF4 in liver, and E2F in Foundation (grant 802/08 and Converging Technologies
proliferating cells. In addition to known TFs, Allegro Program grant 1767.07). Igor Ulitsky was supported in
reported novel motifs that attained statistically significant part by a fellowship from the Edmond J. Safra
scores. Experiments are required to verify and study their Bioinformatics program at Tel Aviv University. Funding
regulatory roles. Additional novel motifs were discovered for open access charge: ISF 802/08 and 1767.07.
by Allegro in fly promoters using three expression datasets
of Drosophila developmental stages (Supplementary Conflict of interest statement. None declared.
Table IV).
Our analysis of the stem cells dataset demonstrates the
ability of Allegro to reverse-engineer transcriptional pro- REFERENCES
grams regulated by miRNAs. Using the binned enrich-
1. Spellman,P.T., Sherlock,G., Zhang,M.Q., Iyer,V.R., Anders,K.,
ment score, Allegro was able to overcome the two main Eisen,M.B., Brown,P.O., Botstein,D. and Futcher,B. (1998)
obstacles in 30 UTR sequence analysis: length heterogene- Comprehensive identification of cell cycle-regulated genes of the
ity and GC-content bias. The three top-scoring motifs yeast Saccharomyces cerevisiae by microarray hybridization. Mol.
identified by Allegro correspond to three miRNA families, Biol. Cell, 9, 3273–3297.
indicating that these families are among the main post- 2. Tavazoie,S., Hughes,J.D., Campbell,M.J., Cho,R.J. and
Church,G.M. (1999) Systematic determination of genetic network
transcriptional regulators in ESCs and NSCs. In particu- architecture. Nat. Genet., 22, 281–285.
lar, the top-scoring motif corresponds to a miRNA seed 3. Wyrick,J.J. and Young,R.A. (2002) Deciphering gene expression
sequence that was recently shown to be highly dominant regulatory networks. Curr. Opin. Genet. Dev., 12, 130–136.
in human and mouse ESCs (63,64). The results of Allegro 4. Jiang,D., Tang,C. and Zhang,A. (2004) Cluster analysis for gene
further highlight the importance of the miRNA families expression data: a survey. IEEE Trans. Knowl. Data Eng., 16,
1370–1386.
carrying this seed sequence in ESC biology. Finally, we 5. Holmes,I. and Bruno,W.J. (2000) Finding regulatory elements using
show evidence of activity of miRNA carrying this seed joint likelihoods for sequence and expression profile data. Proc. Int.
sequence in several NSC lines for which miRNA expres- Conf. Intell. Syst. Mol. Biol., 8, 202–210.
sion profiles are not available. Technologies to accurately 6. Segal,E., Yelensky,R. and Koller,D. (2003) Genome-wide discovery
of transcriptional modules from DNA sequence and gene expres-
measure miRNA expression levels are maturing, but are
sion. Bioinformatics, 19(Suppl. 1), i273–i282.
still inferior in fidelity to mRNA profiling. As we have 7. Reiss,D.J., Baliga,N.S. and Bonneau,R. (2006) Integrated biclus-
shown, using sequence analysis and mRNA profiles, we tering of heterogeneous genome-wide datasets for the inference of
can predict the activity of miRNAs without the direct global regulatory networks. BMC Bioinformatics, 7, 280.
measurement of miRNA expression. 8. Bussemaker,H.J., Li,H. and Siggia,E.D. (2001) Regulatory element
detection using correlation with expression. Nat. Genet., 27,
Due to the flexibility of Allegro’s methodology and 167–171.
interface, it is suitable for a broad range of motif discovery 9. Conlon,E.M., Liu,X.S., Lieb,J.D. and Liu,J.S. (2003) Integrating
tasks. For example, in addition to the HG or binned regulatory motif discovery and genome-wide expression analysis.
enrichment score, motifs can be evaluated using other Proc. Natl Acad. Sci. USA, 100, 3339–3344.
scores we developed previously that measure global fea- 10. Eden,E., Lipson,D., Yogev,S. and Yakhini,Z. (2007) Discovering
motifs in ranked lists of DNA sequences. PLoS Comput. Biol., 3, 39.
tures of the distribution of the motif hits: localization 11. Linhart,C., Halperin,Y. and Shamir,R. (2008) Transcription factor
along the promoters, strand bias and chromosomal pref- and microRNA motif discovery: The Amadeus platform and a
erence (11). Allegro can simultaneously analyze promoter compendium of metazoan target sets. Genome Res., 18, 1180–1189.Nucleic Acids Research, 2009 13
12. Birney,E., Andrews,T.D., Bevan,P., Caccamo,M., Chen,Y., 34. Martinez-Pastor,M.T., Marchler,G., Schuller,C., Marchler-
Clarke,L., Coates,G., Cuff,J., Curwen,V., Cutts,T. et al. (2004) An Bauer,A., Ruis,H. and Estruch,F. (1996) The Saccharomyces cere-
overview of Ensembl. Genome Res., 14, 925–928. visiae zinc finger proteins Msn2p and Msn4p are required for
13. Wingender,E., Dietze,P., Karas,H. and Knuppel,R. (1996) transcriptional induction through the stress response element
TRANSFAC: a database on transcription factors and their DNA (STRE). EMBO J., 15, 2227–2235.
binding sites. Nucleic Acids Res., 24, 238–241. 35. Tompa,M., Li,N., Bailey,T.L., Church,G.M., De Moor,B.,
14. O’Rourke,S.M. and Herskowitz,I. (2004) Unique and redundant Eskin,E., Favorov,A.V., Frith,M.C., Fu,Y., Kent,W.J. et al. (2005)
roles for HOG MAPK pathway components as revealed by whole- Assessing computational tools for the discovery of transcription
genome expression analysis. Mol. Biol. Cell., 15, 532–542. factor binding sites. Nat. Biotechnol., 23, 137–144.
15. Whitfield,M.L., Sherlock,G., Saldanha,A.J., Murray,J.I., Ball,C.A., 36. Slonim,N., Atwal,G.S., Tkacik,G. and Bialek,W. (2005)
Alexander,K.E., Matese,J.C., Perou,C.M., Hurt,M.M., Brown,P.O. Information-based clustering. Proc. Natl Acad. Sci. USA, 102,
et al. (2002) Identification of genes periodically expressed in the 18297–18302.
human cell cycle and their expression in tumors. Mol. Biol. Cell, 13, 37. Elemento,O., Slonim,N. and Tavazoie,S. (2007) A universal frame-
1977–2000. work for regulatory element discovery across all genomes and data
16. Su,A.I., Wiltshire,T., Batalov,S., Lapp,H., Ching,K.A., Block,D., types. Mol. Cell, 28, 337–350.
Zhang,J., Soden,R., Hayakawa,M., Kreiman,G. et al. (2004) A gene 38. Whitlock,M.C. (2005) Combining probability from independent
atlas of the mouse and human protein-encoding transcriptomes. tests: the weighted Z-method is superior to Fisher’s approach. J.
Proc. Natl Acad. Sci. USA, 101, 6062–6067. Evol. Biol., 18, 1368–1373.
17. Bolstad,B.M., Irizarry,R.A., Astrand,M. and Speed,T.P. (2003) 39. Don,J. and Stelzer,G. (2002) The expanding family of CREB/
A comparison of normalization methods for high density oligonu- CREM transcription factors that are involved with spermatogenesis.
cleotide array data based on variance and bias. Bioinformatics, 19, Mol. Cell Endocrinol., 187, 115–124.
185–193. 40. Hummler,E., Cole,T.J., Blendy,J.A., Ganss,R., Aguzzi,A.,
18. Shamir,R., Maron-Katz,A., Tanay,A., Linhart,C., Steinfeld,I., Schmid,W., Beermann,F. and Schutz,G. (1994) Targeted mutation
Sharan,R., Shiloh,Y. and Elkon,R. (2005) EXPANDER–an inte- of the CREB gene: compensation within the CREB/ATF family of
grative program suite for microarray data analysis. BMC transcription factors. Proc. Natl Acad. Sci. USA, 91, 5647–5651.
Bioinformatics, 6, 232. 41. Blendy,J.A., Kaestner,K.H., Schmid,W., Gass,P. and Schutz,G.
19. Muller,F.J., Laurent,L.C., Kostka,D., Ulitsky,I., Williams,R., (1996) Targeting of the CREB gene leads to up-regulation of a
Lu,C., Park,I.H., Rao,M.S., Shamir,R., Schwartz,P.H. et al. (2008) novel CREB mRNA isoform. EMBO J., 15, 1098–1106.
Regulatory networks define phenotypic classes of human stem cell 42. Morotomi-Yano,K., Yano,K., Saito,H., Sun,Z., Iwama,A. and
lines. Nature, 455, 401–405. Miki,Y. (2002) Human regulatory factor X 4 (RFX4) is a testis-
20. MacQueen,J. (1965) Some methods for classification and analysis specific dimeric DNA-binding protein that cooperates with other
of multivariate observations. In Proceedings of the 5th Berkeley human RFX members. J. Biol. Chem., 277, 836–842.
Symposium on Mathematical Statistics and Probability, 43. Grimes,S.R. (2004) Testis-specific transcriptional control. Gene, 343,
CA: University of California Press, pp. 281–297. 11–22.
21. Sharan,R. and Shamir,R. (2000) CLICK: a clustering algorithm 44. Mettus,R.V., Litvin,J., Wali,A., Toscani,A., Latham,K., Hatton,K.
with applications to gene expression analysis. Proc. Int. Conf. Intell. and Reddy,E.P. (1994) Murine A-myb: evidence for differential
Syst. Mol. Biol., 8, 307–316. splicing and tissue-specific expression. Oncogene, 9, 3077–3086.
22. Pavesi,G., Mauri,G. and Pesole,G. (2001) An algorithm for finding 45. Oh,I.H. and Reddy,E.P. (1999) The myb gene family in cell growth,
signals of unknown length in DNA sequences. Bioinformatics, differentiation and apoptosis. Oncogene, 18, 3017–3033.
17(Suppl. 1), S207–S214. 46. Sitzmann,J., Noben-Trauth,K., Kamano,H. and Klempnauer,K.H.
23. Bailey,T.L. and Elkan,C. (1994) Fitting a mixture model by (1996) Expression of B-Myb during mouse embryogenesis.
expectation maximization to discover motifs in biopolymers. Proc. Oncogene, 12, 1889–1894.
Int. Conf. Intell. Syst. Mol. Biol., 2, 28–36. 47. Huang,X., Zhang,J., Lu,L., Yin,L., Xu,M., Wang,Y., Zhou,Z. and
24. Stormo,G.D. (2000) DNA binding sites: representation and dis- Sha,J. (2004) Cloning and expression of a novel CREB mRNA
covery. Bioinformatics, 16, 16–23. splice variant in human testis. Reproduction, 128, 775–782.
25. Elkon,R., Linhart,C., Sharan,R., Shamir,R. and Shiloh,Y. (2003) 48. Black,B.L. and Olson,E.N. (1998) Transcriptional control of muscle
Genome-wide in silico identification of transcriptional regulators development by myocyte enhancer factor-2 (MEF2) proteins. Annu.
controlling the cell cycle in human cells. Genome Res., 13, 773–780. Rev. Cell Dev. Biol., 14, 167–196.
26. Tabach,Y., Milyavsky,M., Shats,I., Brosh,R., Zuk,O., Yitzhaky,A., 49. Kuo,C.J., Conley,P.B., Chen,L., Sladek,F.M., Darnell,J.E., , and
Mantovani,R., Domany,E., Rotter,V. and Pilpel,Y. (2005) The Crabtree,G.R. (1992) A transcriptional hierarchy involved in
promoters of human cell cycle genes integrate signals from two mammalian cell-type specification. Nature, 355, 457–461.
tumor suppressive pathways during cellular transformation. Mol. 50. Dimova,D.K. and Dyson,N.J. (2005) The E2F transcriptional net-
Syst. Biol., 1, 0022. work: old acquaintances with new faces. Oncogene, 24, 2810–2826.
27. Linhart,C., Elkon,R., Shiloh,Y. and Shamir,R. (2005) Deciphering 51. Cam,H., Balciunaite,E., Blais,A., Spektor,A., Scarpulla,R.C.,
transcriptional regulatory elements that encode specific cell cycle Young,R., Kluger,Y. and Dynlacht,B.D. (2004) A common set of
phasing by comparative genomics analysis. Cell Cycle, 4, gene regulatory networks links metabolism and growth inhibition.
1788–1797. Mol. Cell, 16, 399–411.
28. Zhu,Z., Shendure,J. and Church,G.M. (2005) Discovering func- 52. Mehic,D., Bakiri,L., Ghannadan,M., Wagner,E.F. and
tional transcription-factor combinations in the human cell cycle. Tschachler,E. (2005) Fos and jun proteins are specifically expressed
Genome Res., 15, 848–855. during differentiation of human keratinocytes. J. Invest. Dermatol.,
29. Zhu,W., Giangrande,P.H. and Nevins,J.R. (2004) E2Fs link the 124, 212–220.
control of G1/S and G2/M transcription. Embo J., 23, 4615–4626. 53. Fadloun,A., Kobi,D., Pointud,J.C., Indra,A.K., Teletin,M., Bole-
30. Bardwell,L. (2004) A walk-through of the yeast mating pheromone Feysot,C., Testoni,B., Mantovani,R., Metzger,D., Mengus,G. et al.
response pathway. Peptides, 25, 1465–1476. (2007) The TFIID subunit TAF4 regulates keratinocyte prolifera-
31. Gasch,A.P., Spellman,P.T., Kao,C.M., Carmel-Harel,O., tion and has cell-autonomous and non-cell-autonomous tumour
Eisen,M.B., Storz,G., Botstein,D. and Brown,P.O. (2000) Genomic suppressor activity in mouse epidermis. Development, 134,
expression programs in the response of yeast cells to environmental 2947–2958.
changes. Mol. Biol. Cell, 11, 4241–4257. 54. Hooper,S.D., Boue,S., Krause,R., Jensen,L.J., Mason,C.E.,
32. Hohmann,S. (2002) Osmotic stress signaling and osmoadaptation in Ghanim,M., White,K.P., Furlong,E.E. and Bork,P. (2007)
yeasts. Microbiol. Mol. Biol. Rev., 66, 300–372. Identification of tightly regulated groups of genes during
33. O’Rourke,S.M., Herskowitz,I. and O’Shea,E.K. (2002) Yeast go the Drosophila melanogaster embryogenesis. Mol. Syst. Biol., 3, 72.
whole HOG for the hyperosmotic response. Trends Genet., 18, 55. Arbeitman,M.N., Furlong,E.E., Imam,F., Johnson,E., Null,B.H.,
405–412. Baker,B.S., Krasnow,M.A., Scott,M.P., Davis,R.W. and White,K.P.You can also read