The aging myostatin null phenotype: reduced adiposity, cardiac hypertrophy, enhanced cardiac stress response, and sexual dimorphism

Page created by Carl Goodwin
 
CONTINUE READING
The aging myostatin null phenotype: reduced adiposity, cardiac hypertrophy, enhanced cardiac stress response, and sexual dimorphism
263

The aging myostatin null phenotype: reduced adiposity, cardiac
hypertrophy, enhanced cardiac stress response, and sexual dimorphism
Melissa F Jackson1, Dung Luong1, Dor Dor Vang4, Dilip K Garikipati4, James B Stanton2, O Lynne Nelson3
and Buel D Rodgers1,4
1
    School of Molecular Biosciences, Departments of 2Veterinary Microbiology and Pathology, 3Veterinary Clinical Sciences and 4Animal Sciences, 124 ASLB,
      Washington Center for Muscle Biology, Washington State University, Pullman, Washington 99164, USA
(Correspondence should be addressed to B D Rodgers at Department of Animal Sciences, 124 ASLB, Washington Center for Muscle Biology, Washington State
   University; Email: danrodgers@wsu.edu; O L Nelson at Internal Medicine and Cardiology, Veterinary Teaching Hospital, Washington State University,
   100 Grimes Way, Pullman, Washington 99164, USA; Email: olnelson@vetmed.wsu.edu)

Abstract
The natural aging process results in the physiological decline                    and adipocyte size. Hearts were heavier in MstnK/K mice
of multiple tissues and organ systems. Changes commonly                           across a large age range (3–24 m.o.) and exhibited signs of
occur with middle age and include decreased skeletal muscle                       dilated cardiomyopathy at rest, which include lower strain
mass, bone mineral density, cardiac output, and insulin                           measurements compared with WT myocardium. However,
sensitivity, and increased adiposity, all of which can contribute                 MstnK/K mice responded better to isoproterenol stress tests
to the onset of sarcopenia, osteoporosis, heart failure, or type                  with greater increases in fractional shortening and ejection
2 diabetes. Recent studies suggest that myostatin may                             fraction—differences that were again more apparent in
influence many of these systems. We therefore sought to                           females and which are consistent with physiological cardiac
determine whether they are affected by aging, especially in                       hypertrophy. Spleens and kidneys were also smaller, although
‘middle-aged’ MstnK/K mice (12–20 months old (m.o.)).                             histologically normal, in MstnK/K mice. These data together
Although body weights were similar in wild-type (WT) and                          suggest that attenuating myostatin could potentially prevent
MstnK/K mice, lean fat-free mass and skeletal muscles                             or possibly treat pathological conditions that develop with
composed of predominantly type I, II, and mixed fibers                            age. Additional studies are nevertheless needed to definitively
were significantly heavier in MstnK/K mice. These                                 assess potential risks to cardiac function.
differences were accompanied by lower total adiposity,
                                                                                  Journal of Endocrinology (2012) 213, 263–275
especially in female mice, white and brown fat pad weights,

Introduction                                                                      null animals often referred to as ‘double muscling’ (Rodgers
                                                                                  & Garikipati 2008). Several recent studies have also indicated
The aging process is the physiological accumulation of changes                    that myostatin is not only expressed in skeletal muscle but also
over time and is unfortunately associated with increased disease                  in cardiac muscle (Sharma et al. 1999, Shyu et al. 2005, Artaza
susceptibility. Sarcopenia, the age-related and progressive loss                  et al. 2007, Rodgers et al. 2009), where it inhibits several
of skeletal muscle mass and function, afflicts a large percentage                 growth processes including basal and insulin-like growth
of the elderly (Cruz-Jentoft et al. 2010) and can be a significant                factor (IGF)-stimulated proliferation of cardiomyocytes,
contributing factor to cardiovascular and bone mineralization                     protein synthesis, and cellular hypertrophy (Morissette et al.
diseases (Lang et al. 2010). Increasing skeletal muscle mass                      2006, McKoy et al. 2007, Rodgers et al. 2009, Bish et al.
through exercise can also have beneficial effects on obesity-                     2010). Myostatin also circulates and has recently been
related disorders, on preventing frailty, and on mitigating                       suggested to regulate hepatic production of IGF1 and several
cardiovascular disease (Winett et al. 2009). Thus, a better                       IGF-binding proteins (Williams et al. 2011). These factors
understanding of sarcopenia or mechanisms to enhance skeletal                     similarly regulate skeletal and cardiac muscle growth, and,
muscle mass could help to develop novel treatments for these                      thus, myostatin’s actions on these tissues are likely mediated
related disorders.                                                                locally, via the autocrine production of myostatin, and
   Potential therapeutics for sarcopenia and other muscle-                        systemically, which includes the endocrine regulation of
wasting diseases include those that target myostatin, a                           IGF axis components.
myokine best known for negatively regulating skeletal muscle                         In both human and animal models, cardiac expression
mass and for the extreme musculature generated in myostatin                       of myostatin protein and/or mRNA is elevated under

Journal of Endocrinology (2012) 213, 263–275                                                                                   DOI: 10.1530/JOE-11-0455
0022–0795/12/0213–263 q 2012 Society for Endocrinology           Printed in Great Britain         Online version via http://www.endocrinology-journals.org

                                                                                                            Downloaded from Bioscientifica.com at 11/04/2021 01:38:22AM
                                                                                                                                                          via free access
The aging myostatin null phenotype: reduced adiposity, cardiac hypertrophy, enhanced cardiac stress response, and sexual dimorphism
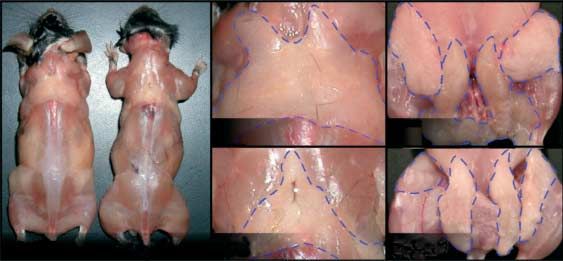
264   M F JACKSON   and others . Aging myostatin null phenotype

      different pathophysiological states, including ischemic and         Materials and Methods
      nonischemic (dilated cardiomyopathy) heart failure (Sharma
      et al. 1999, Shyu et al. 2006, George et al. 2010). Conversely,     Ethics statement
      we have recently reported that myostatin negatively regulates
                                                                          C57BL/6 WT and myostatin null (MstnK/K) mice were
      physiological cardiac hypertrophy (Rodgers et al. 2009,
      Valdivia 2009) as myostatin null (MstnK/K) mice had larger          housed and bred in environmentally controlled rooms with
      hearts, due to eccentric hypertrophy, and an enhanced stress        12 h daily light. They were fed ad libitum and were used in
      response, due in part to enhanced Ca2C handling. Analysis of        strict accordance with protocols preapproved by the
      primary ventricular myocytes indicated that [Ca2C]i tran-           Institutional Animal Care and Use Committee of Washington
      sients and total cellular loads were greater in MstnK/K mice        State University.
      and this corresponded to enhanced cellular contractility.
      Hearts and cells from MstnK/K mice lacked the fetal gene            Animals and tissue collection
      expression profile that occurs with pathological hypertrophy
      and, from a biophysical perspective, were functionally normal       Aging male and female mice of both genotypes (WT,
      or superior to wild-type (WT) tissues. Thus, myostatin              MstnC/C vs MstnK/K) were used (see figure legends for n
      inhibits cardiac muscle excitation–contraction coupling and         values) and were born on different days. The average age of
      appears to similarly act as a chalone in both cardiac and           mice used to assess differences in everything except heart
      skeletal muscles. The myokine has also been linked to other         weight over time was 14 months old (m.o.) for females and 13
      disease states including obesity and type 2 diabetes, as genetic    m.o. for males. Measurements include bone density and body
      crosses of MstnK/K mice with genetically obese mice produce         composition analyses using a dual-energy X-ray absorptio-
      offspring that are neither obese nor insulin resistant              metry (DXA) on mice anesthetized with 2.5% isoflurane in
      (McPherron & Lee 2002). MstnK/K mice do not become                  oxygen. Mice were also asphyxiated with CO2 and skinned
      obese when fed a high-fat diet (Wilkes et al. 2009) as the          before removing and weighing several tissues, some of which
      increased musculature consumes circulating carbohydrates            were used for histology. This includes hearts, individual
      and prevents the de novo synthesis of triglycerides (Guo et al.     skeletal muscles (gastrocnemius, tibias anterior, extensor
      2009). Preventing the activation of endogenous activin              digitorum longus, and soleus), livers, spleens, and kidneys.
      receptors, which also bind myostatin and possibly growth            Hearts were first cut to drain the blood, trimmed to remove
      differentiation factor 11 (GDF11), by injecting a soluble           noncardiac tissue, rinsed in PBS, and blotted dry before
      form of the extracellular domain, prevents the cancer-              weighing. The other tissues were similarly processed.
      induced development of skeletal and cardiac muscle cachexia
      while simultaneously reducing fat stores (Zhou et al. 2010).
      Other studies suggest that myostatin blockade can enhance           Histology
      skeletal muscle regeneration, exercise performance, and
                                                                          Three white adipose tissue (WAT) fat pads, subscapular,
      whole-body metabolism in senescent mice (Siriett et al.
      2007, Yablonka-Reuveni 2007, Lebrasseur et al. 2009).               inguinal, and gonadal, and the intrascapular brown fat
      Preventing activin/myostatin receptor activation, therefore,        (BAT) pad were analyzed. These tissues were fixed in
      has the potential to treat many common pathological states          4% paraformaldehyde (PFA) overnight, embedded in paraffin,
      of aging.                                                           sectioned at 8 mm (WAT) or 4 mm (BAT), and stained with
         Our objective was to determine the long-term effects             hematoxylin and eosin (Thermo Fisher Scientific). For WAT,
      of myostatin deletion on various organ systems in aging             six nonconsecutive sections were stained for each fat pad per
      and ‘middle-aged’ mice as many age-related disorders                animal and one random 200! image was taken using a Leica
      (e.g. sarcopenia, obesity, and some forms of heart failure)         DFC295 from each section. For BAT, five nonconsecutive
      develop progressively from middle age through senescence.           sections were stained per animal and one random 400!
      This is particularly important, as no study to date has             image was taken for each section. Average cell size was then
      evaluated this age group. Our results indicate for the first time   measured from each image using Adobe Photoshop CS4.
      that cardiac hypertrophy and enhanced b-adrenergic respon-          Mitochondria were labeled by placing isolated WAT and
      siveness occur in mice of different ages and that brown             BAT in DMEM (Thermo Fisher Scientific) containing
      adipose tissue (BAT) is reduced in the middle-aged and              MitoTracker Orange (400 nM; Invitrogen) and left to
      senescent Mstn K/K mice. Several sexually dimorphic                 incubate for 30 min. The tissues were washed twice with
      differences were also noted, for the first time, especially         media and fixed in 4% PFA for 5 h. After fixation, the BAT
      during cardiac stress tests and in adipose stores. Our studies      was placed in PBS containing 15% sucrose overnight and then
      therefore suggest that the age-related decline of different         embedded in 15% sucrose containing 7.5% gelatin and frozen.
      organ systems is less severe in MstnK/K than WT mice. Thus,         BAT was sectioned at 4 mm using a cryostat and imaged using
      attenuating the actions of myostatin could potentially              a Leica DFC295 as previously mentioned. WAT was placed
      ameliorate many pathological conditions that develop with           between two coverslips and imaged using a confocal
      age and may be more effective in women than men.                    microscope (Zeiss LSM 510 META).

      Journal of Endocrinology (2012) 213, 263–275                                                               www.endocrinology-journals.org

                                                                                               Downloaded from Bioscientifica.com at 11/04/2021 01:38:22AM
                                                                                                                                             via free access
The aging myostatin null phenotype: reduced adiposity, cardiac hypertrophy, enhanced cardiac stress response, and sexual dimorphism
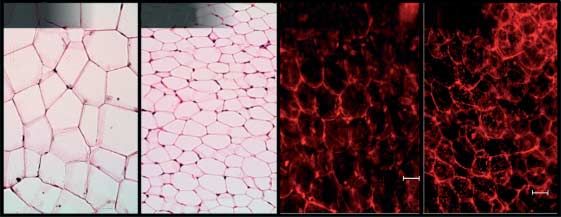
Aging myostatin null phenotype .            M F JACKSON     and others 265

The right kidney and spleens were also assessed histologically     appropriate (P%0.05). A regression analysis was also used to
                                                                   determine the differences in heart weights of differently aged
Both were fixed in 4% PFA overnight, although kidneys were
                                                                   mice by calculating slopes, to determine the effect of time,
first cut in half longitudinally to expose the cortex, medulla,
                                                                   and y-intercepts, and to distinguish overall differences in the
and pelvis. Both tissues were then embedded in paraffin,
                                                                   two populations/genotypes. Separately analyzing data by age
sectioned at 3.5 mm (spleen) or 4.5 mm (kidney), and stained       groups allowed us to determine whether a particular age
with hematoxylin and eosin. Sections were evaluated by             group influenced the differences detected when all animals
standard light microscopy using a Leica DM3000 microscope.         were included in the analysis.
The renal cortex was also imaged at 100! and spleens at 50!
using a Leica DFC420. Cortical thickness and tubule and
glomeruli size were measured in a subset of images and the
number of kidney nephrons per field was determined by              Results
counting all glomeruli. In addition, total surface area of
lymphoid nodules was quantified by first outlining nodules in      Body morphology
spleen images, using Paint.net, and comparing these regions        Aging is often associated with a decrease in skeletal muscle
to the total surface area.                                         mass and bone mineral density as well as an increase in fat
                                                                   mass. We therefore performed DXA scans to assess body and
Echocardiography                                                   bone composition and weighed individual muscles and organs
                                                                   from WT and MstnK/K mice. We have previously reported
For standard echocardiography, we used the Mylab 70                that body and heart weights do not diverge until after
XVision echocardiography system (Biosound Esoate, Inc.,            w100 days (Rodgers et al. 2009). It was therefore surprising
Indianapolis, IN, USA) with a 18 MHz linear epicardial             to see that body weights were similar in aged WT and
transducer while a 10 MHz-phased array transducer was used         MstnK/K mice (Fig. 1A). This was due to an age-related
for strain acquisition. Mice were anesthetized in a closed         gradual increase in body weight among WT mice that did not
system chamber with 2.5% isoflurane in oxygen and were             occur in MstnK/K mice (data not shown). Lean fat-free mass
maintained for the duration of the procedure with a nasal          was greater in both sexes of MstnK/K mice and total and
cone delivering 1% isoflurane. Echocardiography was                percent body fat content was less (Fig. 1A), particularly in
performed on anesthetized mice in order to assess basal and        females. This sexual dimorphism in adiposity among
maximal cardiac performance using isoproterenol (ISO) stress       MstnK/K mice is highly novel and to our knowledge has
tests, which cannot be performed on nonanesthetized mice as        not been previously reported. Bone mineralization was also
handling these mice induces a stress response. Standard            different as total content in both sexes was less in MstnK/K
imaging planes, M-mode, Doppler, and functional calcu-             mice, although when normalized to bone area and expressed
lations were obtained according to American Society of             as bone mineral density, differences were only seen in male
Echocardiography guidelines.                                       mice (Fig. 1B). Body compositions therefore differed, despite
   The left ventricle (LV) parasternal long axis four-chamber      similar weights, as MstnK/K mice were lean, had greater fat-
view was used to derive ejection fraction (%EF) as well as         free mass, and possibly less bone mineralization while WT
ventricular dimensions and volumes. The left parasternal           mice had more fat.
short axis view was used to obtain M-mode ventricular wall
measures, fractional shortening (%FS), and for radial strain
analysis. Eight equispaced tracking points were placed             Differences in lean body mass are usually reflected in muscle mass
circumferentially along the endocardial surface at the papillary   We therefore weighed four hindlimb muscles to determine
muscle level (short axis). The four tracking points of the left    whether the maintenance of muscle mass differed between
ventricular free wall revealed the greatest signal consistency     muscles with different fiber types particularly as aging is not
and were used for analysis. Finally, the subcostal long axis       only associated with the loss of muscle mass in general but also
view, from the left apex, was used for Doppler imaging of          a shift in type II to type I fibers (Lang et al. 2010). Although
mitral inflow and aortic ejection profiles. Stress tests were      changes in fiber typing was not assessed, the weights of
performed after first obtaining a baseline echocardiogram          muscles composed of predominantly type I (gastrocnemius
followed by i.p. injections of ISO (10 mg/kg, Isuprel-R;           and soleus), type II (tibialis anterior), and mixed fiber types
Abbott Laboratories). Echocardiograph measures were then           were 50–150% greater in aged MstnK/K mice (Fig. 1C). The
recollected 3 min after injection.                                 enhanced musculature that occurs in both sexes, therefore,
                                                                   occurs in muscles with different fiber types, although it is not
                                                                   known whether the age-related change in fiber type is altered
Statistical analysis
                                                                   in MstnK/K mice. By contrast, liver, kidney, and spleen
Differences between means were determined by a one- or             weights were all less in male and female MstnK/K mice
two-way ANOVA coupled to Bonferroni post hoc test for              (Fig. 1D). Histological analysis of the kidneys failed to
multiple mean comparisons or by a Student’s t-test when            identify differences in cortical thickness; the size of tubules

www.endocrinology-journals.org                                                              Journal of Endocrinology (2012) 213, 263–275

                                                                                           Downloaded from Bioscientifica.com at 11/04/2021 01:38:22AM
                                                                                                                                         via free access
266   M F JACKSON   and others . Aging myostatin null phenotype

                             A                                     Body composition                   B                                Bone composition
                                                            WT, male            WT, female                                        WT, male                 WT, female
                                                            Mstn–/–, male       Mstn–/–, female                                   Mstn–/–, male            Mstn–/–, female
                                                150                                                                      120
                                                                      *     *

                             Percentage of WT

                                                                                                      Percentage of WT
                                                100                                                                      100                          *                *
                                                                                                                                       *                       *
                                                                                  *           *                           80
                                                 50
                                                                                        *         *
                                                                                                                          60
                                                  0
                                                       BW            Lean         Fat       % Fat                              Bone area          BMC                  BMD

                             C                                      Muscle weights                    D                                Organ weights
                                                            WT, male            WT, female                                        WT, male                 WT, female
                                                            Mstn–/–, male       Mstn–/–, female                                   Mstn–/–, male            Mstn–/–, female
                                                300                                                                      120
                                                                                              *

                                                                                                      Percentage of WT
                             Percentage of WT

                                                250
                                                                                                                         100
                                                                                  *                                                         *
                                                200            *      *     *           *                                                         *                *
                                                        *
                                                                                                  *                                                        *                 *
                                                150                                                                       80

                                                100                                                                                                                    *
                                                                                                                          60
                                                 50
                                                      Gastroc         TA         EDL        Soleus                             Heart       Liver          Kidney Spleen
                             Figure 1 Morphological differences between WT and MstnK/K mice. Data are expressed as
                             percentage of WT in order to include all parameters in one figure. Body composition (A) and bone
                             mineralization (B) were determined using DXA (BW, body weight; lean and fat refer to mass;
                             BMC, bone mineral content; BMD, bone mineral density). (C) Hindlimb muscles include
                             gastrocnemius (Gastroc, mixed fiber type), tibialis anterior (TA, type II); extensor digitalis longus
                             (EDL, type I), and soleus (type I). (D) Organs were rinsed in PBS and blotted dry before weighing
                             (nZ6–14). Significant differences between WT and MstnK/K mice, within a particular sex, are
                             indicated by asterisks (P%0.05). (A, B and C, nZ5 or 6; D, nZ6–14; average ageZ14 m.o. for
                             female and 13 m.o. for male).

      and glomeruli; and the number of glomeruli or the relative                                        and found that all were significantly smaller (P!0.01) in
      area of medullary, pelvic, and perirenal adipose tissue (data not                                 MstnK/K male and female mice (data not shown). Assessing
      shown). The amount of white pulp in the spleens was also                                          cell morphology of inguinal fat pads and of BAT from male
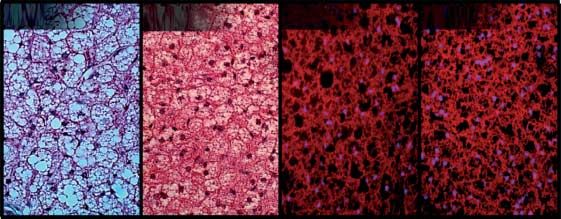
      similar in both genotypes. This suggests that the smaller organ                                   and female mice (Fig. 2C) indicated that not only cell size was
      size in MstnK/K mice is either due to hypoplasia or general                                       smaller in MstnK/K WAT and BAT but also the latter stained
      atrophy but not to changes in any particular cell type.                                           differently in female MstnK/K mice, reddish instead of purple,
                                                                                                        which is often due to greater eosin staining of mitochondria.
                                                                                                        Labeling mitochondria using Mitotracker, in both BAT and
      Adiposity
                                                                                                        WAT, indicated that mitochondrial number was similar in fat
      Aged MstnK/K mice have a visibly leaner phenotype                                                 from both genotypes (Fig. 2D). It is therefore likely that the
      compared with WT mice (Fig. 2A) as the amount of s.c. fat                                         differential eosin staining results from higher cellular density
      accumulation is significantly reduced. In fact, the weights of                                    in MstnK/K fat pads due to the lower relative fat content.
      several fat pads, including three WAT and the intrascapular                                          Compared with WT mice, there was a greater distribution
      BAT, were reduced in MstnK/K mice, albeit with notable                                            of small adipocytes in MstnK/K WAT of both sexes (Fig. 3A
      sex differences (Fig. 2B). Compared with WT females, the                                          and B). More cells were counted in sections of MstnK/K fat
      weights of BAT, subscapular, inguinal, and gonadal fat pads                                       pads as the average cell diameter in subscapular and inguinal
      were all less in MstnK/K female mice. In male MstnK/K mice,                                       fat pads, again in both sexes, and also in gonadal fat pads
      however, only the inguinal fat pad was smaller, although the                                      of female MstnK/K mice, was smaller (Fig. 3C). Similar
      difference in subscapular weights between WT and MstnK/K                                          differences in the adipocyte size distribution and average cell
      males was nearly significant (PZ0.08). We also analyzed the                                       diameter were also seen in BAT, but only with female mice
      weights of these various fat pads in senescent mice (20 m.o.)                                     (Fig. 3D, E and F). This is consistent with differences in tissue

      Journal of Endocrinology (2012) 213, 263–275                                                                                                                     www.endocrinology-journals.org

                                                                                                                                                Downloaded from Bioscientifica.com at 11/04/2021 01:38:22AM
                                                                                                                                                                                              via free access
Aging myostatin null phenotype .                  M F JACKSON     and others 267

                                 A                                                     Body morphology

                                                                                                                     Inguinal

                                                                                                                                     Epididymal
                                                                                       WT                           WT

                                                                                                                         Inguinal

                                                                                                                           Epididymal
                                                    WT          Mstn–/–                Mstn–/–                       Mstn–/–

                                 B                                       Adipose tissue weights

                                                                    WT, male                 WT, female
                                                    150             Mstn –/–, male           Mstn –/–, female
                                 Percentage of WT

                                                             0·08

                                                    100

                                                                                                 *
                                                                                        *
                                                     50
                                                                     *                                  *
                                                                                                                     *

                                                      0
                                                          Subscapular Brown                 Inguinal           Gonadal

                                 C                                                WAT cell morphology
                                  i. WT                               ii. Mstn –/–                   iii. WT                 iv. Mstn –/–

                                                                                                                     50 µm
                                                                                                                                              50 µm

                                 D                                                BAT cell morphology
                                  i. WT                               ii.   Mstn –/–                 iii. WT                 iv. Mstn –/–

Figure 2 Deletion of myostatin reduces fat accumulation in aged mice. (A) Representative phenotype of skinned WT and MstnK/K mice fed
ad libitum. Ten (WT) and 12 (MstnK/K) m.o. male mice are shown and respective fat pads are outlined. (B) Fat pad weights are expressed as
percentage of WT to enable grouping of all data on one graph (nZ5 or 6; average ageZ14 m.o. for female and 13 m.o. for male; *P%0.05).
(C) WAT (inguinal fat pads) stained with hematoxylin and eosin (i and ii) or Mitotracker Orange (iii and iv) and imaged at 200!. (D) BAT
stained and imaged as in (C), but imaged at 400!.

www.endocrinology-journals.org                                                                                                        Journal of Endocrinology (2012) 213, 263–275

                                                                                                                                     Downloaded from Bioscientifica.com at 11/04/2021 01:38:22AM
                                                                                                                                                                                   via free access
268   M F JACKSON   and others . Aging myostatin null phenotype

                                A                                       WAT cell diameter, male                 D                                       BAT cell diameter, male
                                                           80                                                                             400

                                                                                             WT, male                                                                    WT, male
                                                           60                                Mstn –/–, male                               300                            Mstn –/–, male

                                                                                                                Number of cells
                                Number of cells
                                                           40                                                                             200

                                                           20                                                                             100

                                                            0                                                                               0

                                                                                                                                                 11
                                                                                                                                                   1
                                                                   0

                                                                   0
                                                                 10

                                                                 50

                                                                 80

                                                                110

                                                                130
                                                                140
                                                                150

                                                                                                                                                   0
                                                                 20
                                                                 30
                                                                 40

                                                                 70

                                                                100

                                                                120

                                                                                                                                                   8
                                                                                                                                                   9
                                                                                                                                                 10

                                                                                                                                                 12
                                                                 60

                                                                                                                                                   2
                                                                                                                                                   3

                                                                                                                                                   6

                                                                                                                                                 13
                                                                                                                                                   4

                                                                                                                                                   4
                                                                                                                                                  5

                                                                                                                                                  7
                                                                 9

                                                                                                                                                >1
                                                                         Diameter of cells (µm)                                                          Diameter of cells (µm)

                                B                                       WAT cell diameter, female               E                                       BAT cell diameter, female
                                                          125                                                                             500
                                                                                             WT, female                                                                  WT, female
                                                          100                                Mstn –/–, female                             400                            Mstn –/–, female
                                Number of cells

                                                                                                                Number of cells
                                                           75                                                                             300

                                                           50                                                                             200

                                                           25                                                                             100

                                                            0                                                                               0

                                                                                                                                                   1

                                                                                                                                                 11
                                                                 40

                                                                 70
                                                                   0
                                                                 10

                                                                 30

                                                                110
                                                                 20

                                                                 60

                                                                120

                                                                150
                                                                   0

                                                                                                                                                 10
                                                                                                                                                   0
                                                                 80
                                                                100
                                                                 50

                                                                130
                                                                140

                                                                                                                                                   2
                                                                                                                                                   3

                                                                                                                                                   8
                                                                                                                                                   9

                                                                                                                                                 12
                                                                                                                                                   6

                                                                                                                                                >13
                                                                                                                                                  4

                                                                                                                                                  4
                                                                                                                                                  5

                                                                                                                                                  7
                                                                 9

                                                                                                                                                 1
                                                                        Diameter of cells (µm)                                                            Diameter of cells (µm)

                                C                                      Average WAT cell diameter                F                                   Average BAT cell diameter

                                                                    WT, male             WT, female
                                                                    Mstn –/–, male       Mstn –/–, female
                                                          100                                                                               6
                                 Diameter of cells (µm)

                                                                                                                 Diameter of cells (µm)

                                                           80
                                                                                                                                            4                                          *
                                                           60      *                 *
                                                                                                         *
                                                                          *              *
                                                           40
                                                                                                                                            2
                                                           20

                                                            0                                                                               0
                                                                Subscapular     Inguinal         Gonadal                                        WT, M     Mstn –/–, M   WT, F     Mstn –/–, F

                                Figure 3 Differences in adipose tissue mass and cell size among WT and MstnK/K mice.
                                (A and B) Distribution and number of differently sized cells from WAT among male (A) or
                                female (B) mice. Cell diameters were measured from sections of subscapular, inguinal, and
                                gonadal fat pads removed from 5 to 6 mice/genotype and averages (C; meanGS.E.M.,
                                *P%0.05) were determined by pooling all data. Cell size and number were determined
                                from an equal number of sections/fat pad/mouse. Thus, sections with smaller sized cells
                                contained more cells. (D, E and F) The distribution and average cell diameters of BAT were
                                determined as in A, B and C. (Average ageZ14 m.o. for female and 13 m.o. for male).

      weights (Fig. 2B) and suggests that reductions in cell size and                                                  between genotypes, were larger in MstnK/K mice of all ages
      not cell number are responsible for the lean phenotype of                                                        (Fig. 4A, B, C, D, E and F). A regression analysis indicated no
      MstnK/K mice.                                                                                                    effect of time (i.e. identical slopes), although the WT and
                                                                                                                       MstnK/K populations were distinct as indicated by highly
                                                                                                                       significant differences in Y-intercept values. Differences were
      Cardiac hypertrophy
                                                                                                                       independent of age and were highly significant in younger
      Body weights are often used for normalizing heart weights,                                                       adults (100–300 days old (d.o.)) and in aging mice (w300–
      although this is inappropriate with older mice (Yin et al.                                                       700 d.o.) after normalizing to tail length. Tibia lengths were
      1982). It can also be inappropriate when testing factors that                                                    also used for normalization in a small subset of animals and
      influence both cardiac and skeletal muscle as both numerator                                                     produced similar differences (data not shown). A regression
      and denominator are affected. In fact, absolute heart weights                                                    analysis was additionally performed on HW/TL ratios for
      and those normalized to tail lengths, which did not differ                                                       all animals in order to produce a shared Y-intercept of 0.02.

      Journal of Endocrinology (2012) 213, 263–275                                                                                                                                         www.endocrinology-journals.org

                                                                                                                                                                  Downloaded from Bioscientifica.com at 11/04/2021 01:38:22AM
                                                                                                                                                                                                                via free access
Aging myostatin null phenotype .                                                                   M F JACKSON   and others 269

                      A                                                            All ages                 B                                             Young adults                      C                                               Aging mice

                                                                        WT                                                                           WT                                                                               WT
                                                           0·5                                                                           0·3                                                                             0·5
                                                                        Mstn –/–                                                                     Mstn –/–                                                                         Mstn –/–

                              Heart weight (g)

                                                                                                            Heart weight (g)

                                                                                                                                                                                            Heart weight (g)
                                                           0·4                                                                                                                                                           0·4
                                                                                                                                         0·2
                                                           0·3                                                                                                                                                           0·3

                                                           0·2                                                                                                                                                           0·2
                                                                                                                                         0·1
                                                           0·1                                                                                                                                                           0·1
                                                                               Y intercepts, P < 0·0001                                                         Y intercepts, P < 0·0001                                                         Y intercepts, P < 0·006
                                                           0·0                                                                           0·0                                                                             0·0
                                                                 100 200 300 400 500 600 700 800                                               100    150          200       250      300                                      300   400     500         600    700    800
                                                                                    Days                                                                         Days                                                                             Days

                      D                                                            All ages                 E                                             Young adults                      F                                               Aging mice

                                                          0·05                                                                          0·04                                                                            0·05          WT
                              Heart weight/tail length

                                                                                                            Heart weight/tail length

                                                                                                                                                                                            Heart weight/tail length
                                                                        WT                                                                                                                                                            Mstn –/–
                                                          0·04          Mstn –/–                                                                                                                                        0·04
                                                                                                                                        0·03
                                                          0·03                                                                                                                                                          0·03
                                                                                                                                        0·02
                                                          0·02                                                                                                                                                          0·02
                                                                                                                                        0·01         WT
                                                          0·01                          Slopes, P = 0·046                                                                                                               0·01
                                                                                                                                                     Mstn –/– Y intercepts, P = 0·01                                                             Y intercepts, P = 0·0006
                                                                                         Y intercepts, NS
                                                          0·00                                                                          0·00                                                                            0·00
                                                                 100 200 300 400 500 600 700 800                                               100    150          200      250      300                                       300   400     500        600    700     800
                                                                                    Days                                                                         Days                                                                             Days

                      G                                                            All ages                 H                                             Young adults                          I                                           Aging mice
                                                         0·015                                                                         0·010                                                                           0·015
                      Heart weight/body weight

                                                                                                            Heart weight/body weight

                                                                                                                                                                                            Heart weight/body weight
                                                                        WT                                                                           WT                                                                               WT
                                                                        Mstn –/–                                                       0·008         Mstn –/–                                                                         Mstn –/–
                                                         0·010                                                                                                                                                         0·010
                                                                                                                                       0·006

                                                                                                                                       0·004
                                                         0·005                                                                                                                                                         0·005
                                                                                                                                       0·002                         Slopes, P = 0·039
                                                                   Slopes, P = 0·002 Y intercepts, NS                                                                 Y intercepts, NS                                                             Y intercepts, NS
                                                         0·000                                                                         0·000                                                                           0·000
                                                                 100 200 300 400 500 600 700 800                                               100    150         200      250      300                                        300   400    500       600      700    800
                                                                                   Days                                                                          Days                                                                            Days

                      Figure 4 Age-dependent changes in heart weight among WT and MstnK/K mice. (A, B and C)
                      Absolute heart weights in mice ranging in age from (A) 90–600, (B) 90–300, or (C) 300–600 d.o. In
                      the same mice, (D, E and F) heart weights were also normalized to tail length or (G, H and I) body
                      weights. A regression analysis was performed and differences in slopes and y-intercepts are
                      indicated (MstnK/K, dashed line).

The number of hearts above this value was then calculated for                                                                                                     aortic acceleration/ejection time ratio were similar to those of
age-matched WT and MstnK/K mice. In fact, there were 50%                                                                                                          WT mice (Fig. 5A, Table 1). This was true for both sexes and
more MstnK/K hearts above this value than WT hearts                                                                                                               suggests that a mild form of eccentric cardiac hypertrophy
(WT, 44G8%; MstnK/K, 66G7%; PZ0.026). By contrast,                                                                                                                occurs in aged MstnK/K mice. Stroke volume, cardiac output,
no differences were detected when heart weights were                                                                                                              and most hemodynamic parameters were again similar in both
normalized to body weights (Fig. 4G, H and I). Cardiac                                                                                                            genotypes. However, FS and EF were less in MstnK/K mice
hypertrophy, although mild, therefore occurs in MstnK/K                                                                                                           of both sexes as were radial velocity and strain measurements,
mice of all ages.                                                                                                                                                 which are indices of myocardial deformation (Saghir et al.
                                                                                                                                                                  2007). The atrial contraction velocity (MV A wave) was also
                                                                                                                                                                  greater in MstnK/K mice, although variability in female
Cardiac performance
                                                                                                                                                                  measurements prevented significance. Nevertheless,
Many recent studies indicate that myostatin regulates cardiac                                                                                                     reductions in EF, FS, radial velocity, and strain combined
muscle growth in a manner similar to that of skeletal muscle                                                                                                      with elevated atrial contraction velocity and internal
(Cook et al. 2002, Gaussin & Depre 2005, Shyu et al. 2005,                                                                                                        diameters and volumes are usually indicative of systolic and
Morissette et al. 2006, McKoy et al. 2007). In addition, we                                                                                                       diastolic dysfunction and dilated cardiomyopathy. By contrast,
recently identified cardiac hypertrophy in young MstnK/K                                                                                                          ISO stress tests, which are assessments of maximal cardiac
mice that more closely resembles physiological, not patho-                                                                                                        functional reserve, revealed enhanced responsiveness in aged
logical, hypertrophy especially as excitation–contraction                                                                                                         MstnK/K mice that was more pronounced in females (Fig. 5B
coupling and responses to ISO stress tests were enhanced in                                                                                                       and C, Table 1). Indeed, the ISO-induced change in FS and
MstnK/K cardiomyocytes and mice respectively (Rodgers                                                                                                             EF was larger in MstnK/K mice of both sexes than in WT
et al. 2009). We therefore sought to determine whether aged                                                                                                       mice. This was accompanied by better contractility in female
MstnK/K mice possess a similar phenotype.                                                                                                                         MstnK/K mice as the reductions in internal diameters and
   The resting systolic left ventricle internal diameters and                                                                                                     volumes were both enhanced, as was the ISO-induced heart
volumes were higher in MstnK/K mice, although wall and                                                                                                            rate (PZ0.07). In males, preservation of diastolic filling
septum measurements, stroke volume, cardiac output, left                                                                                                          contributed to enhanced EF as heart rate and systolic volumes
ventricle isovolumic relaxation time, aortic ejection time, and                                                                                                   were similar to those in WT mice. The overall differences

www.endocrinology-journals.org                                                                                                                                                                                                       Journal of Endocrinology (2012) 213, 263–275

                                                                                                                                                                                                                                     Downloaded from Bioscientifica.com at 11/04/2021 01:38:22AM
                                                                                                                                                                                                                                                                                   via free access
270   M F JACKSON                               and others . Aging myostatin null phenotype

      between WT and MstnK/K mice are similar to those                                                                                                                                                             studies are the first to report significant sexual dimorphism in
      previously described in young adult MstnK/K mice (Rodgers                                                                                                                                                    MstnK/K mice, particularly in adiposity and in cardiac
      et al. 2009) and suggest that although resting cardiac                                                                                                                                                       function. They are also the first to quantify strain differences
      performance appears pathological, response to ISO stress                                                                                                                                                     in the myocardium, regardless of age, and again corroborate
      tests indicates functional improvement over WT mice.                                                                                                                                                         the increased ISO responsiveness previously characterized in
                                                                                                                                                                                                                   young adult mice. Furthermore, our results resolve a current
                                                                                                                                                                                                                   controversy in the field and explain why cardiac hypertrophy
                                                                                                                                                                                                                   is often mischaracterized in MstnK/K animals (see below).
      Discussion                                                                                                                                                                                                   These studies complement those with senescent mice and
                                                                                                                                                                                                                   together suggest that targeting myostatin could potentially
      Recent studies have reported enhanced skeletal muscle mass
                                                                                                                                                                                                                   help to treat many age-related disorders (Siriett et al. 2007,
      and reduced WAT mass in senescent (24–30 m.o.) MstnK/K
                                                                                                                                                                                                                   Yablonka-Reuveni 2007, Lebrasseur et al. 2009). This
      mice (Wagner et al. 2005, Siriett et al. 2006, Morissette et al.
                                                                                                                                                                                                                   naturally assumes that the phenotypes described can be
      2009). We have corroborated these results using aging or
                                                                                                                                                                                                                   duplicated by attenuating myostatin in adults and that several
      ‘middle-aged’ MstnK/K mice and, for the first time,
                                                                                                                                                                                                                   precautions are carefully considered.
      demonstrated reductions in BAT mass and cell size. These
                                                                                                                                                                                                                      The progressive loss of skeletal muscle mass and increased
       A                                                                                    Basal cardiac performance                                                                                              adiposity that normally occurs with aging is in contrast to the
                                  300                                       *                                                                                                                                      lean MstnK/K phenotype that is maintained with age in both
                                                                                                                                                                   Mstn–/–, male                                   male and female mice (Fig. 1A). Previous studies have
                                                                                                                                                                   Mstn–/–, female
                                                                                                                                                                                                                   nevertheless demonstrated age-associated declines in fat-free
       Percentage of WT

                                  200                                       *
                                                  *
                                                                                                                                                                                                                   lean body mass and skeletal muscle mass even in MstnK/K
                                              *                                                                                                      *                                                             mice (Morissette et al. 2009). Indeed, the reported decline was
                                  100                         *                                                                                                                                                    similar in both WT and MstnK/K mice. Our data indicate that
                                                                                   ** **                                                                     *              ** *           *
                                                                                                                                                                                                               *
                                                                                                                                                                                     *              *              muscle weights, regardless of fiber-type classification, are still
                                                                                                                                                                                                        N.A.

                                    0
                                                                                                                                                                                                                   significantly greater than those of WT mice (Fig. 1C). This
                                                                                                                                                                                                                   suggests that a MstnK/K environment does not prevent age-
                                             LVIDd
                                             LVIDs
                                              IVSd
                                             LVWd
                                          LV mass
                                          Diast vol
                                           Syst vol
                                                FS
                                                EF
                                             St vol
                                               C.O.
                                          LV IVRT
                                                HR
                                           Ao velo
                                            Ao VTI
                                           Ao acel
                                            Ao ET
                                         Ao ac/ET
                                              MV E
                                              MV A
                                           MV E/A
                                            MV DT
                                         Rad vel-S
                                        Rad vel-EA
                                              ST-S
                                            ST-EA
                                              SR-S
                                            SR-EA

                                                                                                                                                                                                                   associated losses in skeletal muscle per se, but it can enhance
                                                                                                                                                                                                                   musculature to the degree that may avoid some related
                                                                                                                                                                                                                   complications. The equally enhanced weights of muscles with
       B                                                                                     Cardiac stress test; male
                                                                                                                                                                                                                   different fiber types further suggests that a MstnK/K
                                  150                                                                                                                                                                              environment could potentially avoid the loss of type II fibers
                                                                                                                                            WT, male + ISO
                                                                                                        *
                                                                                                                                            Mstn–/–, male + ISO
       ISO response (% change)

                                  100
                                                                                                                                                                                                                   Figure 5 Resting and stress-induced cardiac performance.
                                                                                                             *                                                                                                     (A) Echocardiography was performed on the LV parasternal long
                                   50                                                                                                                                                                              axis, left parasternal short axis, subcostal long axis, and endocardial
                                                                                                                                                                                                                   short axis views. Data are presented as percentage differences from
                                    0                                                                                                                                                                              WT values, which are represented by the horizontal dashed line
                                                                                                                                                                                                                   (LVIDd, left ventricle internal diameter (end diastole, mm); LVIDs,
                                  –50                                                                                                                                                                              LVID systole; IVSd, intraventricular septum (dimension end diastole,
                                                                                                                                                                                                                   mm); LVWd, LV wall dimension (systole, mm); LV mass, left
                                 –100                                                                                                                                                                              ventricular mass (g); Diast vol, LV end diastolic volume (ml); Syst vol,
                                                                                                       FS
                                                                                                            EF

                                                                                                                                                                                                         HR
                                        LVIDd
                                                      LVIDs
                                                              IVSd
                                                                     LVWd
                                                                                Diast vol
                                                                                            Syst vol

                                                                                                                 St vol
                                                                                                                          C.O.
                                                                                                                                 LV IVRT
                                                                                                                                           Ao velo
                                                                                                                                                         Ao VTI
                                                                                                                                                                  Ao acel
                                                                                                                                                                             Ao ET
                                                                                                                                                                                         Ao ac/ET

                                                                                                                                                                                                                   LV end systolic volume (ml); FS, percentage of fractional shortening;
                                                                                                                                                                                                                   EF, percentage of ejection fraction; St. vol, stroke volume; C.O.,
                                                                                                                                                                                                                   cardiac output; LV IVRT, LV isovolumic relaxation time (ms); HR,
                                                                                                                                                                                                                   heart rate (beats/min); Ao velo, max aortic ejection velocity (cm/s);
       C                                                                                    Cardiac stress test; female                                                                                            VTI, velocity time integral (cm); acel, ejection acceleration time
                                  150                                                                                                                                                                              (ms); ET, ejection time (ms); ac/ET, ratio of acel to ET; MV E, max LV
                                                                                                       *                            WT, female + ISO
                                                                                                                                    Mstn–/–, female + ISO                                                          early filling velocity (cm/s); MV A, max LV late filling (atrial
       ISO response (% change)

                                  100                                                                                                                                                                              contraction) velocity (cm/s); MV E/A, ratio of E to A velocities; MV
                                                                                                            *                                                                                                      DT, deceleration time of early LV filling (ms); Rad vel-S, radial
                                   50                                                                                                                                                                              velocity during ventricular systole (cm/s); Rad vel-EA, radial velocity
                                                                                                                                                                                                                   during diastole (early and late filling combined, cm/s); ST-S, LV strain
                                    0                                  *                                                                                                                                           during ventricular systole (%); ST-EA, LV strain during diastole (early
                                                                                                                                                                                                                   and late filling combined, %); SR-S, LV strain rate during ventricular
                                  –50
                                          *                                                                                                                                                                        systole (1/s); SR-EA, LV strain rate during diastole (early and late
                                                        *                           *                                                                                                                              filling combined, 1/s); NA, not applicable due to insufficient n).
                                 –100                                                           *                                                                                                                  (B and C) Male (B) or female (C) mice were injected i.p. with
                                                                                                                                                                                                                   10 mg/kg of isoproterenol (ISO) and then assessed by echocardio-
                                        LVIDd
                                                      LVIDs
                                                              IVSd
                                                                     LVWd
                                                                                Diast vol
                                                                                            Syst vol
                                                                                                       FS
                                                                                                            EF
                                                                                                                 St vol
                                                                                                                          C.O.
                                                                                                                                 LV IVRT
                                                                                                                                           Ao velo
                                                                                                                                                         Ao VTI
                                                                                                                                                                  Ao acel
                                                                                                                                                                             Ao ET
                                                                                                                                                                                         Ao ac/ET
                                                                                                                                                                                                         HR

                                                                                                                                                                                                                   graphy. Asterisks denote significant differences (nZ5 or 6; average
                                                                                                                                                                                                                   ageZ14 m.o. for female and 13 m.o. for male; P%0.05).

      Journal of Endocrinology (2012) 213, 263–275                                                                                                                                                                                                          www.endocrinology-journals.org

                                                                                                                                                                                                                                          Downloaded from Bioscientifica.com at 11/04/2021 01:38:22AM
                                                                                                                                                                                                                                                                                        via free access
Aging myostatin null phenotype .                    M F JACKSON     and others 271

           Table 1 Cardiac performance in WT and MstnK/K mice

           Parameter                             WT                          WTCISO                        MstnK/K                    MstnK/KCISO

           LVIDd (M)                     3.68G0.24a                   2.78G0.38 (4)b                3.80G0.11a                        2.96G0.13b
           LVIDd (F)                     3.32G0.27a                   2.90G0.12a,b                  3.74G0.18a                        2.76G0.10b
           LVIDs (M)                     2.14G0.24a                   0.95G0.13 (4)c                2.76G0.09b                        1.33G0.17c
           LVIDs (F)                     1.83G0.20a                   1.31G0.15a,c                  2.66G0.27b                        1.30G0.04c
           LVWd (M)                      1.03G0.12a                   1.12G0.08 (4)a                1.00G0.05a                        1.07G0.07a
           LVWd (F)                      1.05G0.08a                   1.23G0.04a                    0.88G0.05a,b                      0.87G0.03b
           Diast vol (M)                0.059G0.009a                 0.032G0.01 (4)b               0.062G0.004a                      0.034G0.003b
           Diast vol (F)                0.047G0.008a                 0.033G0.003a,b                0.061G0.007a                      0.029G0.003b
           Syst vol (M)                 0.016G0.004a                 0.002G0.001 (4)c              0.029G0.002b                      0.005G0.002c
           Syst vol (F)                 0.011G0.003a                 0.005G0.001a,c                0.028G0.007b                      0.004G0.0003c
           FS (M)                        41.4G4.3a                    66.8G2.3 (4)c                 27.2G2.0b                         56.8G3.1c
           FS (F)                        45.2G3.3a                    56.3G3.2c,d                   28.6G4.2b                         52.2G0.6d
           EF (M)                        77.6G4.4a                    95.8G0.9 (4)c                 59.8G3.1b                         90.2G2.3c
           EF (F)                        80.8G4.0a                    90.2G2.0a,c                   60.6G6.5b                         88.6G0.4c
           Ao velo (M)                   61.1G2.7a                    78.7G7.2a,b                   63.2G2.7a                         90.0G6.5b
           Ao velo (F)                   52.1G4.6a                    67.0G7.5a                     57.2G3.3a                         61.7G4.2a
           Ao VTI (M)                    2.38G0.21a                   3.34G0.46a,b                  2.44G0.14a                        3.82G0.35b
           Ao VTI (F)                    2.23G0.17a                   2.88G0.26a                    2.50G0.23a                        2.64G0.16a
           Ao acel (M)                   17.6G1.0a                    20.6G4.1a                     15.8G1.7a                         14.0G2.1a
           Ao acel (F)                   16.0G1.6a                    21.5G2.3a                     14.2G1.4a,b                       12.8G2.4b
           MV E (M)                      50.1G0.9 (4)a                      NA                      51.4G1.6 (4)a                     63.5G16.5A
           MV E (F)                      46.6G1.8A                          NA                      47.7G6.9A                         52.2G19.8A
           MV A (M)                      26.8G3.3 (4)a                      NA                      36.5G2.4 (4)b                     41.5G9.5A
           MV A (F)                      25.7G5.0A                          NA                      33.8G12.3A                        40.3G3.3A
           MV E/A (M)                    1.98G0.23 (4)a                     NA                      1.43G0.09 (4)b                    1.55G0.05A
           MV E/A (F)                    1.87G0.26A                         NA                      1.76G0.50A                        1.30G0.60A
           MV DT (M)                     30.6G2.8a                    39.0G2.2b                     26.4G1.9a                         34.0G2.0a,b
           MV DT (F)                     31.4G0.8 (4)a                37.0G1.63a                    32.2G0.5a                         32.4G4.6a
           HR (M)                         420G8.4a                     482G2.0b                      450G14.8a                         506G7.5b
           HR (F)                         406G23.0a                    432G21.8a                     424G9.8a                          482G16.4 (4)a
           Rad vel-S (M)                  1.1G0.15 (4)a                     NA                      0.74G0.10b                            NA
           Rad vel-S (F)                 0.74G0.07a                         NA                      0.49G0.04 (4)b                        NA
           Rad vel-EA (M)               K0.96G0.11 (4)a                     NA                     K0.63G0.09b                            NA
           Rad vel-EA (F)               K0.73G0.13a                         NA                     K0.41G0.005 (4)b                       NA
           ST-S (M)                     K20.5G2.5 (4)a                      NA                     K16.9G2.3a                             NA
           ST-S (F)                     K20.3G1.9a                          NA                     K14.8G2.3 (4)a                         NA
           ST-EA (M)                     14.3G4.1 (4)a                      NA                      7.40G1.08b                            NA
           ST-EA (F)                     10.6G2.52                          NA                      3.65G0.41A                            NA
           SR-S (M)                     K7.43G1.02 (4)a                     NA                     K5.22G0.82a                            NA
           SR-S (F)                     K5.06G0.59a                         NA                     K3.85G0.39 (4)a                        NA
           SR-EA (M)                      6.6G1.12 (4)a                     NA                      4.44G0.73a                            NA
           SR-EA (F)                     5.14G0.66a                         NA                      3.13G0.25 (4)b                        NA

           Refer to Fig. 5 for definition of abbreviations. NA, not available. Different letters denote statistical differences, the same letters represent
           no difference and male (M) and females (F) were assessed separately. (average ageZ14 m.o. for female and 13 m.o. for male).
           A
            Not statistically assessed due to insufficient replicates; nZ5, 6 unless otherwise noted in parentheses.

and enrichment of type I fibers that normally occurs with                             mice, this difference is lost in aging mice due to greater
aging. This is in fact supported by recent studies that                               adiposity in wild types (Fig. 1A). These differences were more
quantified age-related changes in fiber type and size among                           prominent in ‘middle age’ and senescent females and were
WT and MstnK/K mice (Siriett et al. 2006, Matsakas et al.                             reflected in fat pad weights and in adipocyte number and size
2009). Muscles of senescent MstnK/K mice also regenerate                              (Figs 2 and 4). Previous studies reported similar differences in
quicker from chronic or acute injury (Wagner et al. 2005) and                         7–9 w.o. and 9–10 m.o. male WAT (McPherron & Lee 2002,
short-term attenuation of myostatin restores muscle regen-                            Dilger et al. 2010) and our data indicate that BAT is also
erative properties (Siriett et al. 2007). Thus, myostatin-                            affected. In addition, we identified sexually dimorphic
attenuating therapies could be potentially used to prevent                            differences in WAT and BAT that were age dependent in
skeletal muscle loss and/or to restore damaged or atrophied                           that some differences were detected only in females at middle
muscle in the elderly.                                                                age, but in both sexes at senescence. Such sex- and depot-
   Although the enhanced musculature in young MstnK/K                                 dependent differences may simply be due to the lower % body
mice results in heavier body weights compared with WT                                 fat in female rather than in male MstnK/K mice (Fig. 1A).

www.endocrinology-journals.org                                                                                       Journal of Endocrinology (2012) 213, 263–275

                                                                                                                     Downloaded from Bioscientifica.com at 11/04/2021 01:38:22AM
                                                                                                                                                                   via free access
272   M F JACKSON   and others . Aging myostatin null phenotype

      However, it is also possible that myostatin influences              atrophy (Artaza et al. 2007, Bish et al. 2010). We have
      adipogenesis directly. In fact, myostatin is expressed at low       previously reported eccentric cardiac hypertrophy in 7 m.o.
      levels in adipose tissue and has been hypothesized to stimulate     MstnK/K mice (Rodgers et al. 2009), although heart weights
      or inhibit adipogenesis (Rodgers & Garikipati 2008).                were normalized to tail lengths, rather than to body weights,
      However, feed intake is normal in MstnK/K mice despite a            as we believe the latter misrepresents the phenotype.
      higher total energy expenditure (McPherron & Lee 2002,              Myostatin inhibits the growth of cardiac and skeletal muscle
      Choi et al. 2011). Guo et al. (2009) determined that myostatin      and, hence, both numerator and denominator when normal-
      attenuation in skeletal muscle, but not adipose tissue,             izing heart weight to body weight. Similar problems occur
      decreases fat mass and improves glucose homeostasis via the         when experimenting with older mice as treatments can often
      diversion of carbohydrates away from adipose stores and into        disproportionately affect body morphology as well as heart
      muscle. This suggests that the reduced adiposity in MstnK/K         weight, necessitating the use of tibia or tail length for
      mice, regardless of age, is likely due to muscle depletion of       normalization (Yin et al. 1982). This likely explains why
      metabolic reserves rather than to direct effects on adipogenesis    studies that normalized to body weights failed to identify
      or to fat turnover.                                                 cardiac hypertrophy.
         Bone mineral density was w6% smaller in male but not in             Physiological concentric hypertrophy arises from isometric
      female MstnK/K mice (Fig. 1B), although other studies report        exercise that also significantly increases skeletal muscle mass.
      increased density and regeneration with activin/myostatin           By contrast, physiological eccentric hypertrophy results from
      receptor antagonism (Kellum et al. 2009, Zhou et al. 2010) or       aerobic exercise, which does not increase skeletal muscle mass
      higher density in young and senescent MstnK/K mice                  (McMullen & Jennings 2007, Catalucci et al. 2008). Thus, the
      (Hamrick et al. 2002, 2003, Hamrick 2003, Morissette et al.         eccentric hypertrophy that develops in MstnK/K mice or
      2009). We have previously reported that age-dependent               with myostatin attenuation does not appear to be a
      changes in aggregate bone growth (tail and tibia length) and        compensatory response to the increased load brought upon
      bone growth rate (tibia epiphyseal plate width) are similar in      by enhanced skeletal muscle growth as this would have
      WT and MstnK/K mice (Williams et al. 2011). It is unknown,          produced concentric rather than eccentric hypertrophy.
      therefore, why the small difference was noted in the current        Several apparent systolic and diastolic dysfunctions were also
      study. Nevertheless, differences were also detected in other        detected in resting hearts as FS, ES, radial velocity, and
      nonmuscle tissues as liver, kidney, and spleen weights were         myocardial strain measurements were lower in aging
      smaller in MstnK/K mice of both sexes (Fig. 1D). We have            MstnK/K mice. Many elite human and canine athletes
      recently reported that liver expression of IGF1 as well as the      (e.g. Tour de France cyclists, triathletes, racing greyhound
      total and estimated free levels in circulation are higher in        and whippets, and sled dogs) possess eccentric physiological
      young adult (7 m.o.) MstnK/K mice than in age-matched               hypertrophy that is remarkably similar to that of MstnK/K
      WT mice (Williams et al. 2011). As with aging MstnK/K               mice. This often includes reduced EF and FS in resting hearts
      mice, liver weights are also smaller in these mice as well as in    (Rippe et al. 1982, Pape et al. 1984, Schaible et al. 1986, Colan
      juvenile (1–3 m.o.) MstnK/K mice (Lin et al. 2002), which is        1992, Snyder et al. 1995, Lonsdale et al. 1998, Stepien et al.
      consistent with increased negative feedback on pituitary GH,        1998, Whyte et al. 2000, Bavegems et al. 2005, 2007).
      the primary regulator of liver size (Ohlsson et al. 2009).          Reductions in these parameters are not necessarily patho-
      Myostatin’s role in the spleen is unknown, although it is           logical as cardiac output is normal in all these subjects
      minimally expressed in the spleens of zebrafish and mice and is     including MstnK/K mice. In fact, EF and FS values rise to
      significantly upregulated when the former are stressed              expected levels when elite athletes stop training (Pavlik et al.
      (Helterline et al. 2007). No cellular phenotype was detected        1986, Snyder et al. 1995) as the reductions are due to reduced
      in any of these tissues, indicating that the differences were       relative preload in the presence of enhanced after load at rest
      likely due to tissue hypoplasia or atrophy. Regardless, these       (Abergel et al. 2004), which was interestingly demonstrated in
      results together suggest that the development of enhanced           MstnK/K mice by the ISO stress tests. Indeed, the ISO-
      muscling in young and old MstnK/K mice may impact other             induced change in FS and EF was significantly greater in both
      nonmuscle tissues.                                                  young (Rodgers et al. 2009) and aging MstnK/K mice
         Several early studies documented myostatin expression in         (Fig. 5B and C). It is unknown why the enhanced
      the hearts of different animal models including nonmamma-           responsiveness to ISO was more prominent in female than
      lian vertebrates (Rodgers & Garikipati 2008). More recent           male MstnK/K hearts nor why differences in internal volumes
      studies have further demonstrated myostatin inhibition of           were similarly greater in females. These data are consistent,
      different cardiac muscle growth processes in vitro and in vivo      however, with sexual dimorphism in other MstnK/K tissues
      (Shyu et al. 2005, Morissette et al. 2006, Artaza et al. 2007,      and suggest that sexual development, or even gonadal steroids,
      McKoy et al. 2007, Rodgers et al. 2009, Bish et al. 2010, Zhou      predispose tissues differentially to the effects of myostatin or
      et al. 2010). It is surprising, therefore, that some studies have   even its attenuation.
      failed to identify cardiac hypertrophy in MstnK/K mice                 Morissette et al. (2009) recently reported that left ventricle
      (Morissette et al. 2006, Cohn et al. 2007, Heineke et al. 2010)     chamber volumes were smaller and FS was greater in
      especially as overexpressing myostatin stimulates cardiac           senescent (27–37 m.o.) MstnK/K than WT mice. This

      Journal of Endocrinology (2012) 213, 263–275                                                               www.endocrinology-journals.org

                                                                                               Downloaded from Bioscientifica.com at 11/04/2021 01:38:22AM
                                                                                                                                             via free access
Aging myostatin null phenotype .                 M F JACKSON     and others 273

conflicts with their previous study where these parameters                          Funding
were similar in 8 w.o. WT and MstnK/K mice. It also conflicts
with our previous study (Rodgers et al. 2009) using 7 m.o.                          These studies were supported by a grant from the National Science
                                                                                    Foundation (0840644) to B D R.
adults and with the data presented herein, both of which
indicate exactly the opposite. These studies together suggest
that a cardiac phenotype slowly develops in a MstnK/K
environment and may not be readily recognized in young
                                                                                    References
animals, which is in fact reflected by age-associated changes in
heart weight (Rodgers et al. 2009). Functionally, however, the                      Abergel E, Chatellier G, Hagege AA, Oblak A, Linhart A, Ducardonnet A &
phenotype first presents in young adults and includes notable                         Menard J 2004 Serial left ventricular adaptations in world-class professional
contractile dysfunctions at rest but enhanced functional                              cyclists: implications for disease screening and follow-up. Journal of the
reserve. The phenotype appears to change with age, as                                 American College of Cardiology 44 144–149. (doi:10.1016/j.jacc.2004.02.
                                                                                      057)
many aspects of normal cardiac senescence, reduced                                  Artaza JN, Reisz-Porszasz S, Dow JS, Kloner RA, Tsao J, Bhasin S &
contractility for example (Morissette et al. 2009), are less                          Gonzalez-Cadavid NF 2007 Alterations in myostatin expression are
pronounced in senescent MstnK/K mice. More mechanistic                                associated with changes in cardiac left ventricular mass but not ejection
studies are nevertheless required to determine whether                                fraction in the mouse. Journal of Endocrinology 194 63–76. (doi:10.1677/
enhanced contractility and ISO responsiveness are due to                              JOE-07-0072)
                                                                                    Bavegems V, Van Caelenberg A, Duchateau L, Sys SU, Van Bree H &
similarly enhanced bAR signaling or elevated levels and                               De Rick A 2005 Vertebral heart size ranges specific for whippets.
activity of Ca2C handling proteins.                                                   Veterinary Radiology & Ultrasound 46 400–403. (doi:10.1111/j.1740-8261.
   Future studies will also determine the clinical relevance of                       2005.00073.x)
myostatin attenuation in different tissues as well as the                           Bavegems V, Duchateau L, Sys SU & De Rick A 2007 Echocardiographic
                                                                                      reference values in whippets. Veterinary Radiology & Ultrasound 48 230–238.
evolutionary significance of MstnK/K phenotypes, or possibly
                                                                                      (doi:10.1111/j.1740-8261.2007.00234.x)
more importantly, the lack thereof. In fact, many clinically                        Bish LT, Morine KJ, Sleeper MM & Sweeney HL 2010 Myostatin is
relevant tissues and organ systems that are affected by aging are                     upregulated following stress in an Erk-dependent manner and negatively
also impacted by myostatin. These naturally include skeletal                          regulates cardiomyocyte growth in culture and in a mouse model. PLoS
muscle as well as cardiac muscle, adipose tissue, and possibly                        ONE 5 e10230. (doi:10.1371/journal.pone.0010230)
                                                                                    Bogdanovich S, Perkins KJ, Krag TO, Whittemore LA & Khurana TS 2005
bone. Changes in adiposity have the potential to impact other                         Myostatin propeptide-mediated amelioration of dystrophic pathophysiol-
physiological systems, thermogenesis, and reproduction in                             ogy. FASEB Journal 19 543–549. (doi:10.1096/fj.04-2796com)
particular. This in turn may explain why MstnK/K                                    Catalucci D, Latronico MV, Ellingsen O & Condorelli G 2008 Physiological
phenotypes have not been described in nature as the relative                          myocardial hypertrophy: how and why? Frontiers in Bioscience 13 312–324.
                                                                                      (doi:10.2741/2681)
gains in fitness brought upon by ‘double muscling’ would
                                                                                    Choi SJ, Yablonka-Reuveni Z, Kaiyala KJ, Ogimoto K, Schwartz MW &
hypothetically be balanced by comparable costs. Clinically,                           Wisse BE 2011 Increased energy expenditure and leptin sensitivity account
however, attenuating myostatin has great potential and could                          for low fat mass in myostatin deficient mice. American Journal of Physiology.
possibly be used to treat obesity and type 2 diabetes especially                      Endocrinology and Metabolism 300 E1031–E1037. (doi:10.1152/ajpendo.
as glucose homeostasis is improved in a MstnK/K environ-                              00656.2010)
                                                                                    Cohn RD, Liang HY, Shetty R, Abraham T & Wagner KR 2007 Myostatin
ment (McPherron & Lee 2002, Guo et al. 2009, Morissette                               does not regulate cardiac hypertrophy or fibrosis. Neuromuscular Disorders 17
et al. 2009). The MstnK/K cardiac phenotype resembles                                 290–296. (doi:10.1016/j.nmd.2007.01.011)
physiological, not pathological, hypertrophy in many ways                           Colan SD 1992 Mechanics of left ventricular systolic and diastolic function in
that include enhanced ISO responsiveness and Ca2C                                     physiologic hypertrophy of the athlete heart. Cardiology Clinics 10 227–240.
                                                                                    Cook SA, Matsui T, Li L & Rosenzweig A 2002 Transcriptional effects of
handling, reduced age-associated fibrosis (Morissette et al.
                                                                                      chronic Akt activation in the heart. Journal of Biological Chemistry 277
2009), and normal fetal gene expression profiles (Rodgers                             22528–22533. (doi:10.1074/jbc.M201462200)
et al. 2009). The contractile dysfunction at rest, however,                         Cruz-Jentoft AJ, Landi F, Topinkova E & Michel JP 2010 Understanding
raises some concern just as it does in many elite athletes.                           sarcopenia as a geriatric syndrome. Current Opinion in Clinical Nutrition and
Future studies are therefore needed to determine whether the                          Metabolic Care 13 1–7. (doi:10.1097/MCO.0b013e328333c1c1)
                                                                                    Dilger AC, Spurlock ME, Grant AL & Gerrard DE 2010 Myostatin null mice
myostatin-blocking technologies currently being developed                             respond differently to dietary-induced and genetic obesity. Animal Science
to treat skeletal muscle disorders (Khurana & Davies 2003,                            Journal 81 586–593. (doi:10.1111/j.1740-0929.2010.00776.x)
Bogdanovich et al. 2005, Zhou et al. 2010) may also be                              Gaussin V & Depre C 2005 Myostatin, the cardiac chalone of insulin-like
appropriate for treating cardiac disorders and in addition,                           growth factor-1. Cardiovascular Research 68 347–349. (doi:10.1016/j.
whether myostatin is directly or indirectly responsible for the                       cardiores.2005.09.007)
                                                                                    George I, Bish LT, Kamalakkannan G, Petrilli CM, Oz MC, Naka Y,
differences described herein.                                                         Sweeney HL & Maybaum S 2010 Myostatin activation in patients with
                                                                                      advanced heart failure and after mechanical unloading. European
                                                                                      Journal of Heart Failure 12 444–453. (doi:10.1093/eurjhf/hfq039)
Declaration of interest                                                             Guo T, Jou W, Chanturiya T, Portas J, Gavrilova O & McPherron AC 2009
                                                                                      Myostatin inhibition in muscle, but not adipose tissue, decreases fat mass
The authors declare that there is no conflict of interest that could be perceived     and improves insulin sensitivity. PLoS ONE 4 e4937. (doi:10.1371/journal.
as prejudicing the impartiality of the research reported.                             pone.0004937)

www.endocrinology-journals.org                                                                                    Journal of Endocrinology (2012) 213, 263–275

                                                                                                                 Downloaded from Bioscientifica.com at 11/04/2021 01:38:22AM
                                                                                                                                                               via free access
274   M F JACKSON    and others . Aging myostatin null phenotype

      Hamrick MW 2003 Increased bone mineral density in the femora of GDF8               Ohlsson C, Mohan S, Sjogren K, Tivesten A, Isgaard J, Isaksson O, Jansson JO
        knockout mice. Anatomical Record 272A 388–391. (doi:10.1002/ar.a.                   & Svensson J 2009 The role of liver-derived insulin-like growth factor-I.
        10044)                                                                              Endocrine Reviews 30 494–535. (doi:10.1210/er.2009-0010)
      Hamrick MW, McPherron AC & Lovejoy CO 2002 Bone mineral content                    Pape LA, Rippe JM, Walker WS, Weiner BH, Ockene IS, Paraskos JA,
        and density in the humerus of adult myostatin- deficient mice. Calcified            Alpert JS, Kotilainin P & Matthews M 1984 Effects of the cessation of
        Tissue International 13 13.                                                         training on left-ventricular function in the racing greyhound – serial studies
      Hamrick MW, Pennington C & Byron CD 2003 Bone architecture and disc                   in a model of cardiac-hypertrophy. Basic Research in Cardiology 79 98–109.
        degeneration in the lumbar spine of mice lacking GDF-8 (myostatin).                 (doi:10.1007/BF01935812)
        Journal of Orthopaedic Research 21 1025–1032. (doi:10.1016/S0736-                Pavlik G, Bachl N, Wollein W, Langfy G & Prokop L 1986 Resting
        0266(03)00105-0)                                                                    echocardiographic parameters after cessation of regular endurance training.
      Heineke J, Auger-Messier M, Xu J, Sargent M, York A, Welle S &                        International Journal of Sports Medicine 7 226–231. (doi:10.1055/s-2008-
        Molkentin JD 2010 Genetic deletion of myostatin from the heart                      1025764)
        prevents skeletal muscle atrophy in heart failure. Circulation 121               Rippe JM, Pape LA, Alpert JS, Ockene IS, Paraskos JA, Kotilainen P, Anas J &
        419–425. (doi:10.1161/CIRCULATIONAHA.109.882068)                                    Webster W 1982 Studies of systolic mechanics and diastolic behavior of the
      Helterline DL, Garikipati D, Stenkamp DL & Rodgers BD 2007 Embryonic                  left-ventricle in the trained racing greyhound. Basic Research in Cardiology 77
        and tissue-specific regulation of myostatin-1 and -2 gene expression in             619–644. (doi:10.1007/BF01908315)
        zebrafish. General and Comparative Endocrinology 151 90–97. (doi:10.1016/j.      Rodgers BD & Garikipati DK 2008 Clinical, agricultural, and evolutionary
        ygcen.2006.12.023)                                                                  biology of myostatin: a comparative review. Endocrine Reviews 29 513–534.
      Kellum E, Starr H, Arounleut P, Immel D, Fulzele S, Wenger K &                        (doi:10.1210/er.2008-0003)
        Hamrick MW 2009 Myostatin (GDF-8) deficiency increases fracture callus           Rodgers BD, Interlichia JP, Garikipati DK, Mamidi R, Chandra M,
        size, Sox-5 expression, and callus bone volume. Bone 44 17–23.                      Nelson OL, Murry CE & Santana LF 2009 Myostatin represses
        (doi:10.1016/j.bone.2008.08.126)                                                    physiological hypertrophy of the heart and excitation–contraction
      Khurana TS & Davies KE 2003 Pharmacological strategies for muscular                   coupling. Journal of Physiology 587 4873–4886. (doi:10.1113/jphysiol.2009.
        dystrophy. Nature Reviews. Drug Discovery 2 379–390. (doi:10.1038/                  172544)
        nrd1085)                                                                         Saghir M, Areces M & Makan M 2007 Strain rate imaging differentiates
      Lang T, Streeper T, Cawthon P, Baldwin K, Taaffe DR & Harris TB 2010                  hypertensive cardiac hypertrophy from physiologic cardiac hypertrophy
        Sarcopenia: etiology, clinical consequences, intervention, and assessment.          (athlete’s heart). Journal of the American Society of Echocardiography 20
        Osteoporosis International 21 543–559. (doi:10.1007/s00198-009-1059-y)              151–157. (doi:10.1016/j.echo.2006.08.006)
      Lebrasseur NK, Schelhorn TM, Bernardo BL, Cosgrove PG, Loria PM &                  Schaible TF, Malhotra A, Ciambrone GJ & Scheuer J 1986 Chronic
        Brown TA 2009 Myostatin inhibition enhances the effects of exercise on              swimming reverses cardiac dysfunction and myosin abnormalities in
        performance and metabolic outcomes in aged mice inhibition enhances the             hypertensive rats. Journal of Applied Physiology 60 1435–1441.
        effects of exercise on performance and metabolic outcomes in aged mice.          Sharma M, Kambadur R, Matthews KG, Somers WG, Devlin GP, Conaglen JV,
        Journal of Gerontology: Biological Sciences 64A 940–948. (doi:10.1093/              Fowke PJ & Bass JJ 1999 Myostatin, a transforming growth factor-beta
        gerona/glp068)                                                                      superfamily member, is expressed in heart muscle and is upregulated in
      Lin J, Arnold HB, Della-Fera MA, Azain MJ, Hartzell DL & Baile CA 2002                cardiomyocytes after infarct. Journal of Cellular Physiology 180 1–9.
        Myostatin knockout in mice increases myogenesis and decreases                       (doi:10.1002/(SICI)1097-4652(199907)180:1!1::AID-JCP1O3.0.CO;2-V)
        adipogenesis. Biochemical and Biophysical Research Communications 291            Shyu KG, Ko WH, Yang WS, Wang BW & Kuan P 2005 Insulin-like growth
        701–706. (doi:10.1006/bbrc.2002.6500)                                               factor-1 mediates stretch-induced upregulation of myostatin expression in
      Lonsdale RA, Labuc RH & Robertson ID 1998 Echocardiographic                           neonatal rat cardiomyocytes. Cardiovascular Research 68 405–414.
        parameters in training compared with non-training greyhounds. Veterinary            (doi:10.1016/j.cardiores.2005.06.028)
        Radiology & Ultrasound 39 325–330. (doi:10.1111/j.1740-8261.1998.                Shyu KG, Lu MJ, Wang BW, Sun HY & Chang H 2006 Myostatin expression
        tb01615.x)                                                                          in ventricular myocardium in a rat model of volume-overload heart failure.
      Matsakas A, Foster K, Otto A, Macharia R, Elashry MI, Feist S, Graham I,              European Journal of Clinical Investigation 36 713–719. (doi:10.1111/j.1365-
        Foster H, Yaworsky P, Walsh F et al. 2009 Molecular, cellular and                   2362.2006.01718.x)
        physiological investigation of myostatin propeptide-mediated muscle              Siriett V, Platt L, Salerno MS, Ling N, Kambadur R & Sharma M 2006
        growth in adult mice. Neuromuscular Disorders 19 489–499. (doi:10.1016/j.           Prolonged absence of myostatin reduces sarcopenia. Journal of Cellular
        nmd.2009.06.367)                                                                    Physiology 209 866–873. (doi:10.1002/jcp.20778)
      McKoy G, Bicknell KA, Patel K & Brooks G 2007 Developmental expression             Siriett V, Salerno MS, Berry C, Nicholas G, Bower R, Kambadur R &
        of myostatin in cardiomyocytes and its effect on foetal and neonatal rat            Sharma M 2007 Antagonism of myostatin enhances muscle regeneration
        cardiomyocyte proliferation. Cardiovascular Research 74 304–312.                    during sarcopenia. Molecular Therapy 15 1463–1470. (doi:10.1038/sj.mt.
        (doi:10.1016/j.cardiores.2007.02.023)                                               6300182)
      McMullen JR & Jennings GL 2007 Differences between pathological and                Snyder PS, Sato T & Atkins CE 1995 A comparison of echocardiographic
        physiological cardiac hypertrophy: novel therapeutic strategies to treat heart      indexes of the nonracing, healthy greyhound to reference values from other
        failure. Clinical and Experimental Pharmacology & Physiology 34 255–262.            breeds. Veterinary Radiology & Ultrasound 36 387–392. (doi:10.1111/j.1740-
        (doi:10.1111/j.1440-1681.2007.04585.x)                                              8261.1995.tb00283.x)
      McPherron AC & Lee SJ 2002 Suppression of body fat accumulation in                 Stepien RL, Hinchcliff KW, Constable PD & Olson J 1998 Effect of
        myostatin-deficient mice. Journal of Clinical Investigation 109 595–601.            endurance training on cardiac morphology in Alaskan sled dogs. Journal of
        (doi:10.1172/JCI13562)                                                              Applied Physiology 85 1368–1375.
      Morissette MR, Cook SA, Foo S, McKoy G, Ashida N, Novikov M,                       Valdivia HH 2009 Take it to heart: myostatin inhibition, mighty mouse and
        Scherrer-Crosbie M, Li L, Matsui T, Brooks G et al. 2006 Myostatin                  the quest for a competitive edge. Journal of Physiology 587 5005.
        regulates cardiomyocyte growth through modulation of Akt signaling.                 (doi:10.1113/jphysiol.2009.181487)
        Circulation Research 99 15–24. (doi:10.1161/01.RES.0000231290.                   Wagner KR, Liu X, Chang X & Allen RE 2005 Muscle regeneration in the
        45676.d4)                                                                           prolonged absence of myostatin. PNAS 102 2519–2524. (doi:10.1073/
      Morissette MR, Stricker JC, Rosenberg MA, Buranasombati C, Levitan EB,                pnas.0408729102)
        Mittleman MA & Rosenzweig A 2009 Effects of myostatin deletion in                Whyte G, Lumley S, George K, Gates P, Sharma S, Prasad K & McKenna WJ 2000
        aging mice. Aging Cell 8 573–583. (doi:10.1111/j.1474-9726.2009.                    Physiological profile and predictors of cycling performance in ultra-endurance
        00508.x)                                                                            triathletes. Journal of Sports Medicine and Physical Fitness 40 103–109.

      Journal of Endocrinology (2012) 213, 263–275                                                                                     www.endocrinology-journals.org

                                                                                                                    Downloaded from Bioscientifica.com at 11/04/2021 01:38:22AM
                                                                                                                                                                  via free access
You can also read