Mapping Cropland Abandonment in Mountainous Areas Using an Annual Land-Use Trajectory Approach
←
→
Page content transcription
If your browser does not render page correctly, please read the page content below
Article
Mapping Cropland Abandonment in
Mountainous Areas Using an Annual Land-Use
Trajectory Approach
Wei Song
 Key Laboratory of Land Surface Pattern and Simulation, Institute of Geographic Sciences and Natural
 Resources Research, Chinese Academy of Sciences, Beijing 100101, China; songw@igsnrr.ac.cn

 Received: 4 July 2019; Accepted: 24 October 2019; Published: 25 October 2019

 Abstract: In recent years, with the unceasing acceleration of China’s urbanization and rapid
 development of the country’s economy, cropland abandonment has become an ongoing issue,
 especially in mountainous areas. Mapping abandoned cropland using remote sensing
 technology is still challenging due to the difficulties in distinguishing abandoned cropland
 from fallowed land. In addition, there are few credible approaches to map timing and
 recultivation of abandoned cropland. In this context, this research developed an annual land-
 use trajectory approach to map different types of abandoned cropland based on freely
 available Landsat and HJ-1 satellite images with a spatial resolution of 30 m. Based on this
 method, five types of cropland change, including one type of fallowed land and two types of
 abandoned land, were identified in a mountainous town of China (Zhongduo). In addition,
 the timing and recultivation of abandoned cropland were assessed. The accuracy of the
 abandonment map was assessed as high as 86.67%. It was found that the percentages of
 spontaneous abandoned, induced abandoned, fallowed, stable, and lost cropland in
 Zhongduo were 23.16%, 8.40%, 13.69%, 27.84%, and 26.91% from 2012 to 2017, respectively.
 The average time for spontaneously abandoned cropland was 3.45 years. Furthermore, 50.54%
 of the spontaneously abandoned cropland and 12.91% of induced abandoned cropland were
 recultivated due to fluctuating prices of agricultural products and materials, and the
 implemented land transfer policy.

 Keywords: cropland abandonment; annual land-use trajectory; CART algorithm;
 mountainous areas; Zhongduo Town; China

1. Introduction
     Cropland abandonment, an extreme manifestation of land marginalization [1], is an
ongoing trend in both developed and developing countries worldwide [2], attracting great
attention at a global level [2–5]. Due to rapid economic growth, urbanization and
industrialization have been vigorously promoted in recent years, accelerating the transfer of
the large rural labor force to urban areas [6]. In 2000, the number of rural migrant workers in
Chinese cities reached 150 million; this figure increased to 269 million in 2013, accounting for
60–70% of the total rural labor population [7]. Due to the combined influences of rural-to-urban
migrations and other natural socio-economic factors, cropland abandonment in China has
intensified, making it an important issue.
     Briefly, cropland abandonment is described as the cessation of cultivation in cropland for
a certain period. However, the defined period of ceased cultivation remains the subject of
debate [8]. For example, the Food and Agriculture Organization (FAO) defined abandoned
cropland as cropland that has not been utilized for agricultural production or other agricultural

Sustainability 2019, 11, 5951; doi:10.3390/su11215951                www.mdpi.com/journal/sustainability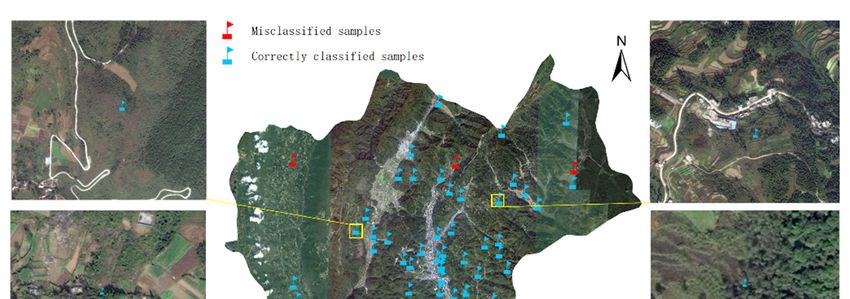
Sustainability 2019, 11, 5951                                                                 2 of 24

purposes for at least five years [9], while the International Symposium on Land Consolidation
and Land Reserve in 2011 defined cropland abandonment as two or more years [10]. In this
study, the latter definition, i.e., ceased cultivation of cropland for at least two successive years,
was adopted. Here, two years of successive cessation was emphasized to distinguish
abandonment from fallowed land. In China, land fallowing is a new phenomenon that has
emerged in recent years, although it remains unpopular due to the huge pressure for food
security. Most fallowed land is uncultivated for one year [11,12].
     The forms of cropland abandonment are spontaneous and induced [13]. Spontaneous
cropland abandonment is an initiative of farmers based on their own planting decisions, while
induced cropland abandonment is a result of policy guidance, such as the Common
Agricultural Policy (CAP) in Europe and the Grain-for-Green Policy in China. The former
policy encouraged the withdrawal of agricultural land from production [14–16], while the latter
encouraged farmers to convert sloping cropland to forestry or grassland [17,18].
     In general, two types of approach have been adopted to estimate the scale of cropland
abandonment in previous research: household surveys and remote sensing monitoring. The
highest merit of the former approach is ease of use: There are few technical difficulties in using
household surveys to assess the quantity of abandoned cropland. Therefore, many scholars
have adopted the survey approach; for example, Li et al. [19] conducted a large-scale survey to
estimate the extent of cropland abandonment in mountainous China and found that the
average cropland abandonment rate was 14.32%. In spatial, the abandoned cropland in China
was found mostly distributed in southern China based on a meta-analysis [20]. A field survey
from Nepal showed that nearly 46.6% of land has been abandoned due to the growth of market
towns and urban centers, and the opening of the country to the international job market [21].
In the U.S., a farmers’ perceptions survey of cropland abandonment showed that 28% of farm
land owners considered some of their land abandoned [22]. While household surveys can easily
acquire the quantity of abandoned cropland, their weakness is in mapping the spatial
information of abandoned cropland. In addition, a typical survey cannot usually provide a full
view of the whole cropland abandonment in the study area. In spite of the household survey
and satellite image datum, the cadastral datum is a defendable datum to help mapping
abandoned cropland [23]. However, in some regions such as China, there are no public
cadastral databases, limiting the utilization of the cadastral datum.
     Freely accessible satellite images have provided many datum sources to map abandoned
cropland. Based on the spatial resolution of satellite images, the Moderate Resolution Imaging
Spectroradiometer (MODIS), Landsat, and high-resolution satellite data, such as Quick-Bird,
and aerial photographs are generally adopted to identify abandoned cropland. The advantage
of the MODIS data is the high temporal resolution. However, the spatial resolution is low, 250
m, which means that fragmented abandoned cropland usually cannot be identified. When
MODIS datum has been used to extract abandoned cropland, the Normalized Difference
Vegetation Index (NDVI) time series covering the whole growing season of crops was
employed to detect the vegetation change [8]. The spatial resolution of Landsat data is about
30 m, which is much higher than that of MODIS, and has the advantage of identifying
fragmented abandoned cropland. However, due to the low temporal resolution (about 16 d), it
is usually difficult to find enough cloud-free images to establish long time series NDVI over a
large region. Therefore, direct land use classification has been performed to capture land use
conversions and identify abandoned cropland. The Random Forest model [24–26] and Support
Vector Machine [27,28] are the two most popular methods adopted to classify land use. In
addition, other global or regional land use and land cover databases, such as the History
Database of the Global Environment [29] and National Land Cover Database of the United
States [30], have been used to assist in mapping abandoned cropland.
     As remote sensing technology has improved, the spatial resolution of satellite images can
reach one meter or better, providing more opportunities to map abandoned cropland. For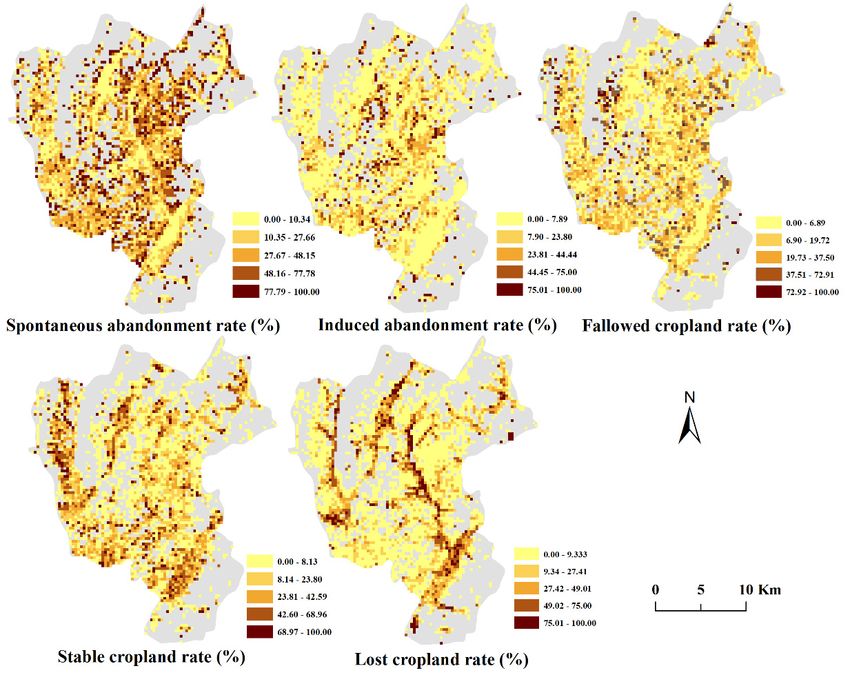
Sustainability 2019, 11, 5951 3 of 24
example, researchers utilized Quick-Bird images and existing land use/land cover map layer to
identify abandoned cropland in the Murcia Region of Southeast Spain [31]. In general, aerial
photographs have higher spatial resolutions than those of satellite images. When identifying
the abandoned cropland in topographically variable areas, such as gullies [32] and terraces
[33,34], aerial photographs have been adopted. For ultra-high resolution tasks, aerial
photographs are very useful for identifying detailed information regarding abandoned
cropland, such as the height of succession vegetation after land abandonment [35] and the
forest transition from deforestation to afforestation [36]. The advantages of high-resolution
satellite images and aerial photographs are clear. However, there are also some disadvantages
hindering the application of these data. Most high-resolution satellite images and aerial
photographs are not freely available, and one scene of image or photograph only covers a very
small area. This results in very high costs for identifying abandoned cropland, even in a
relatively large region using these data. In addition, unlike satellite images, aerial photographs
usually exist in few areas, and periodic updates are limited.
Although some research has been conducted in identifying abandoned cropland using
remote sensing technology, huge challenges remain, e.g., differentiating abandoned cropland
from fallowed cropland and recultivated abandoned cropland [2,8,24,26,34,37–40]. In prior
work, abandoned cropland was usually identified by dividing the changes in vegetation or
land use conversions using snapshots of land use data at the start and end years of a given
research period. For example, Prishchepov et al. [27] mapped cropland abandonment in post-
Soviet European Russia from 1990 to 2000 using the interpreted land use map in 1990 and 2000.
Malavasi et al. [41] identified abandoned cropland in the Mediterranean mountain areas over
a total span of 29 years using Landsat images in 1987, 2003, and 2016. This approach can either
underestimate or overestimate the abandoned land. For the lack of continuous land use
information, the timing of a certain land parcel’s removal from cultivation cannot be accurately
recorded. If the abandoned cropland plot, which was identified at the end of the time span,
was just removed from cultivation for rotation, it should be fallowed land. Moreover, some
active cropland identified at the end of a time span could also have been abandoned and
recultivated. These possibilities generate some uncertainties in identifying cropland
abandonment. In addition, distinguishing spontaneous abandonment from induced
abandonment is particularly important for countries having implemented agricultural policies
to intervene in land abandonment, and who want to better understand land abandonment
behavior and the impacts of policy. Unfortunately, most previous research has not succeeded
in differentiating the different types of abandonment.
To address the described challenges in mapping abandoned cropland and provide a
technique support for policy making about addressing cropland abandonment, this research
developed an annual land-use trajectory method to differentiate abandoned cropland land
from fallow land, and to identify spontaneous and induced abandonment. By evaluating the
timing of abandoned cropland, this research also assessed the recultivation of abandoned
cropland. To reduce the cost of identification and effects of fragmented land parcels on
identification, and to increase the transferability of the method, this research adopted freely
available Landsat and HJ-1B images to conduct this research. In brief, the specific objective of
this research is to develop a new approach to map different kinds of cropland abandonment in
mountainous areas using free and medium resolution satellite images.
2. Study Area and Data Sources
2.1. Study Area
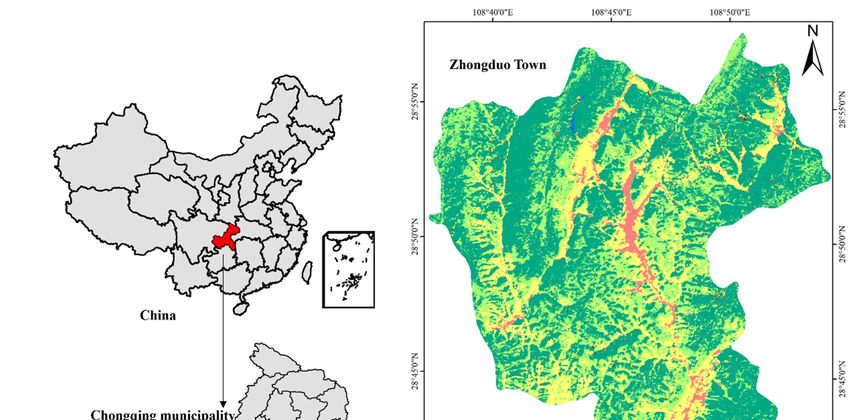
Youyang County is located in southeast Chongqing City, China, within the geographical
range of 108°18’25’’–109°19’02’’E and 28°19’28’’–29°24’18’’N (Figure 1). It covers an area of 5173
km2 and governs two streets, 14 towns, and 23 townships. Zhongduo Town, the study area, is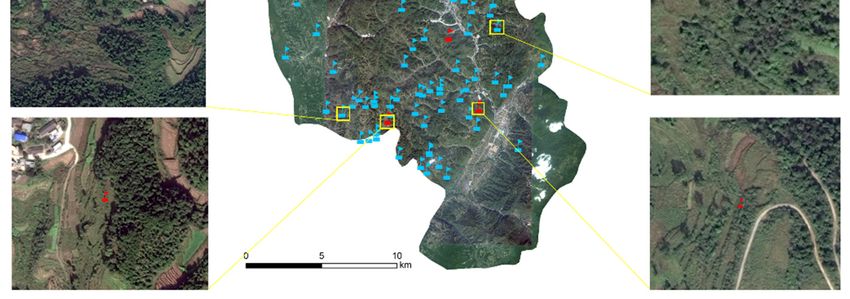
Sustainability 2019, 11, 5951                                                                    4 of 24

located in the middle of Youyang County, covers an area of 219 km2, and hosts the county
government headquarters. The regional climate is humid subtropical monsoon climate with
abundant precipitation, warm winters, and cool summers. Zhongduo lies within the Wuling
mountain areas with an elevation difference of more than 1600 m; central Zhongduo has a
lower terrain, while the eastern and western parts are located at higher elevations.

      Figure 1. Geographical location of Zhongduo Town and a map of its land use in 2012; data
      source: The boundary was from the Resource and Environment Data Cloud Platform of
      Chinese Academy of Sciences. The classification result of Zhongduo in 2012 were from this
      research.

2.2. Data Sources
     Considering the fragmented terrains in mountainous areas, the satellite images with a
spatial resolution of 30 m were adopted. In total, 138 Landsat satellite images (Landsat 5 and
Landsat 8 OLI ) covering Zhongduo from 2012 to 2017 were downloaded from the United States
Geological Survey (USGS). Since Zhongduo is located in mountainous areas, cloud cover in
most images is very high. After a cloud cover check, only ten scenes of satellite image remained
with a cloud coverage of less than 10%; of these, no images from 2012 were used because of the
high cloud cover. Therefore, HJ-1B satellite images with a spatial resolution of 30 m from 2012
were adopted as supplementary image data. The HJ-1B images were download from China
Centre for Resources Satellite Data and Application. The datum is a product of level two, which
has performed radiation and geometric corrections. Atmospheric corrections on the images
were conducted based on ENVI5.1 software and the extension tools entitled Data Reading
Patch of HJ-1. The detailed band descriptions of Landsat 8 OLI and HJ-1B were shown in Table
1.

             Table 1. The band, wavelength, and spatial resolution of Landsat 8 OLI and HJ-1B.

                       Landsat 8 OLI                                      HJ-1B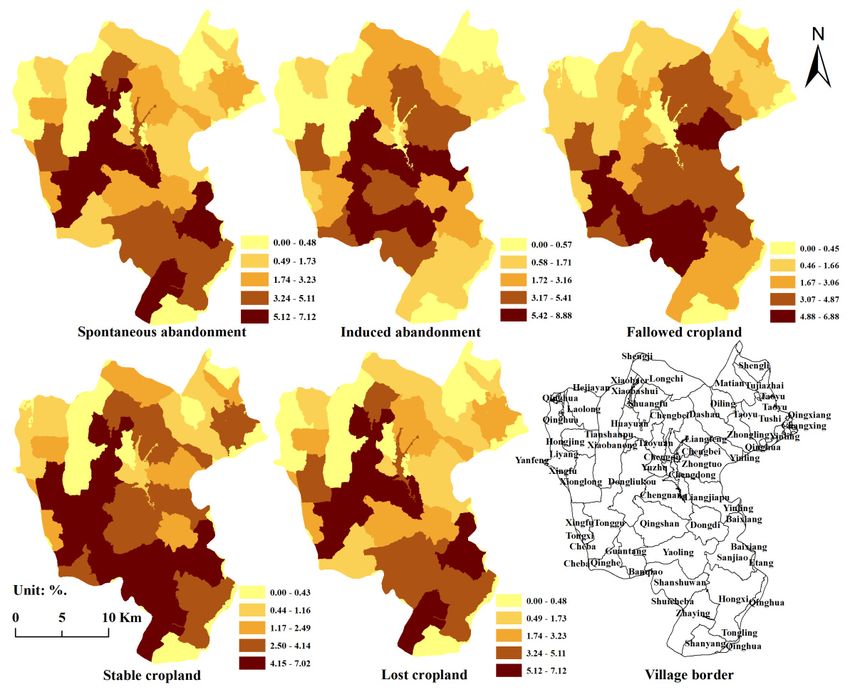
Sustainability 2019, 11, 5951                                                                            5 of 24

     Band         Wavelength/μm         resolution/m       Band      Wavelength/μm        resolution /m
    Band 1         0.433–0.453               30           Band 1       0.43–0.52                30
    Band 2         0.450–0.515               30           Band 2       0.52–0.60                30
    Band 3         0.525–0.600               30           Band 3       0.63–0.69                30
    Band 4         0.630–0.680               30           Band 4       0.76–0.90                30
    Band 5         0.845–0.885               30           Band 5       0.75–1.10               150
    Band 6         1.560–1.660               30           Band 6       1.55–1.75                75
    Band 7         2.100–2.300               30           Band 7       3.05–3.90                90
    Band 8         0.500–0.680               15           Band 8       10.5–12.5               300
    Band 9         1.360–1.390               30
    Band 10        10.60–11.19               100
    Band 11        11.50–12.51               100

     Give the phenological characteristics of crop production in Zhongduo and availability of
satellite images, six scenes were ultimately adopted, including one HJ-1B satellite image from
2012 and five Landsat 8 OLI images from 2013 to 2017. All images were collected between June
and October (Table 2). Here, this research combined satellite images of HJ-1B and Landsat 8
OLI to map abandoned cropland for the lack of available Landsat images in 2012. The
classification results of the two kinds of satellite images could be comparable for the followed
reasons. First, the spatial resolution of HJ-1B image (30 m) is the same with that of Landsat 8
OLI images. Second, the band information of the two kinds of satellite images can meet the
requirements of classification method adopted in this paper. Third, this research mapped the
abandoned cropland by detecting the successive land-use conversions during a certain period.
In other words, this research only compared the results of land use classification of different
years when mapping abandoned cropland. Last, some previous research [42,43] has convinced
that the consistency of the classification result is very high when using Landsat 8 OLI and HJ-
1B images to map the land use of the same region separately.

                   Table 2. The acquisition date of adopted satellite images in this research.

            Scene ID                         Acquisition date         Resolution/m          Data source
    HJ1B-CCD1-8-80-20121001-
                                                 2012/10/01                  30                  HJ-1B
          L20000861676
    LC81260402013297LGN00                       2013/10/24                   30             LANDSAT8
    LC81260402014204LGN00                       2014/07/23                   30             LANDSAT8
    LC81260402015287LGN00                       2015/10/14                   30             LANDSAT8
    LC81270402016169LGN00                       2016/06/17                   30             LANDSAT8
    LC81260402017132LGN00                       2017/05/12                   30             LANDSAT8

     Google Earth images with a spatial resolution of 0.52 m were utilized to assist selecting
training samples and assessing accuracy. These Google Earth images were downloaded using
a 91 Satellite Imagery Assistant tool developed by the Digital Cloud Technology Co., Ltd. [44].
DEM datum, with a spatial resolution of 30 m from the Platform of Geospatial Data Cloud,
were utilized to extract slope and elevation information.

3. Methods

3.1. A Framework for Identifying Abandoned Cropland
     This study adopted the definition of cropland abandonment from the International
Symposium on Land Consolidation and Land Reserve in 2011, i.e., cropland that has not been
cultivated for a minimum of two successive years. Cropland abandonment can be identified by
detecting changes in vegetation or land use conversions. According to previous research, the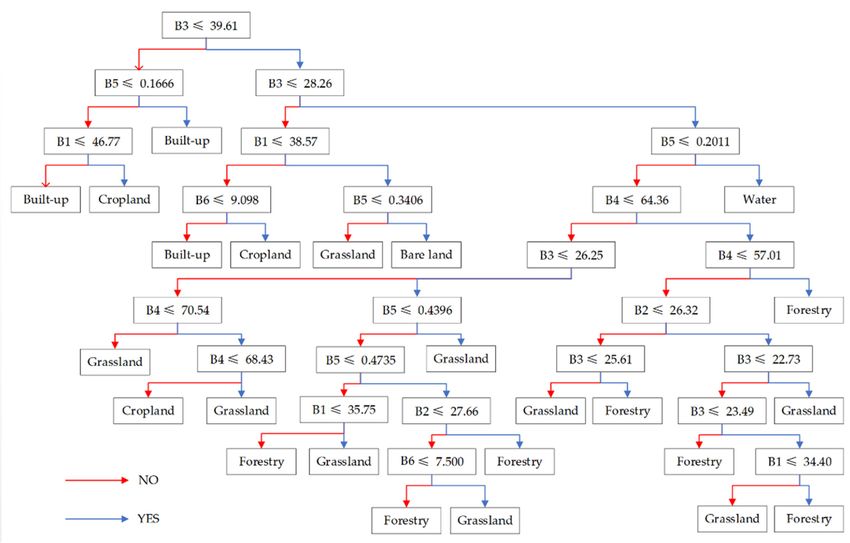
Sustainability 2019, 11, 5951                                                                     6 of 24

vegetation succession after land abandonment in forest vegetation areas should be subject to
annual and biennial weed, perennial grass and other grass, ligneous plants, and late succession
species in sequence [45]. The changes from bare land to weeds or other grasses can take one to
three years, to dwarf shrubs at least five years, and to trees at least ten years without human
interference [46–48]. Therefore, spontaneous cropland abandonment should result in weeds or
grasses as the dominant vegetation grown within the first three years of abandonment.
However, with disturbance from human activities, vegetation succession can be sped up. China
implemented the Grain-for-Green policy, its largest land retirement/afforestation program, in
2000. The policy encourages farmers to return sloping cropland to forests or grassland using
human intervention. To promote the policy effects, vegetation was planted in the abandoned
cropland to implement the policy, which sped up recovery [49–51]. For example, in
mountainous areas, economic forest was usually planted to comply with the Grain-for-Green
policy, which can reach full growth within three to five years [52]. This type of
human intervention accelerated vegetation succession and created emerging forestry
vegetation within a short period after abandonment.
      In general, researchers cannot distinguish spontaneous cropland abandonment from
induced cropland abandonment solely using land use conversions, because the two types of
abandonment can generate similar land use conversions, i.e., from cropland to grassland or
forest. Fortunately, based on the work of Shi and Xu [53] in Youyang, Wushan, and Shizhu
County in Chongqing, the transitions from cropland to grassland resulting from the Grain-for-
Green policy was negligible. Thus, the spontaneous and induced cropland abandonment in
Zhongduo Town of Youyang County results in different land use conversions within a short
period after abandonment. Spontaneous abandonment results in an initial conversion from
cropland to grassland or bare land while induced abandonment, e.g., as part of the Grain-for-
Green policy, would direct returning cropland to forestry, including shrubs and trees. By
detecting different land use conversions, this research can differentiate spontaneous
abandonment from induced abandonment.
      Cropland fallowing is another activity associated with ceased cultivation, and it is easily
confused with cropland abandonment. Different from cropland abandonment, cropland
fallowed is a designed behavior to cease cultivation to let the land rest. The goal of this practice
is to mitigate plant diseases and insect pests that proliferate due to overuse or to increase soil
quality for better grain production [54,55]. Due to high grain production pressure, cropland
fallowed intervals are usually short in China; one year is the most common interval [12,56].
Therefore, this research defined cropland fallowed as ceasing cultivation for one year (Table 3),
which can be identified from the annual land use trajectory.

        Table 3. Classification of different types of land abandonment in Zhongduo Town, China.

    Primary
                           Subclass                            Definition
      class
      Stable                             Cropland in continuous cultivation throughout the
    cropland                                              research period.
                                      Cropland that has been abandoned for at least successive
                                                              two years.
                        Spontaneous    Cropland that has been spontaneously abandoned by
  Abandoned              abandoned    farmers. The main vegetation grown in abandoned land
   cropland               cropland      is weeds or other grasses within the research period.
                          Induced     Cropland that has been abandoned due to the Grain-for-
                         abandoned    Green policy. The main vegetation grown in abandoned
                          cropland       land are shrubs or trees within the research period.
    Fallowed
                                         Cropland where cultivation has ceased for one year.
    cropland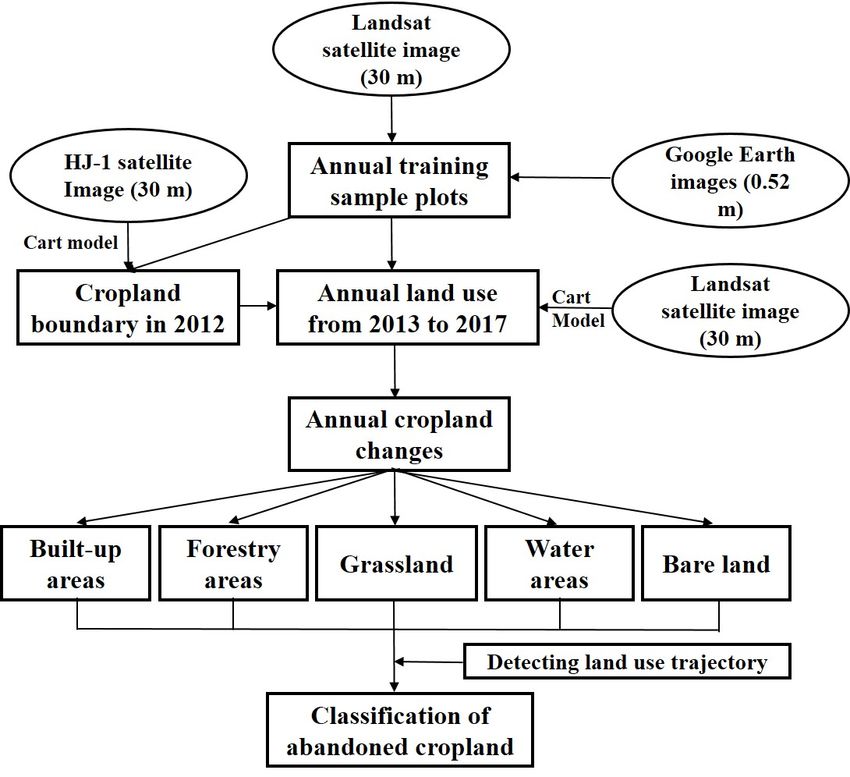
Sustainability 2019, 11, 5951                                                            7 of 24

      Lost                          Cropland that has been encroached by the expansion of
    cropland                             built-up areas, such as settlement and roads.

     Based on the definitions in Table 3, a classification for cropland change was established,
including stable cropland, abandoned cropland, fallowed cropland, and lost cropland.
Abandoned cropland was further divided into two subclasses: Spontaneous and induced
abandonment. Thus, this research identified the abandoned cropland by two steps. First, six
land use types including cropland, forestry areas, grassland, water areas, and bare land were
identified. Second, by monitoring successive land use conversions annually during the research
period, the abandoned cropland was mapped.

3.2 The Technique Flow for Mapping Abandoned Cropland
     Three steps were designed to map abandoned cropland in Zhongduo (Figure 2). First, a
cropland boundary for 2012 based on the HJ-1 satellite images was created. To acquire the
cropland boundary, land uses in whole Zhongduo in 2012 were mapped based on a CART
algorithm. The training sample databases for HJ-1 satellite images classification were created
by a visual interpretation of high-resolution Google Earth images. Totally 314 samples were
selected to train CART model, including 51 samples of built-up areas, 102 samples of forestry
areas, 6 samples of water areas, 80 samples of cropland land, 70 samples of grassland, and 5
samples of bare land. The cropland distribution in 2012 was extracted as the border for
mapping abandonment. In the following step, annual land use from 2013 to 2017 within the
2012 cropland boundary was mapped. The CART algorithm was adopted again to map
cropland land uses based on the training samples. Thus, dynamic land use maps within the
cropland boundary were created. In the last step, the land-use trajectory at the pixel level was
traced. The definitions in Table 3 were used to identify the five types of cropland change and
map abandoned cropland.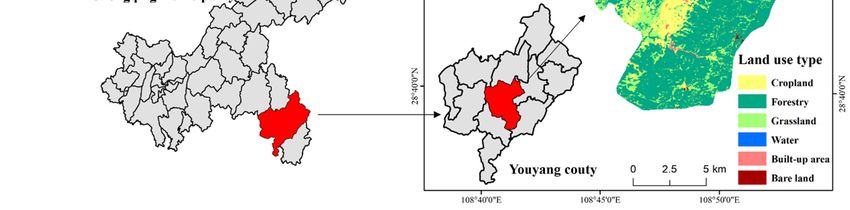
Sustainability 2019, 11, 5951 8 of 24
Figure 2. Flowchart for identifying abandoned cropland.
3.3. Mapping Land Use Using the CART Model
Traditional remote sensing interpretation methods are based on the spectral
characteristics of ground objects, which can be generally identified using the electromagnetic
radiation information features received from remote sensing sensors. However, limited by the
phenomena of "different objects with the same spectra characteristics, the same spectrum for
different objects", these classification methods can show errors, such as wrong classification
and omissive classification, depending on the spectral characteristics of ground objects [57,58].
In contrast, knowledge-based decision tree classification methods comprehensively use the
remote sensing image and other spatial data, and then obtain the rules for remote sensing
interpretation classification through methods such as expert experience summarization and
simple mathematical statistical induction. In addition, these decision tree classification
methods use multi-source data, which make the classification results superior to those of
traditional interpretation methods.
This research adopted the CART algorithm to map land use, which is a type of effective
nonparametric classification and regression method. First proposed by Breiman [59], it has
gained extensive popularity in many fields, including statistics and tech mining [60]. In contrast
to traditional statistics, the CART algorithm established prediction criterion in the form of a
binary tree; it is therefore much easier to understand, interpret, and use related data. The Gini
index, from economics, was used as the criterion to select the best test variables for measuring
the impurity level of a sample classification or impurity level of a training sample set. A lower
impurity level corresponds to a higher "purity" of sample [61]. The Gini index is defined as
follows:
J
Gini(S) = 1- p2 ( j h) (1)
j
n j (h)
p( j h ) = , j p( j h ) = 1
J
(2)
n(h) ,
where, p (j/h) is the probability of a sample randomly selected from the training sample set
belonging to the j-th class when the value of a certain test variable is h; nj (h) is the sample
number of the samples in the training sample set belonging to the j-th class of samples when
the value of the test variable is h; n (h) is the sample number in the training sample set when
the value of the test variable is h; and j is the class number.
In general, there are four steps to generate the decision tree using Gini index. First, Gini
index of different attributes was calculated according the former equations. The attribute with
the minimum Gini index was selected as the split attribute of the root node. For continuous
attribute, the calculation of segmentation threshold is necessary for the purpose of
discretization. For discrete attribute, samples should be divided into many subsets according
to the value number of the attribute, and the subset with the minimum Gini index should be
selected as the split attribute. Second, the sample set should be divided into two parts according
to the value of the split attribute. Third, for the new generated two subsets, the works
performed in the first step were repeated to find the child node. These circulations were kept
on until all the samples within a subset belong to the same type or no available split attribute
could be found. Last, cutting branches was performed to generate the final decision tree.
In this study, the specific process of running CART algorithm has followed several steps.
Remote sensing images were first preprocessed and tailored. Subsequently, the NDVI layer,
the 1–7 wave band layer, and ISODATA (Iterative self-organizing data analysis technique)
unsupervised classification iteration layer (ten classes, ten times) were utilized to compound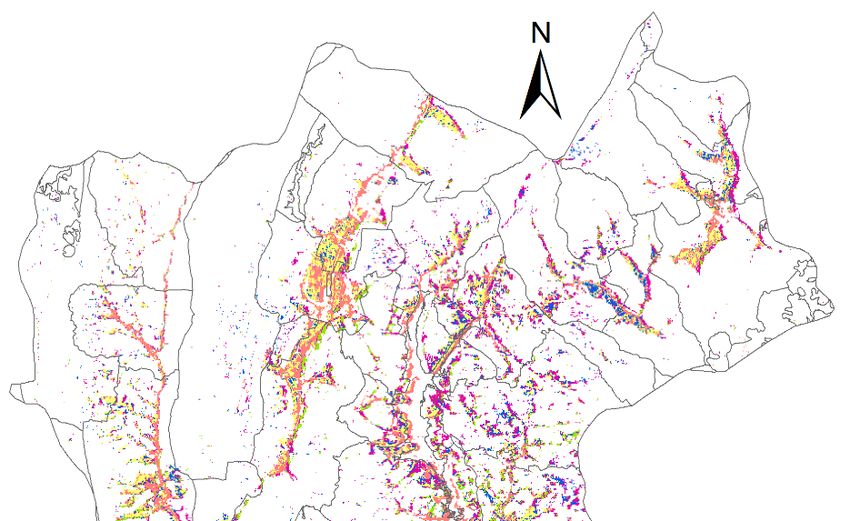
Sustainability 2019, 11, 5951                                                                      9 of 24

multi-source data. Here, ISODATA unsupervised classification and the EDVI was directly
performed by ENVI5.1 software. The aim of conducting ISODATA unsupervised classification
is to obtain abundant band information. By overlapping the images of Landsat 8 OLI, NDVI,
and the results of ISODATA classification, a new multi-source datum layer was generated for
classification. Then, the research extracted six training sample regions (including cropland,
grassland, forestry, water, built-up areas, and bare land) using a false color layer and built a
decision tree to map land use. One decision tree for 2012 utilized to map the cropland boundary
is shown in Figure 3. ENVI Classic software and the CART extension tools were utilized to run
the CART model.

      Figure 3. Decision tree created to map land use of Zhongduo in 2012. Notes: B1 to B4 are the
      bands of HJ-1B from 1 to band 4, respectively. B5 is the NDVI, and B6 is the result of ISODATA
      classification. In addition, a total of seven decision trees were generated to conduct land use
      classification from 2012to 2017. To save space, only one decision tree generated in 2012 was
      shown here.

      The establishment of a decision tree has several steps (Figure 3). First, since the impervious
surface areas has obvious ground object features, band 1 and 3 of HJ-1B satellite images were
utilized to quickly identify built-up areas. For the identification of rest built-up areas, the result
ISODATA classification was utilized. The framework of distinguishing grassland and forestry
was similar to the extraction of built-up areas. The band information and threshold value were
repeatedly adjusted to distinguish the rest land use types.
      The overall accuracy was utilized to assess the accuracy of land use mapping using CART
model. The overall accuracy is the proportion of total correctly classified pixels compared to
the total number of pixels in the map [62,63]. The overall accuracy was calculated based on an
error matrix generated by comparing reference data with classification results [64]. The
reference data were generated by a visual photo-interpretation of the high-resolution Google
Earth images. The overall accuracy can be automatically calculated using ENVI Classic
software, and has been widely adopted to assess the accuracy of land use classification.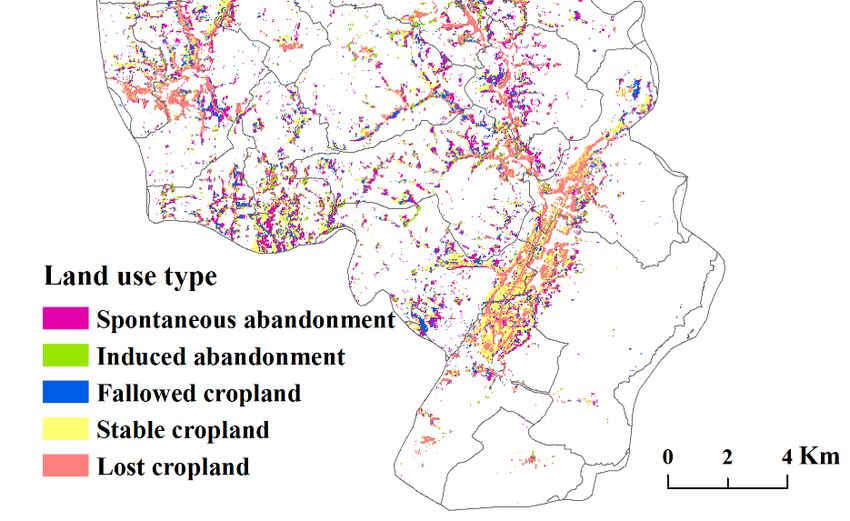
Sustainability 2019, 11, 5951                                                                     10 of 24

      For comparison purposes, this research also used the supervised classification maximum
likelihood method to map land use in 2012. It was found that the overall accuracy and Kappa
coefficient of the land use map for Zhongduo in 2012 generated by CART algorithm are 92.78%
and 0.89 (Table 4), respectively. This overall accuracy of CART algorithm is 9.22% higher than
that of the maximum likelihood method, which performs the classification based on spectral
information.

           Table 4. The error matrix of land use classification of Zhongduo in 2012 using CART
                                                algorithm.

               Land Use           1     2       3      4      5       6    Total   CE      UA
                   1             77     0       0      5       0     15     97     20.6   79.4
                   2              0    550      0      6      17      2     575    4.3    95.7
                   3              0     0      21      0       0      0     21     0.0    100.0
                   4              2     0       0     262      6      0     270    3.0    97.0
                   5              0     21      0      8     150      1     180    16.7   83.3
                   6              0     0       0      0       0      7      7     0.0    100.0
                 Total           79    571     21     281    173     25    1150
                  OE             2.5   3.7     0.0    6.8    13.3   72.0
                  PA            97.5   96.3   100.0   93.2   86.7   28.0                  92.78
      Notes: CE is committed error; OE is omitted error; UA is user accuracy; and PA is producer
      accuracy. Numbers of 1, 2, 3, 4, 5, and 6 represent built-up areas, forestry, water, cropland,
      grassland, and bare land, respectively.

3.4. Detecting Land Use Trajectory from 2012 to 2017
       To finally map abandoned cropland, the land-use trajectory at the pixel scale from 2012 to
2017 was calculated. By overlapping the cropland boundary in 2012 with the annual dynamic
changes from 2013 to 2017, the land use-trajectories at the pixel level were created. With these
trajectories, different types of cropland in Zhongduo were identified according to the
definitions in Table 3.
       In the land-use trajectory calculation, cropland unchanged throughout the research
period, e.g., pixel c (Figure 4), is classified as stable cropland. Lost cropland is identified
according to the occurrence of built-up land. For example, croplands in pixel e and g were
converted to built-up land in 2016 and 2014, respectively. These pixels are all classified as lost
cropland. Fallowed cropland and abandoned cropland are classified according to the
successive time cultivation has ceased. For example, land-use trajectories in pixel d and h
indicate that cultivation ceased in 2014 and 2012, respectively. However, in the following years,
they are recultivated. According to the definition, they are classified as fallowed land. In pixels
a, b, f, and i, cultivation ceased for five, two, four, and four years, respectively. These pixels are
classified as abandoned cropland. In addition, pixels f and i do not appear as forests, while
pixel a and b emerged forested during the research period (six years). Therefore, croplands in
pixel f and i are identified as spontaneous abandonment, while cropland in pixels a and b are
classified as induced abandonment, i.e., resulting from the Grain-for-Green policy. This
method was utilized to map cropland abandonment in Zhongduo from 2012 to 2017.
Sustainability 2019, 11, 5951 11 of 24
Figure 4. Classification using land use trajectory detection.
3.5. Assessing the Accuracy of the Cropland Abandonment
To verify the extraction accuracy of abandoned cropland, Google Earth images for
Zhongduo in 2016 were downloaded. The resolution was set to 0.52 m and images were clear,
enabling us to verify whether the abandoned land plots were correctly identified or not. A Total
of 40 random points in Zhongduo were established based on ArcGIS software. Subsequently,
three plots of mapped abandoned cropland near each sample point were created. Thus, the
images corresponding to these 120 plots on the Google Earth base map were located to
determine the status of the plot (Figure 5). After verification, 16 of these 120 plots were
cultivated, indicating an identification accuracy of abandoned cropland of 86.67%.
Figure 5. Samples used to assess accuracy.
Here, this research only assessed the accuracy of the total abandoned cropland. In Table
3, abandoned cropland was further divided into spontaneous and induced cropland. However,
it is difficult to generate the verifying samples of spontaneous and induced cropland
separately, only using Google Earth images of a certain year. This means that the classificationSustainability 2019, 11, 5951 12 of 24
accuracy of spontaneous and induced cropland cannot be assessed in this research. In the
future, the problem could be solved by a detailed household survey.
4. Results
4.1. Land Use Patterns in Zhongduo in 2012
In 2012, the land use type with the largest area in Zhongduo was forest, accounting for
53.67% of the total area (Figure 1). Most forests were distributed in the Wuling Mountains, in
southeast and north Zhongduo. Grassland was the second most-prevalent type, accounting for
26.13% of total area. Cropland, mainly scattered around rural settlements, was the third most-
prevalent type, accounting for 17.15% of total area. Spatially, cropland and grassland presented
a staggered distribution. Built-up areas were mainly distributed on both sides of the two
highway roads, Baomao and Youyan, and concentrated in the central and southeastern parts
of Zhongduo Town. Bare land only contributed 0.39% of total areas in Zhongduo, scattered on
the southeast border and middle of the northeast.
4.2. Distribution of Different Types of Cropland
From 2012 to 2017, the proportion of abandoned cropland, fallowed cropland, stable
cropland, and lost cropland to total cropland of 2012 were 31.56%, 13.69%, 27.84%, and 26.91%,
respectively (Figure 6). Of the 31.56% abandoned cropland, 23.16% was spontaneous
abandonment and 8.40% was induced abandonment. Generally, spontaneous abandoned
cropland accounted for the largest cropland area, followed by stable cropland. Due to rapid
economic development, built-up area expansion in Zhongduo was also substantial, resulting
in a 26.91% loss of cropland.Sustainability 2019, 11, 5951 13 of 24
Figure 6. Different types of cropland in Zhongduo from 2012 to 2017.
Spontaneous abandoned cropland was mainly distributed in Sanjiao and Zhaying
Villages, southeast Zhongduo Town (Figure 7), and in Huayuan, Dongliukou, Chengnan, and
Tonggu Villages along the Baomao highway; these six villages contributed 38.83% of the total
area of spontaneous abandoned cropland. Induced abandoned cropland was mainly
distributed in the villages of Liangjiapu, Chengnan, Guantang, and Yaoling, forming a ring
around Qingshan Village in central Zhongduo; these four villages accounted for 28.41% of the
total area of induced abandoned cropland. Fallowed cropland was mainly distributed in
Tonggu, Guangtang, Yaoling, and Shanshuwan Villages in the southwest, and Zhongtuo
village in the central-east; these villages accounted for 30.14% of total fallowed cropland. Stable
cropland was mainly distributed in villages along the western border and in areas of two
valleys, and lost cropland was mainly distributed in the two valleys of Zhongduo Town.Sustainability 2019, 11, 5951 14 of 24
Figure 7. Percent distribution of different types of cropland at the village scale from 2012 to
2017.
4.3. The Cropland Abandonment Rate
To better discern the spatial features of cropland abandonment, a random raster with a
resolution of 300 m was created, and the cropland abandonment rate in each pixel was
calculated (Figure 8). As shown, serious spontaneous abandonment, with a rate of 77.79%, was
most prevalent in northeast central Zhongduo, central areas of Dongdi Village in southeast
Zhongduo, and in the junction areas of Tonggu Village, Dongliukou Village, Qingshan Farm,
and Guantang Village in southwest Zhongduo. In comparison, serious induced abandonment,
with a rate of 75.01%, mainly emerged in central Zhongduo. Serious land fallow, with a rate of
72.92%, was primarily distributed in central-west Zhongduo. Compared to the scattered
distribution of serious spontaneous abandonment across the whole town, areas showing
serious induced abandonment and fallowed land were relatively concentrated.Sustainability 2019, 11, 5951 15 of 24
Figure 8. Cropland abandonment rate in Zhongduo from 2012 to 2017.
In the three valleys where the terrain is relatively flat and the transportation convenient,
croplands were easily lost, with a loss rate of 75.01% (Figure 8). Built-up expansions easily
occur in these regions. The spatial pattern of stable cropland rate is similar with that of lost
cropland rate, except for two regions: The first is the county seat region, where the lost cropland
rate was high while the stable cropland rate was low, and the second is located in southwest
Zhongduo, where the stable cropland rate was high and the cropland loss rate was low.
4.4. Timing of Cropland Abandonment
The mean duration time of spontaneous abandonment in Zhongduo was 2.84 years for
2012 to 2017. As shown in Figure 9, abandoned cropland with two, three, four, and five-year
durations respectively accounted for 24.00%, 28.09%, 25.46%, and 22.44% of the total
abandonment areas. The cropland abandoned for three years accounted for the largest areas of
spontaneous abandonment, while the cropland abandoned for five years contributed to the
smallest proportion. Spatially, the cropland spontaneously abandoned for five years was
mainly distributed in central and southwest Zhongduo. Cropland spontaneously abandoned
for two years was scattered across all of Zhongduo. About 19.11% of spontaneously abandoned
cropland was land fallowed before abandonment; accounting for time as fallowed prior to
classification as abandoned, the average time of spontaneous abandonment reached 3.45 years.Sustainability 2019, 11, 5951 16 of 24
Figure 9. Timing of cropland abandonment in Zhongduo Town.
5. Discussion
5.1. Land Quality of Abandoned Cropland
Elevation and slope can reflect the land quality, while distance to rural settlement can
reflect the convenience of cultivation. It was found that induced abandoned cropland had the
largest elevation and slope among the five types of cropland, followed by spontaneous
abandoned cropland and fallowed cropland (Table 5). The elevation and slope of stable
cropland and lost cropland were clearly smaller than those of the other three types of cropland.
The elevation and slope of lost cropland was respectively 89.64% and 50.40% of induced
abandoned cropland. Features of distance to settlement for different types of cropland were
similar to those for elevation and slope. From induced abandonment to spontaneous
abandonment, fallowed cropland, stable land, and lost cropland, the cultivation convenience
gradually increased 1.87%, 10.50%, 19.15%, and 42.29%, respectively.
Table 5. Natural and distance conditions of different types of cropland.
Type Elevation (m) Slope (°) Distance to Rural Settlement (m)
Spontaneous abandonment 820.64 18.5 225.08
Induced abandonment 826.29 19.76 229.37
Fallowed cropland 806.01 15.8 205.29Sustainability 2019, 11, 5951 17 of 24
Stable cropland 776.76 12.7 185.68
Lost cropland 740.67 9.96 132.38
Notes: The distance from cropland to rural settlement here refers to the Euclid Distance instead
of actual travel distance. In general, the actual travel distance will be much larger than the
Euclid Distance considering the effects of topography.
From these results, it can infer that once the policies were implemented, farmers would
prefer to surrender cultivating the worst quality cropland. In the remaining cropland, the
inferior cropland faced greater risk of spontaneous abandonment, while the best cropland
faced greater risk of encroachment by built-up expansion. Therefore, stable and fallowed
croplands are mostly mid-quality. Furthermore, the quality of stable cropland is a little better
than that of fallowed cropland.
It was found that the abandoned cropland was usually the poorest quality, findings
similar to those from previous research. Zhang et al. [6] examined the effects of cropland-to-
housing distance and land quality on cropland abandonment in Chongqing using household
survey data. They found a higher probability of cropland abandonment on poorer quality land.
Results from a household decision model developed using household survey data also from
Chongqing showed that land parcels with higher land quality were less likely to be abandoned
[65]. A multi-level analysis on cropland abandonment determinants in Chongqing using
survey data showed that cropland abandonment is more common on plots with steeping slope,
poor quality soil, and longer distances to laborer residences [17]. Finally, an influential factors
analysis of the cropland abandonment at the township level in Chongqing showed that the
average elevation, slope, and distance between townships and the county seat have
significantly positive effects on abandonment [1]. More broadly, research from Southern Chile
showed that land quality was a significant factor driving cropland abandonment [66], and in
Slovakia, cropland abandonment was also more likely to occur on areas with lower land quality
and with worse access to non-farmed land [67]. Our main findings indicating land quality is
one of the key factors in cropland abandonment is consistent with these previous research
studies.
5.2. Changes in Spontaneous Cropland Abandonment Rate with Variations of Influence Factors
In this study, it was found that the spontaneous abandonment rate for Zhongduo was
23.16%. In nearby regions, several household surveys evaluating cropland abandonment were
conducted, which can provide some comparison references. A household survey including
5258 plots of 599 rural households from Youyang and Wulong County found an average
cropland abandonment rate of 25.60% [65]. The survey excluded abandonment resulting from
the Grain-for-Green policy. Therefore, their result is very close to our spontaneous
abandonment rate (23.16%). In addition, Shi and Xu [53] developed an approach to map
abandoned cropland in Shizhu, Wushan, and Youyang Counties in Chongqing. The approach
identified abandoned cropland by overlapping two land use maps from different periods
acquired from the local Land Resources and Management Bureau. In addition, a map layer of
the locations implementing the Grain-for-Green policy from the local Forestry Bureau was
utilized to exclude induced cropland abandonment. Their assessment showed that the
cropland abandonment rate for Youyang County was 19.20%. Using a similar approach, Shi et
al. [1] assessed the cropland abandonment rate for 95 townships in Chong and found that the
cropland abandonment rate in 29 towns ranged from 15 to 20%, 23 towns from 10 to 15%, and
15 towns from 20 to 25%. Comparing the results from these prior studies with this research, the
differences in the abandonment rate were between 2.44% and 3.96%. Considering the minor
differences in study areas and random error, the spontaneous abandonment rate of this
research is very close to those found in previous work.Sustainability 2019, 11, 5951 18 of 24
With increasing elevation, slope, and cropland-to-settlement distance, the spontaneous
abandonment rate increased gradually. However, the rate of increase did not continue to
increase linearly (Figure 10). An inflection point emerged at certain elevations, slopes, and
distances. For elevation, the inflection point was found between 1000 m to 1100 m, where the
spontaneous abandonment rate reached a peak of 47.61%. Before this interval, the spontaneous
abandonment rate increased rapidly with increasing elevation, while after this interval the
spontaneous abandonment rate fluctuated and was more stable. A similar relationship was
found for cropland-to-settlement distance; the inflection point emerged between 400 m and 500
m in distance, with an abandonment rate of 43.37%. However, the relationship between
spontaneous cropland abandonment rate and slope presented an inverted U curve. When the
slope exceeded 25°, the spontaneous abandonment rate gradually decreased with increasing
slope; however, the total abandonment rate did not decrease above 25°. Because the Grain-for-
Green policy in China was primarily implemented in cropland over 25° slope [18,68,69], at
slopes greater than 20–25°, cropland abandonment gradually changed from spontaneous
abandonment to induced abandonment.Sustainability 2019, 11, 5951 19 of 24
Figure 10. Changes in spontaneous abandonment rate with elevation, slope, and distance to
rural settlement.
5.3. Stability of Cropland Abandonment
Values for elevation, slope, and distance to rural settlement show continuously increasing
trends with the increase of abandonment time (Table 6). This relationship indicates that poorer
land quality corresponds to longer times for cropland abandonment. In addition, according to
the land-use trajectory, it was found that 50.54% of the spontaneously abandoned cropland was
recultivated after abandonment, while only 12.91% of induced abandoned cropland was
recultivated. Induced abandonment is more stable than spontaneous abandonment due to
worse land quality and subsidy incentives.
Table 6. The relationship between slope, elevation, and distance conditions and cropland
abandonment length.
Type Elevation (m) Slope (°) Distance to Rural Settlement (m)
Non-abandonment 793.12 14.75 198.41
2 years 799.77 17.22 207.95
3 years 815.36 17.85 231.20
4 years 822.35 18.55 225.22
5 years 836.44 19.84 229.79
Abandoned cropland was recultivated for various reasons across different regions.
Recultivation has been widespread in Eastern Europe [70], which has been explained by
increased crude birth rates, changing ethnic minority populations, and grain yields [71]. In
addition, foreign and domestic investments and price changes can play important roles in
recultivating abandoned cropland. For example, in Russia, the Ukraine, and Kazakhstan,
increasing investments and government support for agriculture production have resulted in
recultivation [72]. These recultivated croplands usually have good land quality and access to
convenient transportation. Moreover, recultivation has usually occurred within a relative short
period after abandonment due to the low reclamation costs, as bushes or trees increase the costs
of recultivation [73].
In Zhongduo, recultivation of abandoned cropland was primarily driven by agricultural
product prices and land transfer policies. In general, as the price of agricultural products
increase rapidly, farmers intend to recultivate the abandoned cropland with relatively good
quality in the following years. In addition, as land transfer policies have been implemented,Sustainability 2019, 11, 5951 20 of 24
some abandoned cropland has been granted to large farming households for grain production.
Because these factors can have a high uncertainty, e.g., crop prices, recultivation of abandoned
cropland will be an episodic activity employed by farmers.
5.4. Positives and Weaknesses of the Research
This study developed a new approach to map abandoned cropland by monitoring the
annual land-use trajectory of the study area. Comparing to the previous research [1,5,8,13–
14,20,26,28,46], there are two advantages and one weakness of the developed method. First,
different from most of the previous research, this research detected the abandoned cropland
by monitoring the consecutive land-use conversions during a certain period. This kind of
research framework can effectively avoid the misclassification between fallowed cropland and
abandoned cropland by detecting the time of abandonment. Second, an approach
distinguishing spontaneous abandonment from induced abandonment was proposed in this
research. This work has not been conducted in most of the previous research. However, this
research needed to detect the annual land uses of study area. To accomplish this work, a
consecutive and dynamic training sample database is necessary during the research period.
The heavy work is a huge challenge when the method was transferred into a large region.
In this paper, Landsat 8 OLI and HJ-1B satellite images were utilized to identify the
abandoned cropland. The merit of the data is that the images are all free access. Thus, the
approach developed in this paper can be transferred into other regions of the world. In
addition, the spatial resolution of the data is 30 m, meeting most of the requirements of
mapping abandoned cropland. However, there is one demerit for the data. The temporal
resolution of the data is not very high. Thus, in some mountainous regions, the available
Landsat images may not cover the whole region due to the limitation of clouds. This situation
needs to couple multi-source data to accomplish the research.
6. Conclusions
This research developed an annual land-use trajectory approach to identify abandoned
cropland in mountainous areas of China. By coupling a CART classification model and land-
use trajectory tracing approach, the abandoned cropland in Zhongduo Town was mapped. To
better describe the abandoned cropland, a detailed classification was proposed. Five types of
cropland, spontaneously abandoned, induced abandoned, fallow, stable, and lost, were
mapped. In addition, using the land-use trajectory trace approach, the timing and recultivation
of abandoned cropland were mapped.
It was found that the average spontaneous abandonment rate in Zhongduo from 2012 to
2017 was 23.16%, which is in good agreement with published household survey data from
nearby regions. Among the abandoned and fallowed croplands, spontaneously abandoned
cropland accounted for the largest proportion, 23.16%, followed by fallowed cropland, 13.69%,
and induced, 8.40%. Spontaneously abandoned cropland was abandoned for an average of 3.45
years. In addition, 50.54% of spontaneously abandoned cropland was recultivated in
comparison to only 12.91% of induced cropland. The relatively good land quality and policy
subsidy assisted in maintaining stable induced abandoned cropland. Fluctuations in
agricultural production prices and the land transfer policy has resulted in recultivated
spontaneously abandoned cropland.
Funding: The research was supported by the Projects of National Natural Science Foundation of China
(Grant No. 41671177), the Second Tibetan Plateau Scientific Expedition and Research (Grant No.
2019QZKK0603), the Opening Research Project of Key Laboratory of Land Use of Ministry of Natural
Resources (No.20191511228), the Key Research and Development Program of China (Grant No.
2016YFA0602402), the Program of Key Laboratory of Earth Observation and Geospatial Information
Science of NASG (Grant No. 201807), and the Project of Research of Standards Drafting Expert Database
from China National Institute of Standardization.Sustainability 2019, 11, 5951 21 of 24
Acknowledgments: I thank Yuchen Guo for the help on creating training and reference data.
References
1. Shi, T.; Li, X.; Xin, L.; Xu, X. The spatial distribution of farmland abandonment and its influential
factors at the township level: A case study in the mountainous area of China. Land Use Policy 2018,
70, 510–520, doi:10.1016/j.landusepol.2017.10.039.
2. Queiroz, C.; Beilin, R.; Folke, C.; Lindborg, R. Farmland abandonment: Threat or opportunity for
biodiversity conservation? A global review. Front. Ecol. Environ. 2014, 12, 288–296,
doi:10.1890/120348.
3. Xu, F.; Ho, H.C.; Chi, G.; Wang, Z. Abandoned rural residential land: Using machine learning
techniques to identify rural residential land vulnerable to be abandoned in mountainous areas.
Habitat Int. 2019, 84, 43–56, doi:10.1016/j.habitatint.2018.12.006.
4. Shi, T.; Li, X.; Xin, L.; Xu, X. Analysis of Farmland Abandonment at Parcel Level: A Case Study in
the Mountainous Area of China. Sustainability 2016, 8, 988.
5. Zambon, I.; Ferrara, A.; Salvia, R.; Mosconi, M.E.; Fici, L.; Turco, R.; Salvati, L. Rural Districts
between Urbanization and Land Abandonment: Undermining Long-Term Changes in
Mediterranean Landscapes. Sustainability 2018, 10, doi:10.3390/su10041159.
6. Zhang, Y.; Li, X.; Song, W.; Zhai, L. Land abandonment under rural restructuring in China explained
from a cost-benefit perspective. J. Rural Stud. 2016, 47, 524–532, doi:10.1016/j.jrurstud.2016.06.019.
7. Hao, P.; Tang, S. Floating or settling down: the effect of rural landholdings on the settlement
intention of rural migrants in urban China. Environ. Plan. A Econ. Space 2015, 47, 1979–1999,
doi:10.1177/0308518X15597131.
8. Löw, F.; Prishchepov, A.; Waldner, F.; Dubovyk, O.; Akramkhanov, A.; Biradar, C.; Lamers, J.
Mapping Cropland abandonment in the Aral Sea Basin with MODIS time series. Remote Sens. 2018,
10, 159.
9. Rudel, T.K.; Schneider, L.; Uriarte, M.; Turner, B.L.; DeFries, R.; Lawrence, D.; Geoghegan, J.; Hecht,
S.; Ickowitz, A.; Lambin, E.F.; et al. Agricultural intensification and changes in cultivated areas,
1970–2005. Proc. Natl. Acad. Sci. USA 2009, 106, 20675, doi:10.1073/pnas.0812540106.
10. Navarro, L.M.; Pereira, H.M. Rewilding Abandoned Landscapes in Europe. Ecosystems 2012, 15, 900–
912, doi:10.1007/s10021-012-9558-7.
11. Lu, H.; Xie, H.; Lv, T.; Yao, G. Determinants of cultivated land recuperation in ecologically damaged
areas in China. Land Use Policy 2019, 81, 160–166, doi:10.1016/j.landusepol.2018.10.052.
12. Xie, H.; Wang, W.; Zhang, X. Evolutionary game and simulation of management strategies of fallow
cultivated land: A case study in Hunan province, China. Land Use Policy 2018, 71, 86–97,
doi:10.1016/j.landusepol.2017.11.050.
13. García-Ruiz, J.M.; Lana-Renault, N. Hydrological and erosive consequences of farmland
abandonment in Europe, with special reference to the Mediterranean region—A review. Agric.
Ecosyst. Environ. 2011, 140, 317–338, doi:10.1016/j.agee.2011.01.003.
14. Corbelle-Rico, E.; Crecente-Maseda, R.; Santé-Riveira, I. Multi-scale assessment and spatial
modelling of agricultural land abandonment in a European peripheral region: Galicia (Spain), 1956–
2004. Land Use Policy 2012, 29, 493–501, doi:10.1016/j.landusepol.2011.08.008.
15. Zakkak, S.; Kakalis, E.; Radović, A.; Halley, J.M.; Kati, V. The impact of forest encroachment after
agricultural land abandonment on passerine bird communities: The case of Greece. J. Nat. Conserv.
2014, 22, 157–165, doi:10.1016/j.jnc.2013.11.001.
16. Juan, J.E.R.; Díaz, R. Evolution of land abandonment in the eastern region of murcia. Bol. Asoc. Geogr.
Esp. 2016, 71, 457–462.
17. Zhang, Y.; Li, X.; Song, W. Determinants of cropland abandonment at the parcel, household and
village levels in mountain areas of China: A multi-level analysis. Land Use Policy 2014, 41, 186–192,
doi:10.1016/j.landusepol.2014.05.011.
18. Song, W.; Pijanowski, B.C. The effects of China’s cultivated land balance program on potential land
productivity at a national scale. Appl. Geogr. 2014, 46, 158–170, doi:10.1016/j.apgeog.2013.11.009.
19. Li, S.; Li, X.;Xin, L. Extent and distribution of cropland abandonment in Chinese mountainous areas.
Resour. Sci. 2017, 39, 1801–1811.Sustainability 2019, 11, 5951 22 of 24
20. Zhang, X.; Zhao, C.; Dong, J.; Ge, Q. Spatio-temporal pattern of cropland abandonment in China
from 1992 to 2017: A Meta-analysis. Acta Geogr.Sin. 2019, 74, 411–420.
21. Khanal, N.R.; Watanabe, T. Abandonment of Agricultural Land and Its Consequences. Mt. Res. Dev.
2006, 26, 32–40.
22. Kuntz, A.K.; Beaudry, F.; Porter, L.K. Farmers’ Perceptions of Agricultural Land Abandonment in
Rural Western New York State. Land 2018, 7, doi:10.3390/land7040128.
23. Wang, T.; Kazak, J.; Han, Q.; De Vries, B. A framework for path-dependent industrial land transition
analysis using vector data. Eur. Plan. Stud. 2019, 27, 1391–1412, doi:10.1080/09654313.2019.1588852.
24. Dara, A.; Baumann, M.; Kuemmerle, T.; Pflugmacher, D.; Rabe, A.; Griffiths, P.; Hölzel, N.; Kamp,
J.; Freitag, M.; Hostert, P. Mapping the timing of cropland abandonment and recultivation in
northern Kazakhstan using annual Landsat time series. Remote Sens. Environ. 2018, 213, 49–60,
doi:10.1016/j.rse.2018.05.005.
25. Schierhorn, F.; Müller, D.; Beringer, T.; Prishchepov, A.V.; Kuemmerle, T.; Balmann, A. Post-Soviet
cropland abandonment and carbon sequestration in European Russia, Ukraine, and Belarus. Glob.
Biogeochem. Cycles 2013, 27, 1175–1185, doi:10.1002/2013GB004654.
26. Yin, H.; Prishchepov, A.V.; Kuemmerle, T.; Bleyhl, B.; Buchner, J.; Radeloff, V.C. Mapping
agricultural land abandonment from spatial and temporal segmentation of Landsat time series.
Remote Sens. Environ. 2018, 210, 12–24, doi:10.1016/j.rse.2018.02.050.
27. Prishchepov, A.V.; Müller, D.; Dubinin, M.; Baumann, M.; Radeloff, V.C. Determinants of
agricultural land abandonment in post-Soviet European Russia. Land Use Policy 2013, 30, 873–884,
doi:10.1016/j.landusepol.2012.06.011.
28. Prishchepov, A.V.; Radeloff, V.C.; Dubinin, M.; Alcantara, C. The effect of Landsat ETM/ETM+
image acquisition dates on the detection of agricultural land abandonment in Eastern Europe.
Remote Sens. Environ. 2012, 126, 195–209, doi:10.1016/j.rse.2012.08.017.
29. Klein Goldewijk, K.; Beusen, A.; Doelman, J.; Stehfest, E. New anthropogenic land use estimates for
the Holocene; HYDE 3.2. Earth Syst. Sci. Data 2016, 9, 927–953.
30. Yu, Z.; Lu, C. Historical cropland expansion and abandonment in the continental U.S. during 1850
to 2016. Glob. Ecol. Biogeogr. 2018, 27, 322–333, doi:10.1111/geb.12697.
31. Alonso-Sarría, F.; Martínez-Hernández, C.; Romero-Díaz, A.; Cánovas-García, F.; Gomariz-Castillo,
F. Main Environmental Features Leading to Recent Land Abandonment in Murcia Region
(Southeast Spain). Land Degrad. Dev. 2016, 27, 654–670, doi:10.1002/ldr.2447.
32. Golosov, V.; Yermolaev, O.; Rysin, I.; Vanmaercke, M.; Medvedeva, R.; Zaytseva, M. Mapping and
spatial-temporal assessment of gully density in the Middle Volga region, Russia. Earth Surf. Process.
Landf. 2018, 43, 2818–2834, doi:10.1002/esp.4435.
33. Poyatos, R.; Latron, J.; Llorens, P. Land Use and Land Cover Change After Agricultural
Abandonment: The Case of a Mediterranean Mountain Area (Catalan Pre-Pyrenees). Mt. Res. Dev.
2003, 23, 362–368.
34. Incze, J.; Novák, T.J. Identification of extent, topographic characteristics and land abandonment
process of vineyard terraces in the Tokaj-Hegyalja wine region between 1784 and 2010. J. Maps 2016,
12, 507–513, doi:10.1080/17445647.2016.1195295.
35. Kolecka, N. Height of Successional Vegetation Indicates Moment of Agricultural Land
Abandonment. Remote Sens. 2018, 10, doi:10.3390/rs10101568.
36. Cervera, T.; Pino, J.; Marull, J.; Padró, R.; Tello, E. Understanding the long-term dynamics of forest
transition: From deforestation to afforestation in a Mediterranean landscape (Catalonia, 1868–2005).
Land Use Policy 2019, 80, 318–331, doi:10.1016/j.landusepol.2016.10.006.
37. Alcantara, C.; Kuemmerle, T.; Prishchepov, A.V.; Radeloff, V.C. Mapping abandoned agriculture
with multi-temporal MODIS satellite data. Remote Sens. Environ. 2012, 124, 334–347,
doi:10.1016/j.rse.2012.05.019.
38. Shao, J.a.; Zhang, S.; Li, X. Farmland marginalization in the mountainous areas: Characteristics,
influencing factors and policy implications. J. Geogr. Sci. 2015, 25, 701–722, doi:10.1007/s11442-015-
1197-4.
39. Terres, J.-M.; Scacchiafichi, L.N.; Wania, A.; Ambar, M.; Anguiano, E.; Buckwell, A.; Coppola, A.;
Gocht, A.; Källström, H.N.; Pointereau, P.; et al. Farmland abandonment in Europe: Identification ofYou can also read