Impacts of streamflow alteration on benthic macroinvertebrates by mini hydro diversion in Sri Lanka - Nature
←
→
Page content transcription
If your browser does not render page correctly, please read the page content below
www.nature.com/scientificreports
OPEN Impacts of streamflow alteration
on benthic macroinvertebrates
by mini‑hydro diversion in Sri
Lanka
Dinuke S. N. Munasinghe1, Mohamed M. M. Najim2,3*, Silvia Quadroni4 &
Muneeb M. Musthafa3
Our study focused on quantifying the alterations of streamflow at a weir site due to the construction
of a mini-hydropower plant in the Gurugoda Oya (Sri Lanka), and evaluating the spatial responses
of benthic macroinvertebrates to altered flow regime. The HEC–HMS 3.5 model was applied to
the Gurugoda Oya sub-catchment to generate streamflows for the time period 1991–2013. Pre-
weir flows were compared to post-weir flows with 32 Indicators of Hydrologic Alteration using
the range of variability approach (RVA). Concurrently, six study sites were established upstream
and downstream of the weir, and benthic macroinvertebrates were sampled monthly from May
to November 2013 (during the wet season). The key water physico-chemical parameters were also
determined. RVA analysis showed that environmental flow was not maintained below the weir. The
mean rate of non-attainment was ~ 45% suggesting a moderate level of hydrologic alteration. Benthic
macroinvertebrate communities significantly differed between the study sites located above and
below the weir, with a richness reduction due to water diversion. The spatial distribution of zoobenthic
fauna was governed by water depth, dissolved oxygen content and volume flow rate. Our work
provides first evidence on the effects of small hydropower on river ecosystem in a largely understudied
region. Studies like this are important to setting-up adequate e-flows.
The alteration of river flow regimes is claimed to be the most serious and continuing threat to the ecological
sustainability of riverine e nvironments1,2. The duration and seasonal timing of associated low flow conditions,
along with the reduced flow variability, strongly influence riverine organisms directly and via changes to habitat2,3.
It is thus important to provide means of ensuring future developments that are sustainable and able to protect
biological richness and ecosystem functions. This has led to a rapid increase of studies aimed to quantitatively
understand aquatic ecosystem responses to various degrees of flow a lteration4,5.
Small hydropower projects offer one of the most promising energy resources for long-term sustainable devel-
opment in Sri Lanka. Small hydropower plants have been, and to some extent still are, viewed as an environmen-
tally benign energy source, and are categorized by the Sustainable Energy Authority of Sri Lanka as a green and
renewable technology6. Small hydropower can, however, exert multiple impacts on local environment (e.g. altera-
tion of flow regime with consequent changes of water physico-chemical parameters and habitat structure), and
the impacts which are perceived to be of critical importance are ecological, centered on aquatic flora and fauna.
The underlying cause could be attributed to the non-maintenance below the weir of sufficient ‘environmental
flow’ (e-flow, i.e. a natural flow paradigm comprising the five components of magnitude, frequency, duration,
timing and rate of change), which is recognized as the key to sustaining biodiversity and ecosystem integrity7.
Previous works on the effects of water depletion on benthic macroinvertebrates in river reaches downstream from
diversion structures have frequently pointed out significant impairment, particularly in terms of richness reduc-
tion related to habitat trivialization3. The impact is higher in river reaches where hydrologic alteration is more
iverted8–10, and where flow alterations cause
severe, i.e. where the entire flow or a very large proportion of it is d
relevant habitat changes in terms of substrate heterogeneity reduction, nutrient enrichment and temperature
1
Department of Geography, University of Alabama, Tuscaloosa, AL 35487, USA. 2Department of Zoology
and Environmental Management, University of Kelaniya, Kelaniya, Sri Lanka. 3Department of Biosystems
Technology, Faculty of Technology, South Eastern University of Sri Lanka, University Park, Oluvil #32360, Sri
Lanka. 4Department of Theoretical and Applied Sciences, University of Insubria, 21100 Varese, Italy. *email:
mnajim@kln.ac.lk
Scientific Reports | (2021) 11:546 | https://doi.org/10.1038/s41598-020-79576-5 1
Vol.:(0123456789)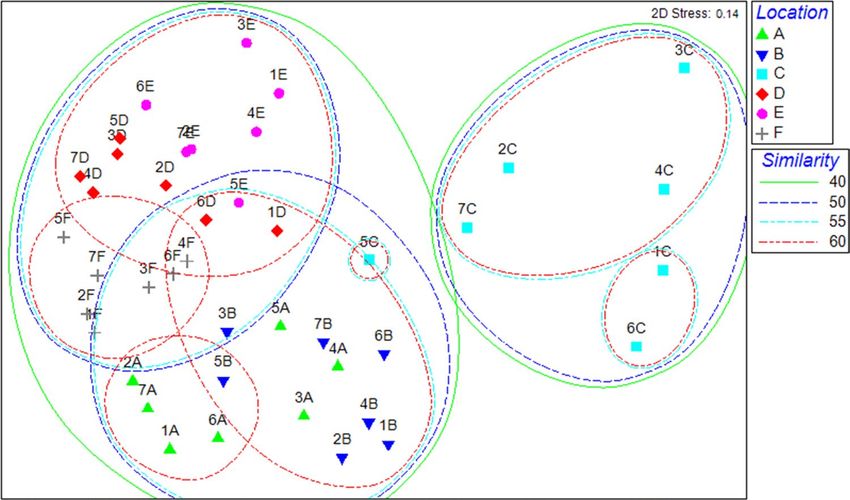
www.nature.com/scientificreports/
regime alteration11–13. Biological responses to flow alterations thus strictly depend on the context but also vary
according to the kind of off-stream diversion scheme. To date, much of the research has been conducted on dams
and impoundments14–17, mainly of large size, and few studies have assessed the ecological effects of run-of-the-
river schemes18,19 and minor intakes20–22.
Benthic macroinvertebrates are an important component of the river biota and are indicators of river
health23,24. There is a wealth of literature suggesting that macroinvertebrate community composition is tightly
linked to instream hydraulic c onditions25–27. The knowledge of associations between environmental factors and
zoobenthic assemblages is essential in understanding how aquatic communities in a particular geographic area
are structured by the physical and chemical make-up of their environment, how they are affected by alterations
to those conditions and, as a consequence, how the health of the entire riverine ecosystem is determined. This
knowledge is the base to improve managerial decisions in water resource governance.
A growing need to predict the biological impacts associated with water management activities and to set
water management targets that maintain the integrity of riverine ecosystems has created the scientific discipline
of ‘in-stream flow’ modelling and design. The primary application of in-stream flow models has been the design
of e-flow regimes to guide sustainable water abstractions. Thus, it is evident that decisions on water regulation
projects would benefit if they were informed by quantitative predictions of the ecological effects of varying
degrees of streamflow alteration. Richter et al.7,28 developed and demonstrated the Range of Variability Approach
(RVA), a holistic e-flow methodology, for establishing river management targets by incorporating the concept of
natural hydrologic variability. RVA accepts that it is not possible to maintain the full range of natural streamflow
variability in regulated or otherwise affected river systems, but supports efforts to manage hydraulic alterations in
a manner that minimizes impacts on natural hydrologic variability and advocates conservation of native aquatic
biodiversity and protection of natural ecosystem functions. In recent years, this approach or a revised version
was successfully applied by many a uthors29–32.
Most developing countries still lack the technical and institutional capacity to establish environmental water
allocation practices and p olicies33. The existing methods of e-flow assessment are either complex and resource-
intensive or not tailor-made for the specific conditions of a country, region or basin34. This is the situation in
Sri Lanka. In this country, hydroelectricity is the oldest and main source of electricity generation, with a share
of nearly 45% of the total available grid capacity in 20106. However, there exists no lawful regulation stipulating
the exact quantity of streamflow that should be released as e-flow. In this context, RVA could allow to evaluate
the post-diversion circumstances in relation to pre-diversion flows and set management targets to maintain the
riverine ecosystems. Since the e-flow concept is relatively new to Sri Lanka, it is also of importance to create
awareness among responsible authorities through relevant studies on e-flow assessment.
Therefore, in our study, a holistic e-flow approach for determining streamflow requirements to sustain ben-
thic macroinvertebrate communities and consequently river health below the weir of a small (approx. 5000 kW)
hydropower plant in the Gurugoda Oya (a river in Sri Lanka) was explored. Specific aims of the study were (1) to
calibrate and validate Hydrologic Engineering Centre—Hydrologic Modelling System (HEC–HMS) 3.5 model
and generate long-term flow data for the assessment of post-weir hydrologic alterations, (2) to investigate the
spatial variation of water physico-chemical parameters and zoobenthic assemblages above and below the weir,
and (3) to identify a-posteriori which physico-chemical parameters are useful to predict the macroinvertebrate
community composition through the application of Distance-based Linear Model (DistLM).
We expected that flow abstraction could determine marked changes of key environmental factors which in
turn could be associated to biodiversity reduction. We carried out our work during the wet season when the
differences due to flow abstraction between impacted and unimpacted sites could be greatest.
Results and discussion
Degree of hydrologic alteration due to mini‑hydro diversion. Figure 1a and b show the goodness
of fit of simulated flow values against observed flow values for the calibration and validation of HEC–HMS 3.5
model for the Holombuwa catchment. Calibration for the time period 1991–2001 yielded a best scenario of
75.8% of residual points falling within ± 1 SD range, and 96.1% within ± 2 SD range. Moreover, a R2 value of
0.66 and a normal distribution of residuals were detected. However, the model slightly over-predicted flows at
comparatively lower monthly flow ranges (10–15 m 3/s). Percentage of residual points within ± 1 SD and ± 2 SD,
2
and R value of validation results for the next 12 years (2002-2013) were 78.9%, 96.5% and 0.67, respectively.
Also the comparison of residuals between observed and simulated flows for the entire study period (1991-2013)
yielded results (percentage of residual points within ± 1 SD and ± 2 SD, and R 2 value of 79.3%, 96.7%, and 0.66,
respectively) above the limits suggested by Mood et al.35, indicating that the validity of the model held even for
long periods of runoff simulations in the Holombuwa catchment. The model could thus be successfully applied
to the Gurugoda Oya sub-catchment, and RVA targets and rate of non-attainment for the 32 considered Indica-
tors of Hydrologic Alteration (IHAs) were calculated (Fig. 1c and Table 1). Due to the skewness in the distribu-
tion of the pre-weir annual values for certain indicators, the mean -1 SD values fell outside (below) the pre-weir
low range limits. For these parameters, the pre-weir minima of their range were selected.
The rate of non-attainment of the group 1 IHAs, which represent the magnitude and timing of flows, was
above 30% for the post-weir period. During certain months the rate of non-attainment was 100%. The decrease
in the monthly mean flows suggests a drastic drawdown in the water table in the areas downstream of the weir.
Group 2 parameters indicated that the daily, weekly, monthly and quarterly minimum flows were negatively
influenced by weir regulation. Relevant alterations were also observed in parameters of groups 4 and 5, which
represent the timing and frequency, and rate of changes of flow regimes, respectively. Rate of non-attainment of
the group 4 IHAs varied between 0 and 100%, and of group 5 IHAs mostly between 67 and 100%.
Scientific Reports | (2021) 11:546 | https://doi.org/10.1038/s41598-020-79576-5 2
Vol:.(1234567890)
www.nature.com/scientificreports/
Figure 1. Goodness of fit of simulated (HEC–HMS 3.5 model) and observed (Holombuwa gauging station)
flow data, (a) model calibration 1991–2001 and (b) validation 2002–2013. (c) Example of the Range of
Variability Approach (RVA) application for the Gurugoda Oya sub-catchment: estimated post-weir values of
monthly magnitude of flows in August in comparison to simulated pre-weir flows.
In summary, out of the 32 IHAs, 11 parameters scored a rate of non-attainment of 33%, and 12 parameters
between 50 and 100%. The calculated mean rate of non-attainment of the flow of the Gurugoda Oya below the
weir was around 45% (i.e. moderate alteration). Our results proved that the IHA method encasing RVA targets is
an easy and useful tool to quantify the hydrologic alteration in the study area as already reported for many rivers
worldwide36–40. However, these results were preliminary since only three years of data (2011–2013) were used for
IHA calculation for the post-weir period. Hence, the high level of fluctuation of rate of non-attainment scored
within a single IHA category. It is expected that with time, the fluctuations will decrease and a more reasonable
outcome be proposed. However, the implementation of the RVA at an early stage of weir operations could set
baselines upon which future river management decisions could be taken and weir operations be performed. For
example, the fact that certain parameters scored a rate of non-attainment of 100%, suggests a significant level
of hydrologic alteration and calls for immediate changes in weir operations. Thus, the application of RVA to the
weir site could be seen as a timely approach to be used as the base for future analyses.
Effects of weir on water physico‑chemistry and benthic macroinvertebrates. A significant dif-
ference of the measured physico-chemical parameters (except for pH and five-day Biological Oxygen Demand—
BOD5) was recorded between study sites upstream (F–E–D) and downstream (C–B–A) of the weir (one-way
ANOVA, p < 0.05, and Tukey test for pairwise comparison between sites F–E–D and C–B–A, p < 0.05). The most
prominent feature was the drastic reduction in mean flow velocity and volume flow rate values at the sites below
Scientific Reports | (2021) 11:546 | https://doi.org/10.1038/s41598-020-79576-5 3
Vol.:(0123456789)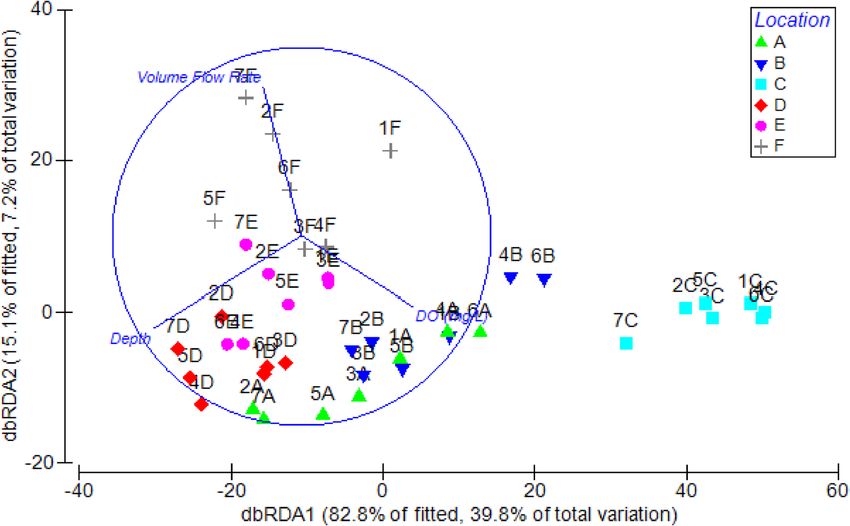
www.nature.com/scientificreports/
Pre-weir Post-weir RVA targets
Mean ± SD Mean ± SD Low High Rate of non-attainment (%)
Group 1 IHAs ( m3/s)
Mean flow of January 1.2 ± 1.0 0.3 ± 0.3 0.2 2.2 33
Mean flow of February 1.4 ± 1.4 0.3 ± 0.3 0.0 2.8 33
Mean flow of March 1.1 ± 1.4 0.5 ± 0.6 0.1 2.5 100
Mean flow of April 2.6 ± 2.2 1.2 ± 1.0 0.4 4.8 33
Mean flow of May 4.3 ± 3.2 1.6 ± 1.5 1.1 7.4 33
Mean flow of June 4.7 ± 3.8 2.3 ± 3.0 0.9 8.5 33
Mean flow of July 2.4 ± 1.8 0.5 ± 0.4 0.6 4.3 33
Mean flow of August 2.2 ± 1.4 0.1 ± 0.1 0.9 3.6 100
Mean flow of September 2.6 ± 2.2 0.3 ± 0.1 0.4 4.8 100
Mean flow of October 6.3 ± 2.3 0.8 ± 0.8 4.0 8.5 100
Mean flow of November 5.4 ± 5.2 3.7 ± 4.8 0.9 10.6 50
Mean flow of December 2.4 ± 2.1 1.0 ± 1.2 0.2 4.5 50
Group 2 IHAs ( m3/s)
1-day minimum flow 0.1 ± 0.0 0.0 ± 0.0 0.0 0.1 33
3-day minimum flow 0.1 ± 0.0 0.0 ± 0.1 0.0 0.1 67
7-day minimum flow 0.1 ± 0.1 0.1 ± 0.1 0.0 0.2 33
30-day minimum flow 0.3 ± 0.3 0.1 ± 0.3 0.0 0.6 67
90-day minimum flow 1.0 ± 0.7 0.4 ± 1.1 0.3 1.7 0
1-day maximum flow 14.8 ± 5.7 5.7 ± 1.3 9.1 20.5 0
3-day maximum flow 13.6 ± 5.1 5.3 ± 1.3 8.5 18.7 0
7-day maximum flow 12.1 ± 4.3 4.8 ± 0.9 7.7 16.4 0
30 day maximum flow 8.2 ± 3.4 3.3 ± 2.1 4.8 11.5 0
90-day maximum flow 5.1 ± 1.7 2.0 ± 0.8 3.4 6.8 0
Group 3 IHAs
Julian date of annual minimum* 127.5 ± 102.4 – – – –
Julian date of annual maximum 101.3 ± 67.5 76.8 ± 87.8 135 169 33
Group 4 IHAs
Low pulse count 90.9 ± 0.3 33.8 ± 0.0 90.7 91.0 100
High pulse count 91.0 ± 0.0 34.0 ± 0.6 91.0 91.0 33
Mean low pulse duration 48.5 ± 20.7 21.9 ± 5.9 27.8 69.3 0
Mean high pulse duration 37.9 ± 12.3 16.9 ± 22.9 25.6 50.2 33
Group 5 IHAs
Mean fall rate -0.2 ± 0.1 -0.1 ± 0.1 -0.3 -0.1 0
Mean rise rate 0.9 ± 0.2 0.3 ± 0.6 0.7 1.0 100
Fall count 276.4 ± 23.6 91.5 ± 35.8 252.8 300.0 67
Rise count 67.6 ± 8.9 22.4 ± 24.4 58.7 76.5 100
Table 1. Means and standard deviations of the 32 Indicators of Hydrologic Alteration (IHAs) calculated for
the Gurugoda Oya before and after the weir construction. Range of Variability Approach (RVA) targets and
rate of non-attainment of the considered indicators are also reported. * obtained more than one annual minima
the diversion point (Table 2). It was also evident that, within the sampling period, the volume flow rate above
the weir fluctuated heavily whilst below the weir fluctuated within a very narrow range. This shows that the flow
released downstream of the weir was heavily regulated irrespective of the rainfall to the locality. Hydropower
exploitation frequently induces reduction in streamflow magnitude, which is a strong predictor of biological
integrity41. However, the impact on aquatic communities is expected to be lower in case of run-of-the-river
schemes18,19 and minor intakes20–22 than in case of reservoirs14–16. In the latter case, more severe reductions of the
flow variability and changes of flow timing add to the substantial decrease of the flow magnitude.
During the sampling period (May-November), 16 benthic macroinvertebrate taxa belonging to three phyla,
i.e. Annelida (Oligochaeta), Mollusca (Gastropoda and Bivalvia) and Arthropoda (Malacostraca and Insecta),
were found at the six sampling sites (Table 3).
Average taxon richness recorded at sites above the weir (12–13) was higher than that at sites below the weir
(7–9). However, the cluster analysis detected three major groups at around 50% of similarity (Fig. 2). Sites above
the weir differed from sites below the weir, and, among the latter sites, sites A and B differed from site C, i.e. the
site closest to the weir (one-way ANOSIM, p
www.nature.com/scientificreports/
Sites above the weir Sites below the weir
Water parameters Site F Site E Site D Site C Site B Site A
Flow velocity (m/s) 0.19 ± 0.02d 0.16 ± 0.02b,d 0.11 ± 0.01b,c 0.01 ± 0.00a 0.05 ± 0.01a,c 0.04 ± 0.00a
(0.12–0.29) (0.10–0.25) (0.08–0.19) (0.01–0.02) (0.03–0.07) (0.03–0.06)
Temperature (°C) 27.54 ± 0.03a 27.54 ± 0.03a 27.48 ± 0.04a 28.32 ± 0.05b 28.29 ± 0.04b 27.53 ± 0.10a
(27.42–27.68) (27.46–27.66) (27.31–27.65) (28.12–28.55) (28.14–28.44) (27.23–27.85)
Depth (cm) 62.48 ± 3.56a,b 66.00 ± 2.45b 71.62 ± 2.73b 29.33 ± 1.36c 50.38 ± 3.16a 60.38 ± 5.29a,b
(50.67–78.00) (57.67–76.33) (62.00–83.67) (25.67–37.00) (39.00–59.33) (41.33–79.67)
pH 6.98 ± 0.02 a 6.98 ± 0.02 a 6.99 ± 0.02 a 7.00 ± 0.04 a 6.93 ± 0.05 a 6.94 ± 0.05a
(6.91–7.06) (6.90–7.08) (6.91–7.06) (6.81–7.18) (6.74–7.12) (6.74–7.07)
Conductivity (µS/cm) 31.26 ± 0.25b 31.75 ± 0.21b 31.66 ± 0.25b 33.35 ± 0.35a 33.47 ± 0.16a 33.49 ± 0.11a
(30.27–32.23) (31.23–32.85) (30.68–32.67) (31.27–34.13) (32.85–34.10) (33.19–34.08)
TDS (mg/L) 20.00 ± 0.00b 20.00 ± 0.00b 20.14 ± 0.13b 21.57 ± 0.27a 21.71 ± 0.17a 21.86 ± 0.13a
(20.00–20.00) (20.00–20.00) (20.00–21.00) (20.00–22.00) (21.00–22.00) (21.00–22.00)
DO (mg/L) 7.46 ± 0.10d 7.94 ± 0.03c 8.10 ± 0.05c 9.77 ± 0.06b 8.64 ± 0.04a 8.71 ± 0.04a
(7.20–7.80) (7.80–8.00) (7.90–8.20) (9.60–10.00) (8.50–8.80) (8.50–8.80)
BOD5 (mg/L) 0.93 ± 0.04a 0.99 ± 0.05a 0.96 ± 0.05a 1.04 ± 0.06a 1.04 ± 0.06a 1.04 ± 0.07a
(0.80–1.10) (0.80–1.20) (0.80–1.20) (0.70–1.20) (0.80–1.20) (0.80–1.30)
Volume flow rate (m3/s) 4.51 ± 0.97c 2.28 ± 0.42b 1.49 ± 0.30a,b 0.13 ± 0.02a 0.72 ± 0.07a,b 0.74 ± 0.15a,b
(2.28–9.46) (1.12–4.45) (0.87–2.87) (0.06–0.21) (0.35–1.00) (0.27–1.35)
Table 2. Physico-chemical parameters of water measured at the six sampling sites of the Gurugoda Oya (n=7
for each site). Sites F–D–E are located above the weir, and sites C–B–A below the weir (see Fig. 5). Values
are mean ± SD, and range (min-max) within brackets. TDS, Total Dissolved Solids; DO, Dissolved Oxygen;
BOD5, five-day Biological Oxygen Demand. Different superscript letters in a row show significant differences
(p < 0.05) indicated by Tukey test after one-way ANOVA.
Sites above the weir Sites below the weir
Site F Site E Site D Site C Site B Site A
Taxon AA RA AA RA AA RA AA RA AA RA AA RA
Oligochaeta Aeolosoma sp. 0 0 6 1.9 5 1.2 1 0.7 0 0 2 0.5
Gastropoda Pila sp. 840 75.3 217 68.2 316 76 33 22.2 200 80.6 368 91.3
Gyraulus sp. 117 10.5 0 0 0 0 0 0 0 0 0 0
Paludomus sp. 26 2.3 10 3.1 2 0.5 0 0 0 0 0 0
Melanoides sp. 0 0 0 0 0 0 0 0 6 2.4 0 0
Bivalvia Lamellidens sp. 15 1.3 21 6.6 22 5.3 0 0 0 0 0 0
Amphipoda Caridina sp. 17 1.5 14 4.4 21 5 1 0.7 4 1.6 2 0.5
Decapoda Paratelphusasp. 23 2.1 7 2.2 11 2.6 0 0 0 0 1 0.2
Coleoptera Eubrianax sp. 0 0 5 1.6 2 0.5 0 0 0 0 1 0.2
Diptera Tabanid larvae 23 2.1 2 0.6 16 3.8 4 2.7 0 0 0 0
Ephemeroptera Mayfly nymphs 20 1.8 3 0.9 4 1 17 11.4 21 8.5 15 3.7
Odonata Damselfly naiads 10 0.9 21 6.6 2 0.5 28 18.8 6 2.4 2 0.5
Dragonfly naiads 2 0.2 10 3.1 13 3.1 13 8.7 1 0.4 6 1.5
Plecoptera Stonefly nymphs 3 0.3 0 0 0 0 34 22.8 0 0 0 0
Trichoptera Caddisfly nymphs 20 1.8 1 0.3 2 0.5 18 12.1 10 4 6 1.5
Hemiptera Heleocoris bengalensis 0 0 1 0.3 0 0 0 0 0 0 0 0
Average total abundance 1116 318 416 149 248 403
Table 3. The overall average composition (AA = absolute abundance—n. individuals, RA = relative
abundance—%) and distribution of benthic macroinvertebrate communities in the Gurugoda Oya, above (sites
F–E–D) and below (sites C–B–A) the weir (see Fig. 5).
becomes complex as the similarity level increases. The average abundance of all taxa, except for most of the
insect taxa and Melanoides sp. were higher at the upstream sites than at the downstream sites. Gyraulus sp.,
Lamellidens sp., Paludomus sp., and Heleocoris bengalensis were even absent at the downstream locations. Pila
sp. dominated instead all the six study sites except for site C where insect nymphs and larvae displayed similar
relative abundances and the lowest average value of total density was observed (Table 3). This pattern was detected
Scientific Reports | (2021) 11:546 | https://doi.org/10.1038/s41598-020-79576-5 5
Vol.:(0123456789)www.nature.com/scientificreports/
Figure 2. Dendrogram showing the spatial clustering of benthic macroinvertebrate communities between the
six study sites (sites F–E–D are located above the weir and sites C–B-A are located below the weir, see Fig. 5)
from May (1) to November (7), 2013.
Figure 3. Non-metric Multidimensional Scaling (NMDS) plot depicting the spatial variation of the benthic
macroinvertebrate assemblages between the six study sites (sites F–E–D are located above the weir and sites
C–B–A are located below the weir, see Fig. 5) from May (1) to November (7), 2013.
by Shannon-Wiener and Pielou’s evenness index, both recording the highest average values at site C (1.86 and
0.85 respectively). Average values highly (0.44 and 0.20) or slightly (0.78 and 0.40) lower than those detected
at the three upstream sites (diversity range 1.03–1.31, and evenness range 0.42–0.51) were instead recorded at
sites A and B respectively.
The analysis of benthic macroinvertebrate communities thus revealed marked dissimilarities between the
sites downstream of the weir and the control sites, upstream of the weir. Mini-hydro diversion was associated
to taxa loss and consequent richness reduction; only the assemblage detected at site C showed an increase of
diversity and evenness. This variable result is common in studies on benthic macroinvertebrate responses to
flow alterations. In different contexts, reduced streamflow is reported to induce both decrease and increase in
benthos abundance, richness and d iversity15,16,21,42,43. DistLM (best solution: AICc = 281.9, R
2 = 0.48, RSS =
27844) identified flow depth, dissolved oxygen (DO) concentration, and volume flow rate (in order of decreasing
importance) as the environmental variables driving differences in the structure of macroinvertebrate assemblages
of the Gurugoda Oya (Fig. 4), and depicted how different sites are governed by different factors, i.e. site F by the
volume flow rate, site D and E by the water depth and site C by the DO content. The dominance of Pila sp. may be
due to the micro-habitat conditions created by varying flows and effects of drought during the dry s eason44. The
major diversity at site C could be attributed to the low depth of the site and the consequent mixing of the water
Scientific Reports | (2021) 11:546 | https://doi.org/10.1038/s41598-020-79576-5 6
Vol:.(1234567890)www.nature.com/scientificreports/
Figure 4. Ordination of the samples based on dbRDA scores of Distance-based Linear Model (DistLM)
between physico-chemical parameters (see Table 2) among the six sampling sites (sites F–E–D are located above
the weir and sites C–B–A are located below the weir, see Fig. 5).
which makes available sediment-bound nutrients into the water column besides increasing oxygen content and
micro-habitat diversity. The habitat changes generated by streamflow reduction due to water abstraction can vary
widely, depending on channel morphology and substrate stability, and on the possible related nutrient enrichment
and temperature regime alteration11–13,25. However, the best fit model showed a cumulative percentage variation
below 50% on the two major axis (Fig. 4). A major reason for this could be the contribution of other larger-scale
environmental or biotic factors on the taxa composition to observed trends in abundance rather than reduced
flow. Realistically, it is an interplay of numerous physico-chemical and biotic factors in the hydro-climatic region.
For instance, Jayawardana et al.45 recently highlighted that local riparian forest cover is important in structuring
macroinvertebrate communities in the Uma Oya catchment. Also allochthonous nutrient inputs are reported to
influence zoobenthic assemblages of Eswathu Oya and Yan Oya46. Unfortunately, few other studies on benthic
macroinvertebrate communities of Sri Lanka rivers are a vailable47,48, and none on the effects of hydropower.
Direct comparisons of our data with literature data were thus not feasible, also due to the different resolution
level used for taxa identification and sampling m ethods49. To our knowledge, our results provide first evidence
for a Sri Lanka river of associations between changes in environmental factors and zoobenthic assemblages
consequent to water abstraction due to small hydropower. This is the first step towards the acquisition of the
information required to setting-up adequate e-flows50–53.
Conclusions
The HEC–HMS 3.5 model can be endorsed to be reliably used to simulate Gurugoda Oya flows with proper
calibration and validation. As the transformation method in the model, ‘snyder unit hydrograph method’ could
be recommended for the Gurugoda Oya basin with the ‘initial and constant rate loss’ as the loss method.
The RVA showed that the e-flow was not maintained below the weir throughout 2011-2013. The level of
alteration of flows caused by hydropower plant operations was concluded to be moderate (45%). Our results also
revealed that the prevailing physico-chemical parameters as well as zoobenthic assemblages varied significantly
among the study sites located up- and downstream of the weir. Differences in macroinvertebrate assemblage
structure were associated to water depth, dissolved oxygen concentration and volume flow rate.
Although further research is needed to investigate the impact of mini-hydro diversion at a larger spatial and
temporal scale, our study should help to pay attention to this relevant and increasing issue in a largely under-
studied region such as Sri Lanka. We expect that this finding may be used by Government authorities and other
policy makers involved in disciplines related to water governance (e.g. Irrigation Department, Sustainable Energy
Authority, Ceylon Electricity Board) to make informed decisions on licensing procedures of mini-hydropower
plants, and decisions focused on sectoral water allocations for sustainable development while maintaining the
integrity of riverine ecosystems.
Methods
Study area. The study area is located within Kegalle district in Sri Lanka. It lies entirely within the ‘low
country wet’ agro-ecological zone with an expectancy of annual rainfall of 1900–3200 m m54. The dry season
(rainfall range 50–150 mm) is between November and April, while the wet season (rainfall range 300–500 mm)
due to the south-west monsoon between May and October. The mean annual temperature is 27.8 °C and the
Scientific Reports | (2021) 11:546 | https://doi.org/10.1038/s41598-020-79576-5 7
Vol.:(0123456789)www.nature.com/scientificreports/
mean relative humidity is approximately 80%. Rubber plantations and home gardens cover most (74%) of the
area. Elevation ranges between 20 and 1240 m asl. Our study was carried out at the Hungampola South/Moron-
tota village areas located mid-east in the Gurugoda Oya sub-catchment which was created within the main
Holombuwa catchment (Fig. 5). The reason for the division of a ‘Holombuwa catchment’ and a ‘Gurugoda Oya
sub-catchment’ (catchment in relation to the weir site of the mini-hydropower plant) was due to the availability
of flow data. Since only the Holombuwa catchment has a flow gauging station, the HEC–HMS 3.5 model was
calibrated and validated to this catchment and applied to the Gurugoda Oya sub-catchment to simulate long-
term flows at the weir site.
Model calibration, validation and application. Daily precipitation and monthly evaporation data
(1991–2013) at the Undugoda rain gauging station located within the Holombuwa catchment (Fig. 5a), along
with daily streamflow data (1991–2013) at the Holombuwa gauging station were obtained from the Hydrology
Division of the Department of Irrigation.
For HEC–HMS 3.5 model simulation, the ‘initial and constant rate loss method’ was selected as the loss
method and the ‘Snyder unit hydrograph method’ was selected as the transform method based on the model
calibration and validation reported by Halwatura and N ajim55. The Holombuwa catchment was used to accom-
plish the calibration goal. Daily rainfall data for 11 years (1991–2001) were used in the model and the flows
simulated from each calibration run were tested statistically against the actual measured flow to produce a best
fit model. The calibrated model was then applied for the period 2002–2013 to accomplish the validation goal
and the simulated flows were statistically compared with observed flows for the same time period. Concurrently,
a simulation run was also performed with the entire data set (1991–2013), for a further validation. The model
parameters were adjusted by certain percentages until the statistical evaluation resulted in more than 68% of the
residual points (observed value - simulated value) falling within ± 1SD, more than 95% falling within ± 2 SD
and a R2 value nearest to 1. According to Mood et al.35 a successful model calibration presents the mentioned
thresholds. The best parameter distribution scenario was chosen for the subsequent simulation processes. The
model was applied to the Gurugoda Oya sub-catchment to generate the daily runoff values for the past 23 years
(1991–2013), with the catchment outlet defined as the weir site. The flows which prevailed below the weir (con-
struction period 2006–2010) for the time period 2011–2013 were obtained from data logs of studies conducted
in the region and of this study field-sampling campaign.
Calculation of Indicators of Hydrologic Alteration and rate of non‑attainment. The holistic
e-flow assessment methodology used in this study is based on the RVA developed by Richter et al.7. In the RVA,
the pre-weir streamflow regime (1991–2006) was compared with the post-weir flow regime (2011–2013) using
32 ecologically relevant hydrologic parameters (IHAs) (Table 1).
Measures of central tendency (means) and dispersion [range limits (low and high) and standard deviation]
were calculated from the pre-weir annual series for each of the 32 parameters, which produced 64 inter-annual
statistics for each annual data series (32 measures of central tendency and 32 measures of dispersion), which were
used to characterize inter-annual variations. Values at ±1 SD from the mean were selected as the RVA targets
(lower and upper RVA limits) for each of the 32 IHAs as recommended by Richter et al.7.
The degree of hydrologic alteration or rate of non-attainment of each hydrologic parameter (values that fall
below the lower limit and above the upper limit of calculated RVA targets) after the construction of the weir, was
then calculated using the following equation28:
D = (|No − Ne |/Ne ) × 100 (1)
D is the degree of hydrologic alteration/rate of non-attainment, N o is the observed number of post-impact
years for which the parameter value falls within the RVA target range, N e is expected number of post-impact
years for which the parameter value falls within the RVA target range. Ne can be estimated by P x NT where P
is the percentage of pre-impact years for which the parameter value falls within the RVA target range and NT is
total number of post-impact years. Values between 0 and 33% represent little or no alteration, 33-67% moder-
ate alteration, and 67-100% high alteration. Finally, the degrees of hydrologic alteration of all 32 parameters
were averaged to obtain a single level of alteration of flow regime for the weir site. The IHA software (version
7.0) developed by the Nature Conservancy was used to calculate the 32 IHAs, the RVA targets and the levels of
alterations of the parameters.
Collection of benthic macroinvertebrates and water physico‑chemical parameters. Six sam-
pling sites were selected in the study area to capture the effects of different flow regimes on benthic macroinver-
tebrates. Sampling sites F–D–E and C–B–A were established separately 300 m away from each other along the
Gurugoda Oya, the former three above and the latter three below the weir (Fig. 5b). The study was carried out
from May to November 2013 with monthly intervals between sampling occasions.
At each sampling site, the cross section of the stream was divided into three equal parts and sampling was car-
ried out in the center of these three sections separately. The three replicates were then pooled into one integrated
sample. Macroinvertebrates were collected using a standard D-framed dip net consisting of a D-shaped metal
frame (0.3 m width and 0.3 m height) holding a conical net (mesh aperture 400 μm). A dip and sweep method was
employed where organisms were collected by aggressively disturbing the target habitat. A sweep of 0.5 m length
was made per sampling effort. The net was dipped into the substrate and three such sweeps were performed56 to
collect bottom sediments covering an area of about one square meter57. River substrate varied from pebbles to
boulders in different percentages with a local presence of soft sediment. The depth of each sampling point was
measured using a pole and tape in tandem with benthic sampling. Later in the laboratory, the material retained
Scientific Reports | (2021) 11:546 | https://doi.org/10.1038/s41598-020-79576-5 8
Vol:.(1234567890)www.nature.com/scientificreports/
Figure 5. (a) Location of Kegalle District in Sri Lanka, and of Holombuwa Catchment in the Kegalle District.
The flow and rain gauging station and the Gurugoda Oya sub-catchment (blue) within the Holombuwa
catchment are also shown. The red rectangle includes the area where the weir and the sampling sites are located.
(b) The blow-up shows the six sampling sites with respect to the weir of the mini-hydropower plant in the
Gurugoda Oya sub-catchment. The maps were generated using ArcGIS software (version 10.0, https://enterprise
.arcgis.com/en/).
Scientific Reports | (2021) 11:546 | https://doi.org/10.1038/s41598-020-79576-5 9
Vol.:(0123456789)www.nature.com/scientificreports/
was wet sieved through a mesh (0.5 mm aperture)57 and identified to the nearest possible taxonomic category
using the naked eye and a binocular microscope following the standard identification keys provided by Mendis
and Fernando58 and Starmühlner59.
At each sampling site, each time a biological sample was taken, the physico-chemical parameters of the water
immediately above the bottom were measured. Such parameters were temperature, pH, conductivity, Total
Dissolved Solids (TDS), Dissolved Oxygen (DO), five-day Biological Oxygen Demand ( BOD5) and water flow
velocity. Temperature, pH, conductivity and TDS were measured in situ using the Yellow Springs Instrument
(YSI) 55 water quality logger (USA). The DO concentration was measured in the laboratory using the Winkler
method60, after collecting water samples into amber-colored glass bottles (250 mL) and fixing DO in situ using
manganous sulfate and Winkler reagents. Additional water samples were collected into amber-colored glass
bottles (250 mL), brought to the laboratory, and incubated for five days at room temperature in total darkness.
After the five-day incubation period, DO concentration in each bottle was measured using the Winkler method60
and BOD5 was determined. The water flow velocity was measured by using a float (a piece of Styrofoam) to drift
for a known distance along the water current for a known period of time. Each water parameter was measured
in triplicate and the mean value was calculated later on.
Data analysis. Similarities of macroinvertebrate assemblages were assessed using Bray-Curtis similarity
clustering method61 on square root transformed abundance data. Moreover, Non-metric Multi-Dimensional
Scaling (NMDS)62 was performed to better represent the spatial and temporal clustering of the benthic macroin-
vertebrate communities between the study sites. Analysis of similarities (ANOSIM) was carried out to detect
significant differences of community composition among the six sampling sites. Total density, taxon richness,
Shannon-Wiener diversity index and Pielou’s evenness index were then calculated for each sample. One-way
analysis of variance (ANOVA) and Tukey post-hoc test were used to compare the considered physico-chemical
parameters among the six study sites.
Distance-based Linear Model (DistLM)63 was applied to perform permutational regression between zooben-
thic assemblages and environmental variables assessing the relative contributions of environmental variables
structuring macroinvertebrate communities. Prior to DistLM, draftsman plots and correlation matrices were
produced to assess the distribution of each variable and to identify co-correlating variables. Environmental vari-
ables were square root transformed to normalize their distribution, and since no pairs of variables had a Pear-
son’s correlation coefficient larger than 0.9, all were included in the analysis. The Bray-Curtis matrix on square
root transformed macroinvertebrate abundances was used. DistLM was performed with selection based on the
Akaike information criterion (AIC), step-wise selection procedure and 999 permutations. AIC was chosen as
the method to create the most parsimonious model, as it adds a ‘penalty’ for increases in the number of predic-
tor variables63. Step-wise selection was chosen as it allows for both the addition and removal of a term to the
model at each s tep63. Distance-based Redundancy Analysis (dbRDA) plot was used to provide the best possible
2-dimensional visualization of DistLM result.
All the statistical analysis were carried out using PRIMER V 6.1.16 (equipped with PERMANOVA+ V 1.0.6)
statistical software.
Data availability
Main data generated and analyzed during the current study are included in the manuscript, further information
is available from the corresponding author on reasonable request.
Received: 11 September 2020; Accepted: 10 December 2020
References
1. Tharme, R. E. A global perspective on environmental flow assessment: emerging trends in the development and application of
environmental flow methodologies for rivers. River Res. Appl. 19(5–6), 397–441 (2003).
2. Finn, M. A., Boulton, A. J. & Chessman, B. C. Ecological responses to artificial drought in two Australian rivers with differing
water extraction. Fund. Appl. Limnol. 175(3), 231–248 (2009).
3. Dewson, Z. S., James, A. B. & Death, R. G. A review of the consequences of decreased flow for instream habitat and macroinver-
tebrates. J. N. Am. Benthol. Soc. 26(3), 401–415 (2007).
4. Poff, N. L. & Zimmerman, J. K. Ecological responses to altered flow regimes: a literature review to inform the science and manage-
ment of environmental flows. Freshwater Biol. 55(1), 194–205 (2010).
5. Gillespie, B. R., Desmet, S., Kay, P., Tillotson, M. R. & Brown, L. E. A critical analysis of regulated river ecosystem responses to
managed environmental flows from reservoirs. Freshwater Biol. 60(2), 410–425 (2015).
6. GOSL. CEB statistical digest, Ceylon electricity Board, Colombo, Sri Lanka (2012).
7. Richter, B. D., Baumgartner, J. V., Wigington, R. & Braun, D. P. How much water does a river need?. Freshwater Biol. 37, 231–249
(1997).
8. Dudgeon, D. Effects of water transfer on aquatic insects in a stream in Hong Kong. Regul. River 7, 369–377 (1992).
9. Petts, G. E. & Bickerton, M. A. Influence of water abstraction on the macroinvertebrate community gradient within a glacial stream:
La Borgne d’Arolla, Valais Switzerland. Freshwater Biol. 32, 375–386 (1994).
10. Rader, R. B. & Belish, T. A. Influence of mild to severe flow alterations on invertebrates in three mountain streams. Regul. River
15, 353–363 (1999).
11. Dunbar, M. J. et al. River discharge and local-scale physical habitat influence macroinvertebrate LIFE scores. Freshwater Biol. 55(1),
226–242 (2010).
12. Schneider, S. C. & Petrin, Z. Effects of flow regime on benthic algae and macroinvertebrates: a comparison between regulated and
unregulated rivers. Sci. Total Environ. 579, 1059–1072 (2017).
13. Olden, J. D. & Naiman, R. J. Incorporating thermal regimes into environmental flows assessments: modifying dam operations to
restore freshwater ecosystem integrity. Freshwater Biol. 55(1), 86–107 (2010).
Scientific Reports | (2021) 11:546 | https://doi.org/10.1038/s41598-020-79576-5 10
Vol:.(1234567890)www.nature.com/scientificreports/
14. Mueller, M., Pander, J. & Geist, J. The effects of weirs on structural stream habitat and biological communities. J. Appl. Ecol. 48(6),
1450–1461 (2011).
15. Holt, C. R., Pfitzer, D., Scalley, C., Caldwell, B. A. & Batzer, D. P. Macroinvertebrate community responses to annual flow variation
from river regulation: an 11-year study. River Res. Appl. 31(7), 798–807 (2015).
16. Krajenbrink, H. J. et al. Macroinvertebrate community responses to river impoundment at multiple spatial scales. Sci. Total Environ.
650, 2648–2656 (2019).
17. Mbaka, J. G. & Wanjiru Mwaniki, M. A global review of the downstream effects of small impoundments on stream habitat condi-
tions and macroinvertebrates. Environ. Rev. 23(3), 257–262 (2015).
18. Anderson, D., Moggridge, H., Warren, P. & Shucksmith, J. The impacts of ‘run-of-river’hydropower on the physical and ecological
condition of rivers. Water Environ. J. 29(2), 268–276 (2015).
19. Bilotta, G. S., Burnside, N. G., Turley, M. D., Gray, J. C. & Orr, H. G. The effects of run-of-river hydroelectric power schemes on
invertebrate community composition in temperate streams and rivers. Plos One 12(2), e0171634 (2017).
20. Gabbud, C., Robinson, C. T. & Lane, S. N. Summer is in winter: Disturbance-driven shifts in macroinvertebrate communities
following hydroelectric power exploitation. Sci. Total Environ. 650, 2164–2180 (2019).
21. Quadroni, S., Crosa, G., Gentili, G. & Espa, P. Response of stream benthic macroinvertebrates to current water management in
Alpine catchments massively developed for hydropower. Sci. Total Environ. 609, 484–496 (2017).
22. Rosero-López, D., Knighton, J., Lloret, P. & Encalada, A. C. Invertebrate response to impacts of water diversion and flow regulation
in high-altitude tropical streams. River Res. Appl. 36(2), 223–233 (2019).
23. Ogbeibu, A. E. & Oribhabor, B. J. Ecological impact of river impoundment using benthic macro-invertebrates as indicators. Water
Res. 36(10), 2427–2436 (2002).
24. Álvarez-Cabria, M., Barquín, J. & Juanes, J. A. Spatial and seasonal variability of macroinvertebrate metrics: Do macroinvertebrate
communities track river health?. Ecol. Indic. 10(2), 370–379 (2010).
25. Hart, D. D. & Finelli, C. M. Physical-biological coupling in streams: the pervasive effects of flow on benthic organisms. Annu. Rev.
Ecol. Syst. 30, 363–395 (1999).
26. Wills, T. C., Baker, E. A., Nuhfer, A. J. & Zorn, T. G. Response of the benthic macroinvertebrate community in a northern Michigan
stream to reduced summer stream flows. River Res. Appl. 22(7), 819–836 (2006).
27. James, A. B. W., Dewson, Z. S. & Death, R. G. The influence of flow reduction on macroinvertebrate drift density and distance in
three New Zealand streams. J. N. Am. Benthol. Soc. 28, 220–232 (2009).
28. Richter, B. D., Baumgartner, J. V., Braun, D. P. & Powell, J. A spatial assessment of hydrologic alteration within a river network.
Regul. River 14(4), 329–340 (1998).
29. Shieh, C. L., Guh, Y. R. & Wang, S. Q. The application of range of variability approach to the assessment of a check dam on riverine
habitat alteration. Environ. Geol. 52, 427–435 (2007).
30. Yang, P., Yin, X.-A., Yang, Z.-F. & Tang, J. A revised range of variability approach considering the periodicity of hydrological
indicators. Hydrol. Process. 28, 6222–6235 (2014).
31. Yu, C., Yin, X. & Yang, Z. A revised range of variability approach for the comprehensive assessment of the alteration of flow regime.
Ecol. Eng. 96, 200–207 (2016).
32. Ge, J., Peng, W., Huang, W., Qu, X. & Singh, S. K. Quantitative assessment of flow regime alteration using a revised range of vari-
ability methods. Water 10, 597 (2018).
33. Timpe, K. & Kaplan, D. The changing hydrology of a dammed Amazon. Science Advances 3(11), e1700611 (2017).
34. Smakhtin, V. U. & Weragala, N. An assessment of hydrology and environmental flows in the Walawe river basin, Sri Lanka. Work-
ing Paper 103. International Water Management Institute (IWMI), Colombo, Sri Lanka (2005).
35. Mood, A. M., Graybill, F. A. & Boes, P. D. C. Introduction to the Theory of Statistics Vol. 3 (McGraw-Hill, New York, 2005).
36. Zhang, Q., Xu, C. Y., Chen, Y. D. & Yang, T. Spatial assessment of hydrologic alteration across the Pearl River Delta, China, and
possible underlying causes. Hydrol. Process. 23(11), 1565–1574 (2009).
37. Lee, A., Cho, S., Kang, D. K. & Kim, S. Analysis of the effect of climate change on the Nakdong river stream flow using indicators
of hydrological alteration. J. Hydro Environ. Res. 8(3), 234–247 (2014).
38. Stefanidis, K., Panagopoulos, Y., Psomas, A. & Mimikou, M. Assessment of the natural flow regime in a Mediterranean river
impacted from irrigated agriculture. Sci. Total Environ. 573, 1492–1502 (2016).
39. Assahira, C. et al. Tree mortality of a flood-adapted species in response of hydrographic changes caused by an Amazonian river
dam. Forest Ecol. Manag. 396, 113–123 (2017).
40. Ali, R., Kuriqi, A., Abubaker, S. & Kisi, O. Hydrologic alteration at the upper and middle part of the yangtze river, China: towards
sustainable water resource management under increasing water exploitation. Sustainability 11(19), 5176 (2019).
41. Carlisle, D. M., Falcone, J., Wolock, D. M., Meador, M. R. & Norris, R. H. Predicting the natural flow regime: models for assessing
hydrological alteration in streams. River Res. Appl. 26(2), 118–136 (2010).
42. Maynard, C. M. & Lane, S. N. Reservoir compensation releases: Impact on the macroinvertebrate community of the Derwent
River, Northumberland, UK—a longitudinal study. River Res. Appl. 28(6), 692–702 (2012).
43. Salmaso, F. et al. Benthic macroinvertebrates response to water management in a lowland river: effects of hydro-power vs irrigation
off-stream diversions. Environ. Monit. Assess. 190(1), 33 (2018).
44. Power, M. E., Sun, A., Parker, G., Dietrich, W. E. & Wootton, J. T. Hydraulic food-chain models. BioScience 45(3), 159–167 (1995).
45. Jayawardana, J. M. C. K., Gunawardana, W. D. T. M., Udayakumara, E. P. N. & Westbrooke, M. Land use impacts on river health
of Uma Oya, Sri Lanka: implications of spatial scales. Environ. Monit. Assess. 189(4), 192 (2017).
46. Weliange, W. S., Leichtfried, M., Amarasinghe, U. S. & Füreder, L. Longitudinal variation of benthic macroinvertebrate communi-
ties in two contrasting tropical streams in Sri Lanka. Int. Rev. Hydrobiol. 102(3–4), 70–82 (2017).
47. Benzie, J. A. The colonisation mechanisms of stream benthos in a tropical river (Menik Ganga: Sri Lanka). Hydrobiologia 111(3),
171–179 (1984).
48. Amarathunga, A. D. & Fernando, R. W. Suspended sediment concentration and its impact on aquatic invertebrates in the Gin
River, Sri Lanka. Journal of Food and Agriculture 9(1–2), 24–38 (2016).
49. Lancaster, J. & Downes, B. J. Aquatic entomology (OUP, Oxford, 2013).
50. Ramos, V., Formigo, N. & Maia, R. Environmental flows under the WFD implementation. Water Resour. Manag. 32(15), 5115–5149
(2018).
51. Rosero-López, D. et al. Streamlined eco-engineering approach helps define environmental flows for tropical Andean headwaters.
Freshwater Biol. 64(7), 1315–1325 (2019).
52. Warfe, D. M., Hardie, S. A., Uytendaal, A. R., Bobbi, C. J. & Barmuta, L. A. The ecology of rivers with contrasting flow regimes:
identifying indicators for setting environmental flows. Freshwater Biol. 59(10), 2064–2080 (2014).
53. Wu, M., Chen, A., Zhang, X. & McClain, M. E. A comment on Chinese policies to avoid negative impacts on river ecosystems by
hydropower projects. Water 12(3), 869 (2020).
54. Chandrapala, L. Long term trends of rainfall and temperature in Sri Lanka. In Climate Variability and Agriculture (eds Abrol, Y.
P. et al.) (Narosa Publishing House, New Delhi, 1996).
55. Halwatura, D. & Najim, M. M. M. Application of the HEC-HMS model for runoff simulation in a tropical catchment. Environ.
Modell. Softw. 46, 155–162 (2013).
Scientific Reports | (2021) 11:546 | https://doi.org/10.1038/s41598-020-79576-5 11
Vol.:(0123456789)www.nature.com/scientificreports/
56. USEPA (US ENVIRONMENTAL PROTECTION AGENCY). Field and laboratory methods for macroinvertebrate and habitat
assessment of low gradient, non-tidal streams. Mid-Atlantic Coastal Streams (MACS) Workgroup, Environmental Services Divi-
sion, Region 3, USEPA, Wheeling, West Virginia, USA (1997).
57. Turner, A. M. & Trexler, J. C. Sampling aquatic invertebrates from marshes: evaluating the options. J. N. Am. Benthol. Soc. 16(3),
694–709 (1997).
58. Mendis, A. S. & Fernando, C. H. A guide to the fresh water fauna of Ceylon (Sri Lanka) (Weerawardhena S. R. and Fernando C. H.,
eds), Gestetner, Sri Lanka, 42-126 pp. (1962).
59. Starmühlner, F. Result of the Australian: ceylonese hydrological mission, Part xvii: The freshwater Gastropods of Ceylon. Bull.
Fish. Res. St. Sri Lanka (Ceylon) 25(1), 97–181 (1974).
60. APHA. Standard Methods for Examinations of Water and Wastewater, 21st ed. APHA, AWWA and WEF DC, Washington (2005).
61. Clarke, K. R. & Warwick, R. M. Change in Marine Communities: An Approach to Statistical Analysis and Interpretation Vol. 2
(PRIMER-E Ltd, Plymouth, 2001).
62. Clarke, K. R. Non-parametric multivariate analysis of changes in community structure. Australian Journal of Ecology 18, 117–143
(1993).
63. Anderson, M. J., Gorley, R. N. & Clarke, K. R. PERMANOVA+ for PRIMER: Guide to Software and Statistical Methods PRIMER-E
(Plymouth, UK, 2008).
Author contributions
D.S.N.M., M.M.M.N. and M.M.M. conceptualized and designed the study, analyzed the data and drafted the
manuscript. S.Q. contributed to data interpretation, and manuscript writing and editing. All authors reviewed
and approved the manuscript.
Competing interests
The authors declare no competing interests.
Additional information
Correspondence and requests for materials should be addressed to M.M.M.N.
Reprints and permissions information is available at www.nature.com/reprints.
Publisher’s note Springer Nature remains neutral with regard to jurisdictional claims in published maps and
institutional affiliations.
Open Access This article is licensed under a Creative Commons Attribution 4.0 International
License, which permits use, sharing, adaptation, distribution and reproduction in any medium or
format, as long as you give appropriate credit to the original author(s) and the source, provide a link to the
Creative Commons licence, and indicate if changes were made. The images or other third party material in this
article are included in the article’s Creative Commons licence, unless indicated otherwise in a credit line to the
material. If material is not included in the article’s Creative Commons licence and your intended use is not
permitted by statutory regulation or exceeds the permitted use, you will need to obtain permission directly from
the copyright holder. To view a copy of this licence, visit http://creativecommons.org/licenses/by/4.0/.
© The Author(s) 2021
Scientific Reports | (2021) 11:546 | https://doi.org/10.1038/s41598-020-79576-5 12
Vol:.(1234567890)You can also read