Interplay between the human gut microbiome and host metabolism
←
→
Page content transcription
If your browser does not render page correctly, please read the page content below
bioRxiv preprint first posted online Feb. 27, 2019; doi: http://dx.doi.org/10.1101/561787. The copyright holder for this preprint
 (which was not peer-reviewed) is the author/funder, who has granted bioRxiv a license to display the preprint in perpetuity.
                              It is made available under a CC-BY-NC-ND 4.0 International license.

              Interplay between the human gut microbiome and host
                                   metabolism

               Alessia Visconti1,† , Caroline I. Le Roy1,† , Fabio Rosa1 , Niccolo Rossi1,2 , Tiphaine C.
             Martin1,3,4 , Robert P. Mohney5 , Weizhong Li6,7 , Emanuele de Rinaldis8 , Jordana T. Bell1 ,
                J. Craig Venter6,7 , Karen E. Nelson6,7 , Tim D. Spector1,+, *, and Mario Falchi1,+, *
                  1
                    Department of Twin Research & Genetic Epidemiology, King’s College London, London, UK
                      2
                     BioISI-Biosystems & Integrative Sciences Institute, University of Lisbon, Lisbon, Portugal
              3
                  Department of Oncological Sciences, Icahn School of Medicine at Mount Sinai, New York, USA
                  4
                    The Tisch Cancer Institute, Icahn School of Medicine at Mount Sinai, New York, NY, USA
                                             5
                                               Metabolon, Inc., Morrisville, NC, USA
                                          6
                                            Human Longevity, Inc., San Diego, CA, USA
                                 7
                                   Current address, J. Craig Venter Institute, La Jolla, CA, USA
                  8
                    Cluster of Precision Immunology, Sanofi, 640 Memorial Drive, Cambridge, MA, 02149, USA
                                               †
                                                 These authors contributed equally
                                             +
                                               These authors share senior authorship
                          * Corresponding authors: mario.falchi@kcl.ac.uk, tim.spector@kcl.ac.uk

                          Abstract. The human gut is inhabited by a complex and metabolically active mi-
                          crobial ecosystem regulating host health. While many studies have focused on the
                          effect of individual microbial taxa, the metabolic potential of the entire gut micro-
                          bial ecosystem has been largely under-explored. We characterised the gut microbiome
                          of 1,004 twins via whole shotgun metagenomic sequencing (average 39M reads per
                          sample). We observed greater similarity, across unrelated individuals, for functional
                          metabolic pathways (82%) than for taxonomic composition (43%). We conducted
                          a microbiota-wide association study linking both taxonomic information and mi-
                          crobial metabolic pathways with 673 blood and 713 faecal metabolites (Metabolon,
                          Inc.). Metabolic pathways associated with 34% of blood and 95% of faecal metabo-
                          lites, with over 18,000 significant associations, while species-level results identified
                          less than 3,000 associations, suggesting that coordinated action of multiple taxa is
                          required to affect the metabolome. Finally, we estimated that the microbiome me-
                          diated a crosstalk between 71% of faecal and 15% of blood metabolites, highlight-
                          ing six key species (unclassified Subdoligranulum spp., Faecalibacterium prausnitzii,
                          Roseburia inulinivorans, Methanobrevibacter smithii, Eubacterium rectale, and Akker-
                          mansia muciniphila). Because of the large inter-person variability in microbiome com-
                          position, our results underline the importance of studying gut microbial metabolic
                          pathways rather than focusing purely on taxonomy to find therapeutic and diagnostic
                          targets.

             Introduction
             The human gut is home to trillions of microbes that form a complex community referred
             to as the gut microbiota. The metabolic activity of the gut microbiota is essential in main-
             taining host homeostasis and health, as proven, for instance, by the study of germfree an-
             imals [1,2]. Although the presence of a microbiota is vital, variations in its composition
             induces metabolic shifts that may result in alterations of host phenotype [3]. The gut micro-
             biome is highly malleable and can be altered throughout lifespan mostly by environmental
bioRxiv preprint first posted online Feb. 27, 2019; doi: http://dx.doi.org/10.1101/561787. The copyright holder for this preprint
(which was not peer-reviewed) is the author/funder, who has granted bioRxiv a license to display the preprint in perpetuity.
It is made available under a CC-BY-NC-ND 4.0 International license.
factors, such as diet and medication [4,5,6]. Although the external environment plays an
important role in shaping the gut microbiome community, the host can affect the micro-
bial ecosystem through its immune system, and has also a metabolic impact on the gut
lumen [7,8,9].
The joint study of microbiome and metabolome has been suggested as the most promising
approach to evaluate host-microbiome interactions [10]. However, studying the metabolic
holobiont is complex, and few studies have tackled this issue in humans at any scale. Our
group previously used 16S amplicon data to confirm that the gut microbiome is exceptionally
metabolically active, and that the faecal metabolome may improve our estimation of the gut
microbiota impact on health [11]. However, it is not possible to fully capture the metabolic
activity of the gut microbiome using amplicon sequencing techniques alone, and the use of the
more comprehensive whole shotgun metagenomic sequencing (WMGS) is necessary. Indeed,
WMGS not only detects the taxonomic composition at higher resolution but also allows
inferring its function, thus allowing the study of the metabolic potential of the microbial
community. Here, we studied, in over a thousand twins, the effect of this metabolic activity
on hosts health. We assessed the impact of the gut microbiome on both the gut and host
systemic metabolism by using WMGS and untargeted faecal and blood metabolomics data.
We found multiple associations between the gut microbiome (taxonomic composition and
microbial metabolic function) and faecal and blood metabolites. In addition, we identified
a number of microbial species and metabolic functions likely to play a leading role in the
gut-systemic metabolic crosstalk.
Results
Gut microbiota composition is host-specific whereas its functions are shared
across subjects
Whole metagenomic shotgun sequencing (WMGS) was performed on faecal samples pro-
vided by 1,073 volunteers from the TwinsUK registry, of which 1,004 surpassed quality
control with an average of 39M high-quality microbial reads per sample (Methods, Sup-
plementary Table 1). Taxonomic profiling identified, in the kingdoms of archaea and
bacteria, 14 phyla, 24 classes, 37 orders, 74 families, 182 genera, and 580 species present in
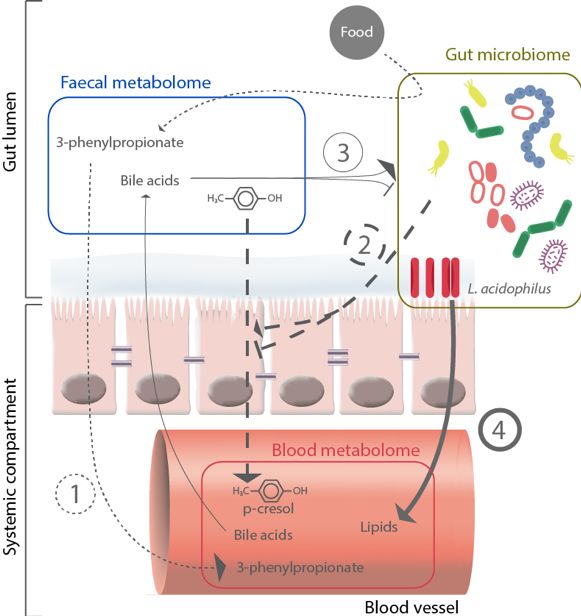
at least one sample (Methods). Each species was observed in a median of 2.7% of the sam-
ples, and 12% of species were sample-specific (Figure 1). The most ubiquitous species were
from the Subdoligranulum genera (unclassified species), Ruminococcus obeum, Ruminococ-
cus torques, and Faecalibacterium prausnitzii, all detected in more than 98% of the samples
(Supplementary Figure 1). Microbial metabolic profiling (as described by the MetaCyc
microbial metabolic pathways) identified 434 non-redundant pathways, which were detected
in most samples (Methods). Each pathway was observed in a median of 91.6% of the sam-
ples, with 12% of the pathways present in all samples and only 2% being sample-specific
(Figure 1).
Microbial metabolic pathways were widely shared between individuals, compared to their
taxonomical composition. Indeed, multiple known species (up to 465, and 29 on average)
identified from the WMGS data, plus a large number of unclassified species, contributed
to the abundance of each microbial metabolic pathway (Supplementary Data D1). As a
consequence, pathway prevalence within our sample strongly correlated with the number of
species in which it could be detected (Spearmans ρ = 0.34; P=9.4 × 10⁻⁹ ). When comparing
unrelated individuals, we observed that, on average, they shared 82% of the pathways butbioRxiv preprint first posted online Feb. 27, 2019; doi: http://dx.doi.org/10.1101/561787. The copyright holder for this preprint
(which was not peer-reviewed) is the author/funder, who has granted bioRxiv a license to display the preprint in perpetuity.
It is made available under a CC-BY-NC-ND 4.0 International license.
Fig. 1. The composition of the gut ecosystem is unique to an individual while its functionality is
maintained across the population. Pie charts representing the percentage of species (on the left)
and pathways (on the right) present in less than 1% of the population (dark blue), between 1%
and 25% (light blue), between 25% and 50% (turquoise), between 50% and 75% (brown), and more
than 75% (yellow).
only 43% of the species (paired Wilcoxon’s test P< 2 × 10⁻¹⁶ ; Supplementary Figure 2,
Methods).
Microbiome composition and functions are strongly linked to gut lumen
metabolism
Faecal metabolic profiles were available for 479 individuals with WMGS data. 713 annotated
metabolites were measured in more than 50 individuals and tested for association with the
gut microbiome at both taxonomic and functional levels (Methods, Figure 2). As ex-
pected, both the composition of the gut microbiome and its metabolic function were widely
associated with the gut lumen metabolic content. At a 5% false discovery rate (FDR) we
found 16,133 associations with microbial metabolic pathways and 2,493 associations with mi-
crobial species (Supplementary Data D2 and D3). In particular, 99.7% of the metabolic
pathways were significantly associated with 95% of the faecal metabolites, while 90% of the
species were associated with 82% of the faecal metabolites (Methods; Figure 2). On av-
erage, each metabolite level was associated with 4 species and 24 pathways. In addition,
145 (20%) metabolites were associated to a single species, while only 50 of them (7%)
were associated to a single pathway. Five microbial species played a major metabolic role
and were independently associated with 10% of the faecal metabolites (Supplementary
Figure 3): unclassified Subdoligranulum spp. (149 metabolites), Akkermansia muciniphila
(106 metabolites), Roseburia inulinivorans (105 metabolites), Methanobrevibacter smithii
(96 metabolites), and Roseburia intestinalis (92 metabolites). In contrast, the top-five mi-
crobial metabolic pathways were associated with more than 53% of the faecal metabolites,
with the pathways of L-rhamnose degradation I, Kdo transfer to lipid IVA III (Chlamydia),
CDP diacylglycerol biosynthesis I and II and NAD biosynthesis I from aspartate affecting
226, 218, 215, 215, and 206 faecal metabolites, respectively.bioRxiv preprint first posted online Feb. 27, 2019; doi: http://dx.doi.org/10.1101/561787. The copyright holder for this preprint
(which was not peer-reviewed) is the author/funder, who has granted bioRxiv a license to display the preprint in perpetuity.
It is made available under a CC-BY-NC-ND 4.0 International license.
Fig. 2. Study design and number of associations between the gut microbiome and the faecal and
blood metabolome. The top of the Figure reports the number of microbial species and metabolic
pathways which were detected in at least 50 individuals with metabolomics and WMGS data, and
that were used in the study, and the number of associations tested. The bottom of the Figure
reports the number of associations that were significant at a FDR 5%, along with the number and
percentage of metabolites, microbial species, and microbial metabolic pathways involved.
We calculated the enrichment of the associated metabolites for metabolic super-pathways
(as annotated by Metabolon, Inc.; Methods). Faecal metabolites associated with microbial
species were enriched for a decrease in amino acids (adj P=1.6 × 10⁻⁴ ) and an increase
in lipids (adj P=1.9 × 10⁻³ ), while metabolites associated with metabolic pathways were
enriched for a decrease in lipids (adj P=8.0 × 10⁻⁵ ), and an increase in both nucleotides
(adj P=0.02) and carbohydrates (adj P=0.03).
B vitamins were strongly associated with both species and metabolic pathways, with
riboflavin (vitamin B2), nicotinate (vitamin B3), pantothenate (vitamin B5), pyridoxine
(vitamin B6), biotin (vitamin B7) associated with 9 to 27 species and with 48 to 155 micro-
bial pathways (Supplementary Data D2 and D3). Finally, 16 associations were observed
between vitamin E (alpha, beta, gamma and delta tocopherol) and species/pathways.
Microbiome composition and functions associate with host systemic
metabolites
Blood metabolomics profiling was available for 859 individuals with WMGS data. 673 an-
notated metabolites (including 369 metabolites also measured in faeces) were measured in
more than 50 individuals, and used in this study. At a 5% FDR, we identified 2,030 as-
sociations with microbial metabolic pathways and 254 associations with microbial species
(Figure 2; Supplementary Data D4 and D5). In particular, 86% and 34% of the mi-
crobial metabolic pathways and species, respectively, associated with 33% and 24% of the
studied blood metabolites, respectively, with a total of 309 unique blood metabolites (46%)
associated with the microbiome. The species showing the largest number of associations
with blood metabolites were Lactobacillus acidophilus (N=30), and Lactobacillus fermentum
(N=14; Supplementary Figure 4). The metabolite sebacate showed the highest number
of associated species (N=11), followed by tartronate (N=9), phenylacetylglutamine (N=8),bioRxiv preprint first posted online Feb. 27, 2019; doi: http://dx.doi.org/10.1101/561787. The copyright holder for this preprint
(which was not peer-reviewed) is the author/funder, who has granted bioRxiv a license to display the preprint in perpetuity.
It is made available under a CC-BY-NC-ND 4.0 International license.
and p-cresol sulfate (N=6). On average, each blood metabolite was associated with two
species (with 118 species controlling a single metabolite) and 10 metabolic pathways (with
93 pathways controlling a single metabolite). The three microbial metabolic pathways show-
ing the largest number of associations with blood metabolites were the super pathways of
L-phenylalanine and L-alanine biosynthesis, and the pathway of urate biosynthesis/inosine
5’-phosphate degradation (30, 26, and 24, respectively). Four blood metabolites were asso-
ciated with more than 100 microbial metabolic pathways: phenylacetylglutamine (N=143)
and p-cresol-glucuronide (N=102), two known gut microbial-derived metabolites, as well as
tyramine O-sulfate (N=130), that can be synthesized by a Eubacterium enzyme [12], and
1,5-anhydroglucitol (N=129), that is present in a wide variety of food products.
Microbial metabolic pathways have a broader metabolic footprint than species
Overall, we identified about seven times more associations between faecal and blood metabo-
lites and microbial metabolic pathways than microbial species. We observed that pathways
found in a larger number of species have a stronger impact on the metabolome, with a
significant positive correlation between the number of species contributing to each pathway
and the number of associations between the pathway and both faecal and blood metabolites
(Spearmans ρ=0.27, P=2 × 10⁻⁶ , and ρ=0.33, P=1 × 10⁻⁹ , respectively).
Our results confirmed a wide network of associations between the gut microbiome and
the gut lumen metabolism, which extends to the systemic metabolome. At a 5% FDR,
we identified 360 microbial metabolic pathways associating with 679 faecal and 222 blood
metabolites, and 233 microbial species associating with 582 faecal and 160 blood metabo-
lites. Most microbial metabolic pathways (85%) associating with one or more metabolites in
the gut lumen also associated with one or more metabolites in blood (Supplementary Ta-
ble 2). In contrast, the majority of microbial species only associated with faecal metabolites
alone (58%, Supplementary Table 2). Still, 31% of species showed association with both
faecal and blood metabolites, suggesting important effects on host systemic metabolism
for this subset. Specifically, 4,861 pairs of faecal-blood metabolites co-associated with the
same species and 108,565 pairs with the same metabolic pathway. Among these associa-
tions, 152 pairs involved exactly the same named metabolite in both faeces and blood (145
with metabolic pathways, and only seven with species; Table 1, Supplementary Data
D6), while 113,274 pairs involved a different metabolite in faeces and blood (unique pairs
N=27,608). Sebacate, threonate, and p-cresol sulfate, in both faeces and blood, showed the
largest number of associations with pathways and with species in both faeces and blood.
The microbiome is involved in the crosstalk between the gut lumen and host
systemic metabolism
We further investigated the full set of faecal-blood co-associating pairs of metabolites to
better understand whether the observed associations were randomly coincident at the same
species or pathway, or if they were suggesting interplay between the gut and systemic en-
vironments. We assessed, through simulations, the probability that the microbiota was in-
volved in the crosstalk between faecal and blood metabolites (Methods). We hypothesised
that, if the species (or metabolic pathway) was involved in the crosstalk between faecal and
blood metabolites, these were expected to more strongly correlate in individuals for which
the species (or metabolic pathway) was present than in the remaining samples. We assessed
this probability through simulations (Methods). Significantly higher correlations betweenbioRxiv preprint first posted online Feb. 27, 2019; doi: http://dx.doi.org/10.1101/561787. The copyright holder for this preprint
(which was not peer-reviewed) is the author/funder, who has granted bioRxiv a license to display the preprint in perpetuity.
It is made available under a CC-BY-NC-ND 4.0 International license.
Table 1. Association between species and the same named metabolite in faeces and blood. For
each association, we report the number of observations (N), effect size (β), standard error (SE),
and P value (P).
Faeces Blood
Species Metabolite N β SE P N β SE P
−4
Akkermansia muciniphila p-cresol sulfate 443 -0.35 0.11 7.74 × 10 829 0.47 0.10 6.36 × 10⁻⁶
Bacteroidales bacterium ph8 sebacate 406 0.68 0.18 1.65 × 10⁻⁴ 718 -0.50 0.09 4.33 × 10⁻⁹
Eubacterium rectale p-cresol sulfate 444 0.45 0.11 2.84 × 10⁻⁵ 823 -0.45 0.11 2.09 × 10⁻⁵
Methanobrevibacter smithii threonate 287 -0.65 0.14 3.31 × 10⁻⁶ 527 1.01 0.16 4.09 × 10⁻¹⁰
Oscillibacter spp. 3-phenylpropionate 418 -0.54 0.11 1.95 × 10⁻⁶ 799 -0.55 0.10 1.02 × 10⁻⁷
Roseburia inulinivorans p-cresol sulfate 433 0.43 0.10 1.09 × 10⁻⁵ 802 -0.53 0.10 1.45 × 10⁻⁷
Subdoligranulum spp. p-cresol sulfate 461 -0.32 0.10 9.86 × 10⁻⁴ 854 0.62 0.10 1.75 × 10⁻⁹
co-associated faecal-blood metabolite pairs when species (or metabolic pathway) was de-
tected (PEmpirical = 1 × 10⁻³ for species, and PEmpirical = 0.03 for pathways), suggesting
extensive crosstalk between the gut and the systemic environments.
We further tested the presence of a faecal-blood crosstalk by applying the P-gain statistic
to the co-associating faecal-blood metabolite pairs [13]. The P-gain statistic compares the
increase in strength of association with the species (or pathway) when using the metabolite
ratios compared to the smaller of the two p-values when using the two metabolite concen-
trations individually. A strong reduction in p-value indicates that two metabolites may be
linked by a mechanism that involves the gut microbiota. To carefully assess a significance
threshold for the P-gain statistics in our dataset, we estimated its empirical null distri-
bution through simulations. We obtained a P-gain threshold of 73 for species and of 42
for metabolic pathways at an experimental-wide α-level of 0.05 (Methods). P-gains pass-
ing these thresholds are reported in Supplementary Data D7 and D8, and included
31% of the P-gains with species (1,325/4,232 co-associated metabolite pairs) and 19% with
microbial metabolic pathways (16,839/88,452 co-associated metabolite pairs). The P-gain
statistics suggested potential crosstalk between 36% of the faecal metabolites and 5% of
the blood metabolites, involving 12% of the species (N=29). Crosstalk was wider with the
microbial metabolic pathways, involving 70% of the faecal and 14% of blood metabolites,
and 67% of the pathways (N=247).
At the species level, unclassified Subdoligranulum spp. accounted for 49% of the putative
crosstalk, and F. prausnitzii, R. inulinivorans, M. smithii, E. rectale, and A. muciniphila
together contributed to a further 36%. In contrast, the results at the pathway level were
not dominated by a limited number of pathways, with the top six contributing only towards
24% of the observed crosstalk.
Methanogens-host metabolic crosstalk is associated with adiposity
Threonate in blood showed the highest P-gains and a large number of significant faecal-
blood interactions (with 61 faecal metabolites, including threonate levels in faeces). All
interactions involved M. smithii, the main archeon in the human gut [14], present in 62%
of our metagenomic samples. Threonate is produced from vitamin C under oxidative con-
ditions [15]. In both blood and faeces, threonate was also associated with two microbial
pathways linked to methanogenesis: coenzyme factor 420 biosynthesis (β=0.94, SE=0.18,
P=2.2 × 10⁻⁷ ) and methanogenesis from H2 and CO2 (β=0.93, SE=0.18, P=3.3 × 10⁻⁷ ), to
which M. smithii contributes, in our sample, for about 47% (the remaining attributable tobioRxiv preprint first posted online Feb. 27, 2019; doi: http://dx.doi.org/10.1101/561787. The copyright holder for this preprint
(which was not peer-reviewed) is the author/funder, who has granted bioRxiv a license to display the preprint in perpetuity.
It is made available under a CC-BY-NC-ND 4.0 International license.
Methanosphaera stadtmanae, < 1%, and to unclassified species, 53%; Methods). The role
of M. Smithii, and of other methanogenic microbes in human health is still unclear, how-
ever, several studies suggested that its depletion is linked to obesity[16,17]. We found it to
be significantly negatively associated with the percentage of visceral fat (β=-0.09, SE=0.04,
P=0.013; Supplementary Table 3). We also observed a significant negative association
(P¡0.05/3=0.017, Supplementary Table 3) between blood threonate and three measures
of adiposity, namely BMI (β=-0.48, SE=0.12, P=1.2 × 10⁻⁵ ), and the percentage of total
body (β=-0.41, SE=0.10, P=4.3×10⁻⁵ ) and visceral fat (β=-0.48, SE=0.11, P=2.6×10⁻⁵ ),
while faecal threonate was not associated with any measure of adiposity (P¿0.05). Moreover,
31 out of 61 faecal metabolites whose crosstalk with blood threonate via M. Smithii was
confirmed by the P-gain statistic were significantly associated with measures of adiposity
(N=49, P< 0.05/(61 × 3) = 1.3 × 10⁻³ ; Supplementary Data D9).
Discussion
Microbiome studies are mainly focused on the effect of individual microbial taxa on human
health, while the metabolic potential of microbes has been largely overlooked. In line with
recent observations [18], we confirmed that the microbiome metabolic potential (as described
by the MetaCyc microbial metabolic pathways) is more conserved across unrelated subjects
than species (82 vs 43%). We also observed that microbial metabolic pathways are highly
redundant, with up to 465 identified species (and a possibly large number of unknown ones)
sharing the same metabolic pathway.
Using 713 faecal and 673 blood metabolites measured by Metabolon, Inc. and WGMS
data, we conducted a microbiota-wide association study. Our results showed that the gut
metagenome (both at the species and at the metabolic pathway level) widely associates with
both the gut and host systemic metabolism. The associations with faecal metabolites suggest
that most microbial species (90%) and metabolic pathways (99.7%) interact with their
surrounding metabolic environment. In particular, metabolic pathways were significantly
associated with 95% of the faecal metabolites, while microbial species were associated with
82% of the faecal metabolites. The results for species were comparable to those previously
reported in a recent study on the TwinsUK cohort leveraging 16S amplicon data [11]. In
both studies, we observed that over 90% of microbes were associated with a vast proportion
of the measured gut metabolites (>80%). However, the WMGS data used in this study
improved the precision of the taxonomic results, allowing identification of associations at
the species level. For instance, we were able to identify five species interacting with at least
10% of the studied faecal metabolites. Four of them (Subdoligranulum spp., A. muciniphila,
R. inulinivorans, and R. intestinalis) were present in at least 80% of the population and are
already known for their ability to affect gut lumen metabolism [19,20,21,22]. Interestingly,
among the numerous microbiome-metabolome associations identified in this study, a large
proportion was involved with the metabolism of vitamins. For instance, we observed over 700
associations with vitamin B-related metabolites. While B vitamins are mostly provided to
the host through diet, these can also be synthesised by lactic acid bacteria [23]. Our results
show a similar number of positive and negative associations with vitamin B metabolites,
suggesting that the microbiome is not only involved in the biosynthesis of vitamins B but
also in its degradation. In this study, we also evaluated the impact of the gut microbiome
on the host systemic metabolism. We showed that nearly half of the blood metabolites
(N=309, 46%) were associated with microbial species and/or metabolic pathways. More
exactly, 34% of the species and 86% of the pathways were associated with 24% and 33% ofbioRxiv preprint first posted online Feb. 27, 2019; doi: http://dx.doi.org/10.1101/561787. The copyright holder for this preprint
(which was not peer-reviewed) is the author/funder, who has granted bioRxiv a license to display the preprint in perpetuity.
It is made available under a CC-BY-NC-ND 4.0 International license.
the metabolites, respectively. Two bacteria stood out as playing a major role: L. acidophilus
(5%) and L. fermentum (2%), both known for their probiotic properties [24,25,26].
Notably, a previous study on the TwinsUK cohort observed that 72% of blood metabo-
lites were under host genetic influence [27]. Interestingly, 144 out of 309 microbiome-associated
blood metabolites (47%) identified in our study were not heritable. Heritabilities for the
remaining 165 blood metabolites ranged from 10% to 78%, with a mean value of 47%
(Supplementary Data D10). This suggests that, despite the widespread host genetic ef-
fects on blood metabolites, the gut microbiome might play a role on the systemic metabolism
that is independent from the host genome.
Altogether, our results indicate an intense interplay between the gut microbiome and
its host. While only a small number of metabolites were found to be associated to a same
species (or pathway) in both metabolic environments (N=152), we detected more than
27,000 unique pairs of faecal-blood metabolites which were associated with the same mi-
crobial species and/or metabolic pathway (co-associated metabolites). The limited size of
our study sample makes it unsuitable to test causality using a Mendelian randomisation
method [28]. Nonetheless, using two complementary approaches, we showed that, first, co-
associated metabolites are more strongly correlated in the presence of the associated species
or metabolic pathways (PEmpirical = 1 × 10⁻³ and 0.03, respectively), and, second, that
a significant crosstalk, as assessed through the P-gain statistic, exists between 71% of the
faecal and the 15% of blood metabolites, involving 12% of the species and 67% of the path-
ways. We suggest that four potential mechanisms could underlie the interplay between these
two metabolomic environments (Figure 3). First, these interactions could be triggered by
the metabolic activity of the microbiome [29]. Second, the gut microbiome could mediate
metabolite transfer through the gut barrier by affecting its integrity, as suggested, for exam-
ple, by the associations involving the same named species and metabolites in both blood and
faeces (Table 1). Indeed, these associations showed opposite direction of effects, suggesting
that microbes may modulate the absorption of the metabolites by the host rather than its
bioavailability. Third, microbial growth could be impacted by secretion of metabolites by
the host within the gut lumen as extensively discussed regarding bile acids [30,31]. Fourth,
host-gut microbiome interactions could also be triggered by non-metabolic interactions in-
cluding microbial secretion of peptides or direct cell-cell interactions [32], which could not
be investigated in the present study.
We observed about seven times more associations between metabolites and microbial
metabolic pathways than species. This trend was even stronger when studying the faecal-
blood crosstalk, with nearly 13 times more co-associated metabolite pairs identified by means
of the P-gain statistics for microbial metabolic pathways than species. These results support
the claim that looking at functions rather than taxonomy alone gives a better appreciation
of the true gut microbiome metabolic activity [10]. We suggest that the large number of
associations with metabolic pathways could be mostly due to the fact that they are usually
conserved among different species. Furthermore, the majority of the metabolic pathways
are associated with metabolites apparently unrelated to their functions. Therefore, associa-
tions with a metabolic pathway could be interpreted also as associations with a particular
microbial sub-community rather than only to its specific function.
This study has some limitations. First, we used data from a cohort including only in-
dividuals of European ancestry and composed predominantly of middle-aged woman (96%,
average age 65 years old). Therefore, our results may not generalise to diverse populations.
Ideally, data collected in other larger cohorts and meta-analyses would be necessary to con-
firm our novel findings. Second, despite the large-scale sample, this is a cross-sectional study,bioRxiv preprint first posted online Feb. 27, 2019; doi: http://dx.doi.org/10.1101/561787. The copyright holder for this preprint
(which was not peer-reviewed) is the author/funder, who has granted bioRxiv a license to display the preprint in perpetuity.
It is made available under a CC-BY-NC-ND 4.0 International license.
Fig. 3. Summary of the possible mechanisms of host-microbiome metabolic crosstalk. The Figure
highlights the possible four mechanisms implicated in the interactions between the gut microbiome,
the faecal metabolome, and the blood metabolome. (1) Small dashed lines: metabolites are produced
by the bacteria and then absorbed, resulting in associations between the microbiome and both
the blood and faecal metabolites. (2) Large dashed lines: the microbiome affects the gut barrier
integrity, resulting in alteration of metabolites absorption (i.e., the same metabolite is associated
with a bacterium/pathway in both blood and faeces, but the directions of effects are opposite). (3)
Light continuous line: metabolites produced by the host, such as bile acids, affect microbial growth.
(4) Bold continuous line: direct bacteria to host cell interactions that results in host systemic
modulation (i.e., bacteria are associated with blood metabolites but not with faecal metabolites).
and no causal relationship between the microbiome and the metabolome can be inferred
from the identified associations. Third, while WMGS data allow us to infer the functional
capability of the microbial community, it does not provide information on which micro-
bial metabolic pathways are actually active. Metatranscriptomic data will help in bridging
this gap, also allowing discerning between associations with microbial metabolic pathways
that are connected to their specific function or that are simply a proxy for microbial sub-
communities.
In conclusion, we first confirmed the key role played by the microbiome on the gut
lumen and host systemic metabolism. Next, we described the microbiome effect on the
interplay between the two metabolic compartments. We observed that only a few key species,
but many common microbial functions, are substantially associated with faecal and bloodbioRxiv preprint first posted online Feb. 27, 2019; doi: http://dx.doi.org/10.1101/561787. The copyright holder for this preprint
(which was not peer-reviewed) is the author/funder, who has granted bioRxiv a license to display the preprint in perpetuity.
It is made available under a CC-BY-NC-ND 4.0 International license.
metabolic profiles. Therefore, microbial metabolic pathways should be considered beyond
their primary function and interpreted as proxies for microbial communities, interacting
with their surrounding environment. Future treatments designed to improve host health
through the modulation of the gut microbiome should optimally target functionally-related
microbial communities rather than single organisms.
Methods
DNA extraction, library preparation, and metagenomic sequencing
A 3-mL volume of lysis buffer (20 mM Tris-HCl pH 8.0, 2 mM Sodium EDTA 1.2% Triton
X-100) was added to 0.5 g of stool sample, and the sample vortexed until homogenized.
A 1.2 mL volume of homogenized sample and 15 mL of Proteinase K (Sigma Aldrich,
PN.P2308) enzyme was aliquoted to a 1.5 mL tube with garnet beads (Mo Bio PN. 12830-
50-BT). Bead tubes were then incubated at 65◦ C for 10 min and then 95◦ C for 15 min.
Tubes were then placed in a Vortex Genie 2 to perform bead beating for 15 min and the
sample subsequently spun in an Eppendorf Centrifuge 5424. 800 uL of supernatant was then
transferred to a deep well block and DNA extracted and purified using a Chemagic MSM
I (Perkin Elmer) following the manufacturers protocol. Zymo Onestep Inhibitor Removal
kit was then performed following manufacturers instructions (Zymo Research PN. D6035).
DNA samples were then quantified using Quant-iT on an Eppendorf AF2200 plate reader.
Nextera XT libraries were prepared manually following the manufacturers protocol (Il-
lumina, PN. 15031942). Briefly, samples were normalized to 0.2 ng/ml DNA material per
library using a Quant-iT picogreen assay system (Life Technologies, PN. Q33120) on an
AF2200 plate reader (Eppendorf), then fragmented and tagged via tagmentation. Amplifi-
cation was performed by Veriti 96 well PCR (Applied Biosystems) followed by AMPure XP
bead cleanup (Beckman Coulter, PN. A63880). Fragment size for all libraries were measured
using a Labchip GX Touch HiSens. Sequencing was performed on an Illumina HiSeq 2500
using SBS kit V4 Chemistry, with a read length of 2x125 bp. Sequencing yielded an average
number of paired-end reads of 26.73M.
Taxonomic profiling, and functional annotation
Paired-end reads were processed using the YAMP pipeline [33]. Briefly, we first removed
identical reads, potentially generated by PCR amplification [34]. Next, reads were filtered
to remove adapters, known artefacts, phix174, and then quality trimmed (PhRED quality
score < 10). Reads that became too short after trimming (N < 60 bp) were discarded. We
retained singleton reads (i.e., reads whose mate has been discarded) in order to retain as
much information as possible. Contaminant reads belonging to the host genome were re-
moved (build: GRCh37). Low quality samples, i.e., samples with less than 15M reads after
QC were discarded (N=4). Next, MetaPhlAn2 [35] (v. 2.6.0) and the HUMAnN2 pipeline[18]
(v 0.10.0), both included into the YAMP pipeline, were used to characterise the microbial
community composition and its functional capabilities, respectively. Functional capabili-
ties of the microbial community were described by the MetaCyc metabolic pathways, and
assessed using the UniRef90 proteomic database annotations. HUMAnN2 was also used to
evaluate the percentage of species contributing to the abundance of each microbial metabolic
pathway.bioRxiv preprint first posted online Feb. 27, 2019; doi: http://dx.doi.org/10.1101/561787. The copyright holder for this preprint
(which was not peer-reviewed) is the author/funder, who has granted bioRxiv a license to display the preprint in perpetuity.
It is made available under a CC-BY-NC-ND 4.0 International license.
A principal component analysis evaluated using the taxonomic profiling was used to
identify and discard ecologically abnormal samples (N=37). If sample scores were greater
than 3 times the standard deviation on one of the first 10 principal components the sample
was labelled as outlier and discarded. Finally, we removed individuals not of European
ancestry (N=9, self-reported via questionnaire) resulting in 1,004 samples with an average
number of reads of 39M (39 males, 965 female), all living in the UK at the time of specimen
collection (Supplementary Table 1). The dataset included 161 monozygotic twin pairs
(N=322), 201 dizygotic twin pairs (N=402), and 280 singletons.
Taxonomic and microbial metabolic pathways relative abundances were arcsine square-
root transformed, filtered for outliers using the Grubbs outlier test (significance threshold
P=0.05), and standardised to have zero mean and unit variance [36]. Under the assumption
that a zero relative abundance meant impossibility to detect the taxum/pathway rather
than its absence, zero values were considered as not available (NA).
Metabolomics profiling
Metabolite concentrations were measured from fecal samples and blood by Metabolon, Inc.,
Morrisville, North Carolina, USA, by using an untargeted LC/MS/MS platform as pre-
viously described [11,27]. A total of 1,116 metabolites were measured in the 480 faecal
samples, including 850 of known chemical identity used in this study. In blood, a total of
902 metabolites were measured in 859 individuals, 687 of which had known chemical identi-
ties. Metabolites were scaled by run-day medians, and log-transformed. Faecal metabolites
were further scaled to have mean zero and standard deviation one. Metabolites that were
indicated as below detection level (zero) were considered as not available (NA).
Within-unrelated individuals species and microbial metabolic pathways
similarity
For all individuals in our datasets, we codified the absence/presence of a microbial species/
metabolic pathways with 0 and 1, respectively. Then, after having identified all possible pairs
of unrelated individuals (N=1,006,288), we evaluated their similarity as the ratio between
the number of species/pathways which were present in both members of the pair and the
number of species/metabolic pathways which were present in at least one of the members
of the pair. The similarity distributions were then compared using a paired Wilcoxon’s test.
Metagenome-wide association study
Associations of faecal and blood metabolites with species and microbial metabolic pathways
transformed relative abundances were carried out using PopPAnTe [37], which uses a vari-
ance component framework and the matrix of the expected kinship between each pair of
individuals to model the resemblance among family members. Sex and age at the sample col-
lection were included as covariates. Only pairs of metabolites-species/pathways with at least
50 observations were tested for association. The significance of the associations was evalu-
ated by comparing the likelihood of a full model, including the species/metabolic pathways
in the fixed effect, and the likelihood of a null model where these effects were constrained
to zero. Associations passing a false discovery rate (FDR) threshold of 5% were considered
significant. FDR was evaluated using Storeys method [38].bioRxiv preprint first posted online Feb. 27, 2019; doi: http://dx.doi.org/10.1101/561787. The copyright holder for this preprint
(which was not peer-reviewed) is the author/funder, who has granted bioRxiv a license to display the preprint in perpetuity.
It is made available under a CC-BY-NC-ND 4.0 International license.
Enrichment analysis
Enrichment analysis was performed using the super-pathways annotation provided by Meta-
bolon, Inc., as described elsewhere [11]. Metabolites were grouped in the following eight
super-pathways: amino acid, carbohydrate, cofactors and vitamins, energy, lipid, nucleotide,
peptide, and xenobiotics. Enrichment P values were evaluated using the parametric anal-
ysis of gene set enrichment (PAGE) algorithm [39] using 10,000 random permutations as
implemented in the piano R package [40] (v 1.20). The PAGE algorithm, being based on a
two-tailed Z score, can evaluate whether each super-pathway is significantly enriched for an
increase or a decrease of the amount of metabolites which it includes.
Gut-host metabolic crosstalk
We selected all pairs of metabolites that were observed in at least 100 individuals and were
associated with the same species/metabolic pathway in both environments (co-associated
metabolites) and used two approaches to detect and validate the presence of an interplay be-
tween the gut and the systemic host metabolism. First, we hypothesised that, if a species (or
pathway) is involved in the crosstalk between faecal and blood metabolites, these metabo-
lites would be expected to be more strongly correlated in the presence of the species (or
pathway) than in its absence. We used the missingness observed in our WMGS data to test
this hypothesis. Indeed, while we are not able to measure it, we can confidently assume
that a variable proportion of missing data in our dataset are likely to include truly missing
species (or pathways). We tested this hypothesis through simulations. We selected all pairs
of co-associated metabolites interacting with species (or pathways) with at least 30 missing
observations, and built 1,000 random datasets which included 1,000 pairs of metabolites
matched by correlation and sample size to the original set of co-associated metabolites.
These new pairs were then combined with species (or pathways) having the same missing-
ness pattern of the actual associated species (or pathways). Then, we used these simulated
datasets to assess the probability of observing increased correlation between metabolites
when the species (or pathway) was present in the co-associated metabolites compared to
the matched pairs. Second, we evaluated, for each pair of co-associated metabolites, its P-
gain statistic, which allows determining whether the ratio between the two metabolites is
more informative than the single metabolites alone, therefore suggesting the presence of a re-
lationship between them [13]. To this aim, first, we evaluated all the log ratios between each
pair of co-associated metabolites. Then, we associated the obtained ratios with the specific
species/pathway by fitting a linear mixed effect model in R (package lme4, version 1.1.18),
including age and sex as fixed effects, and family structure as a random effect. Finally, we
evaluated the P-gain statistic as the ratio between the minimum P value obtained using the
single metabolites alone and the P value obtained using their ratio [13]. It has previously
suggested that a critical P-gain threshold taking into account multiple test correction, under
the assumption of a type I error rate of 0.05, would be 10 times the number of tests [13].
However, it has also been observed that the magnitude of the P-gain statistic can be re-
duced by the increasing correlation between the metabolites and their ratio, and increased
by an increasing sample size [13], two parameters which varied greatly in our dataset. We,
therefore, estimated a null distribution empirically using a conservative assumption of no
interplay between metabolites associated with different species or pathways. Therefore, we
build a null distribution of P-gain statistics using 100,000 pairs of randomly selected metabo-
lites which were associated at 5% FDR with two different species (or pathways) but werebioRxiv preprint first posted online Feb. 27, 2019; doi: http://dx.doi.org/10.1101/561787. The copyright holder for this preprint
(which was not peer-reviewed) is the author/funder, who has granted bioRxiv a license to display the preprint in perpetuity.
It is made available under a CC-BY-NC-ND 4.0 International license.
matched one-to-one by correlation and sample size to the co-associated metabolite pairs.
We used the top 5% P-gain value as the critical P-gain threshold.
Adiposity phenotypes data and association study
Subjects were asked to remove their shoes, and height (in cm) was measured using a sta-
diometer. Weight (in kg) was measured on digital scales. Total and visceral fat mass percent-
age was determined in 1,141 individuals with metagenomic and/or metabolomic data avail-
able by DXA (Dual-Energy X-ray Absorptiometry; Hologic QDR; Hologic, Inc., Waltham,
MA, USA) whole-body scanning by a trained research nurse, as described elsewhere [41].
The QDR System Software Version 12.6 (Hologic, Inc., Waltham, MA, USA) was used to
analyse the scans. Measurements greater than 3 standard deviations from the dataset mean
were excluded from the analysis. To ensure the normality of their distribution, the data
were rank-based inverse normalized. Associations with M. Smithii, blood and faecal thre-
onate, and 61 faecal metabolites whose crosstalk with blood threonate via M. smithii was
confirmed by the P-gain statistic, were carried out by fitting a linear mixed effect model in
R (package lme4, version 1.1.18), including age and sex as fixed effects, and family structure
as a random effect.
Competing interests
The following authors are or were employees of Human Longevity, Inc.: W.L., J.C.V., K.E.N.
R.P.M is a current employee of Metabolome, Inc. E.d.R is a current employee of Sanofi.
T.D.S. is a consultant for Zoe Global Ltd. The other authors declare that they have no
conflict of interest.
Acknowledgments
TwinsUK was funded by the Wellcome Trust and MRC. The study also receives support from
the National Institute for Health Research (NIHR)- funded BioResource, Clinical Research
Facility and Biomedical Research Centre based at Guys and St Thomas NHS Foundation
Trust in partnership with Kings College London. We gratefully acknowledge support pro-
vided by the JPI HDHL funded DINAMIC consortium (administered by the MRC UK,
MR/N030125/1).
References
1. S. P. Claus, T. M. Tsang, Y. Wang, O. Cloarec, E. Skordi, F.-P. Martin, S. Rezzi, A. Ross,
S. Kochhar, E. Holmes, and J. K. Nicholson, “Systemic multicompartmental effects of the gut
microbiome on mouse metabolic phenotypes,” Molecular Systems Biology, vol. 4, Oct. 2008.
2. W. R. Wikoff, A. T. Anfora, J. Liu, P. G. Schultz, S. A. Lesley, E. C. Peters, and G. Siuzdak,
“Metabolomics analysis reveals large effects of gut microflora on mammalian blood metabo-
lites,” Proceedings of the National Academy of Sciences, vol. 106, pp. 3698–3703, Mar. 2009.
3. P. J. Turnbaugh, R. E. Ley, M. A. Mahowald, V. Magrini, E. R. Mardis, and J. I. Gordon,
“An obesity-associated gut microbiome with increased capacity for energy harvest,” Nature,
vol. 444, pp. 1027–1031, Dec. 2006.
4. J. Goodrich, J. Waters, A. Poole, J. Sutter, O. Koren, R. Blekhman, M. Beaumont,
W. VanTreuren, R. Knight, J. Bell, T. Spector, A. Clark, and R. Ley, “Human Genetics Shape
the Gut Microbiome,” Cell, vol. 159, pp. 789–799, Nov. 2014.bioRxiv preprint first posted online Feb. 27, 2019; doi: http://dx.doi.org/10.1101/561787. The copyright holder for this preprint
(which was not peer-reviewed) is the author/funder, who has granted bioRxiv a license to display the preprint in perpetuity.
It is made available under a CC-BY-NC-ND 4.0 International license.
5. J. Goodrich, E. Davenport, M. Beaumont, M. Jackson, R. Knight, C. Ober, T. Spector, J. Bell,
A. Clark, and R. Ley, “Genetic Determinants of the Gut Microbiome in UK Twins,” Cell Host
& Microbe, vol. 19, pp. 731–743, May 2016.
6. H. Xie, R. Guo, H. Zhong, Q. Feng, Z. Lan, B. Qin, K. J. Ward, M. A. Jackson, Y. Xia, X. Chen,
B. Chen, H. Xia, C. Xu, F. Li, X. Xu, J. Y. Al-Aama, H. Yang, J. Wang, K. Kristiansen,
J. Wang, C. J. Steves, J. T. Bell, J. Li, T. D. Spector, and H. Jia, “Shotgun Metagenomics of
250 Adult Twins Reveals Genetic and Environmental Impacts on the Gut Microbiome,” Cell
Systems, vol. 3, pp. 572–584.e3, Dec. 2016.
7. J. K. Nicholson, E. Holmes, J. Kinross, R. Burcelin, G. Gibson, W. Jia, and S. Pettersson,
“Host-Gut Microbiota Metabolic Interactions,” Science, vol. 336, pp. 1262–1267, June 2012.
8. L. V. Hooper, D. R. Littman, and A. J. Macpherson, “Interactions Between the Microbiota
and the Immune System,” Science, vol. 336, pp. 1268–1273, June 2012.
9. A. M. Valdes, J. Walter, E. Segal, and T. D. Spector, “Role of the gut microbiota in nutrition
and health,” BMJ, p. k2179, June 2018.
10. P. J. Turnbaugh and J. I. Gordon, “An Invitation to the Marriage of Metagenomics and
Metabolomics,” Cell, vol. 134, pp. 708–713, Sept. 2008.
11. J. Zierer, M. A. Jackson, G. Kastenmller, M. Mangino, T. Long, A. Telenti, R. P. Mohney,
K. S. Small, J. T. Bell, C. J. Steves, A. M. Valdes, T. D. Spector, and C. Menni, “The fecal
metabolome as a functional readout of the gut microbiome,” Nature Genetics, vol. 50, pp. 790–
795, June 2018.
12. K. Kobashi, Y. Fukaya, D. H. Kim, T. Akao, and S. Takebe, “A novel type of aryl sulfotrans-
ferase obtained from an anaerobic bacterium of human intestine,” Archives of Biochemistry
and Biophysics, vol. 245, pp. 537–539, Mar. 1986.
13. A.-K. Petersen, J. Krumsiek, B. Wgele, F. J. Theis, H.-E. Wichmann, C. Gieger, and K. Suhre,
“On the hypothesis-free testing of metabolite ratios in genome-wide and metabolome-wide
association studies,” BMC Bioinformatics, vol. 13, no. 1, p. 120, 2012.
14. E. E. Hansen, C. A. Lozupone, F. E. Rey, M. Wu, J. L. Guruge, A. Narra, J. Goodfellow, J. R.
Zaneveld, D. T. McDonald, J. A. Goodrich, A. C. Heath, R. Knight, and J. I. Gordon, “Pan-
genome of the dominant human gut-associated archaeon, Methanobrevibacter smithii, studied
in twins,” Proceedings of the National Academy of Sciences, vol. 108, pp. 4599–4606, Mar. 2011.
15. G. L. Simpson and B. J. Ortwerth, “The non-oxidative degradation of ascorbic acid at physio-
logical conditions,” Biochimica Et Biophysica Acta, vol. 1501, pp. 12–24, Apr. 2000.
16. M. Million, M. Maraninchi, M. Henry, F. Armougom, H. Richet, P. Carrieri, R. Valero, D. Rac-
cah, B. Vialettes, and D. Raoult, “Obesity-associated gut microbiota is enriched in Lacto-
bacillus reuteri and depleted in Bifidobacterium animalis and Methanobrevibacter smithii,”
International Journal of Obesity, vol. 36, pp. 817–825, June 2012.
17. A. Schwiertz, D. Taras, K. Schfer, S. Beijer, N. A. Bos, C. Donus, and P. D. Hardt, “Microbiota
and SCFA in Lean and Overweight Healthy Subjects,” Obesity, vol. 18, pp. 190–195, Jan. 2010.
18. E. A. Franzosa, L. J. McIver, G. Rahnavard, L. R. Thompson, M. Schirmer, G. Weingart, K. S.
Lipson, R. Knight, J. G. Caporaso, N. Segata, and C. Huttenhower, “Species-level functional
profiling of metagenomes and metatranscriptomes,” Nature Methods, vol. 15, pp. 962–968, Nov.
2018.
19. M. Derrien, “Akkermansia muciniphila gen. nov., sp. nov., a human intestinal mucin-degrading
bacterium,” INTERNATIONAL JOURNAL OF SYSTEMATIC AND EVOLUTIONARY MI-
CROBIOLOGY, vol. 54, pp. 1469–1476, Sept. 2004.
20. S. H. Duncan, A. Barcenilla, C. S. Stewart, S. E. Pryde, and H. J. Flint, “Acetate Utilization
and Butyryl Coenzyme A (CoA):Acetate-CoA Transferase in Butyrate-Producing Bacteria from
the Human Large Intestine,” Applied and Environmental Microbiology, vol. 68, pp. 5186–5190,
Oct. 2002.
21. B. S. Samuel and J. I. Gordon, “A humanized gnotobiotic mouse model of host-archaeal-
bacterial mutualism,” Proceedings of the National Academy of Sciences, vol. 103, pp. 10011–
10016, June 2006.bioRxiv preprint first posted online Feb. 27, 2019; doi: http://dx.doi.org/10.1101/561787. The copyright holder for this preprint
(which was not peer-reviewed) is the author/funder, who has granted bioRxiv a license to display the preprint in perpetuity.
It is made available under a CC-BY-NC-ND 4.0 International license.
22. B. S. Samuel, E. E. Hansen, J. K. Manchester, P. M. Coutinho, B. Henrissat, R. Fulton,
P. Latreille, K. Kim, R. K. Wilson, and J. I. Gordon, “Genomic and metabolic adaptations
of Methanobrevibacter smithii to the human gut,” Proceedings of the National Academy of
Sciences, vol. 104, pp. 10643–10648, June 2007.
23. J. G. LeBlanc, C. Milani, G. S. de Giori, F. Sesma, D. van Sinderen, and M. Ventura, “Bac-
teria as vitamin suppliers to their host: a gut microbiota perspective,” Current Opinion in
Biotechnology, vol. 24, pp. 160–168, Apr. 2013.
24. K. Kailasapathy and J. Chin, “Survival and therapeutic potential of probiotic organisms with
reference to Lactobacillus acidophilus and Bifidobacterium spp.,” Immunology and Cell Biology,
vol. 78, pp. 80–88, Feb. 2000.
25. Y. Bao, Y. Zhang, Y. Zhang, Y. Liu, S. Wang, X. Dong, Y. Wang, and H. Zhang, “Screening
of potential probiotic properties of Lactobacillus fermentum isolated from traditional dairy
products,” Food Control, vol. 21, pp. 695–701, May 2010.
26. J. Maldonado, F. Caabate, L. Sempere, F. Vela, A. R. Snchez, E. Narbona, E. Lpez-Huertas,
A. Geerlings, A. D. Valero, M. Olivares, and F. Lara-Villoslada, “Human Milk Probiotic Lacto-
bacillus fermentum CECT5716 Reduces the Incidence of Gastrointestinal and Upper Respira-
tory Tract Infections in Infants:,” Journal of Pediatric Gastroenterology and Nutrition, vol. 54,
pp. 55–61, Jan. 2012.
27. T. Long, M. Hicks, H.-C. Yu, W. H. Biggs, E. F. Kirkness, C. Menni, J. Zierer, K. S. Small,
M. Mangino, H. Messier, S. Brewerton, Y. Turpaz, B. A. Perkins, A. M. Evans, L. A. D. Miller,
L. Guo, C. T. Caskey, N. J. Schork, C. Garner, T. D. Spector, J. C. Venter, and A. Telenti,
“Whole-genome sequencing identifies common-to-rare variants associated with human blood
metabolites,” Nature Genetics, vol. 49, pp. 568–578, Apr. 2017.
28. G. Davey Smith and S. Ebrahim, “Mendelian randomization: can genetic epidemiology con-
tribute to understanding environmental determinants of disease?*,” International Journal of
Epidemiology, vol. 32, pp. 1–22, Feb. 2003.
29. B. K. I. Meijers and P. Evenepoel, “The gut-kidney axis: indoxyl sulfate, p-cresyl sulfate and
CKD progression,” Nephrology Dialysis Transplantation, vol. 26, pp. 759–761, Mar. 2011.
30. J. R. Swann, E. J. Want, F. M. Geier, K. Spagou, I. D. Wilson, J. E. Sidaway, J. K. Nicholson,
and E. Holmes, “Systemic gut microbial modulation of bile acid metabolism in host tissue
compartments,” Proceedings of the National Academy of Sciences, vol. 108, pp. 4523–4530,
Mar. 2011.
31. J. M. Ridlon, D. J. Kang, P. B. Hylemon, and J. S. Bajaj, “Bile acids and the gut microbiome:,”
Current Opinion in Gastroenterology, vol. 30, pp. 332–338, May 2014.
32. J. M. Wells, O. Rossi, M. Meijerink, and P. van Baarlen, “Epithelial crosstalk at the microbiota-
mucosal interface,” Proceedings of the National Academy of Sciences, vol. 108, pp. 4607–4614,
Mar. 2011.
33. A. Visconti, T. C. Martin, and M. Falchi, “YAMP: a containerized workflow enabling repro-
ducibility in metagenomics research,” GigaScience, vol. 7, July 2018.
34. M. B. Jones, S. K. Highlander, E. L. Anderson, W. Li, M. Dayrit, N. Klitgord, M. M. Fa-
bani, V. Seguritan, J. Green, D. T. Pride, S. Yooseph, W. Biggs, K. E. Nelson, and J. C.
Venter, “Library preparation methodology can influence genomic and functional predictions
in human microbiome research,” Proceedings of the National Academy of Sciences, vol. 112,
no. 45, pp. 14024–14029, 2015.
35. D. T. Truong, E. A. Franzosa, T. L. Tickle, M. Scholz, G. Weingart, E. Pasolli, A. Tett,
C. Huttenhower, and N. Segata, “MetaPhlAn2 for enhanced metagenomic taxonomic profiling,”
Nature Methods, vol. 12, p. 902, Sept. 2015.
36. J. Lloyd-Price, A. Mahurkar, G. Rahnavard, J. Crabtree, J. Orvis, A. B. Hall, A. Brady, H. H.
Creasy, C. McCracken, M. G. Giglio, D. McDonald, E. A. Franzosa, R. Knight, O. White,
and C. Huttenhower, “Strains, functions and dynamics in the expanded Human Microbiome
Project,” Nature, Sept. 2017.
37. A. Visconti, M. Al-Shafai, W. A. Al Muftah, S. B. Zaghlool, M. Mangino, K. Suhre, and
M. Falchi, “PopPAnTe: population and pedigree association testing for quantitative data,”
BMC Genomics, vol. 18, Dec. 2017.bioRxiv preprint first posted online Feb. 27, 2019; doi: http://dx.doi.org/10.1101/561787. The copyright holder for this preprint
(which was not peer-reviewed) is the author/funder, who has granted bioRxiv a license to display the preprint in perpetuity.
It is made available under a CC-BY-NC-ND 4.0 International license.
38. J. D. Storey, “A direct approach to false discovery rates,” Journal of the Royal Statistical
Society: Series B (Statistical Methodology), vol. 64, pp. 479–498, Aug. 2002.
39. S.-Y. Kim and D. J. Volsky, “PAGE: parametric analysis of gene set enrichment,” BMC bioin-
formatics, vol. 6, p. 144, June 2005.
40. L. Vremo, J. Nielsen, and I. Nookaew, “Enriching the gene set analysis of genome-wide data
by incorporating directionality of gene expression and combining statistical hypotheses and
methods,” Nucleic Acids Research, vol. 41, pp. 4378–4391, Apr. 2013.
41. A. Moayyeri, C. J. Hammond, D. J. Hart, and T. D. Spector, “Effects of age on genetic influence
on bone loss over 17 years in women: The Healthy Ageing Twin Study (HATS),” Journal of
Bone and Mineral Research, vol. 27, pp. 2170–2178, Oct. 2012.You can also read