Coupling of cerebral blood flow and oxygen consumption during hypothermia in newborn piglets as measured by time-resolved near-infrared ...
←
→
Page content transcription
If your browser does not render page correctly, please read the page content below
Coupling of cerebral blood flow and
                oxygen consumption during
                hypothermia in newborn piglets as
                measured by time-resolved near-
                infrared spectroscopy: a pilot study

                Mohammad Fazel Bakhsheshi
                Mamadou Diop
                Laura B. Morrison
                Keith St. Lawrence
                Ting-Yim Lee

Downloaded From: https://www.spiedigitallibrary.org/journals/Neurophotonics on 26 Dec 2021
Terms of Use: https://www.spiedigitallibrary.org/terms-of-use
Neurophotonics 2(3), 035006 (Jul–Sep 2015)
Coupling of cerebral blood flow and oxygen
consumption during hypothermia in newborn
piglets as measured by time-resolved near-infrared
spectroscopy: a pilot study
Mohammad Fazel Bakhsheshi,a,b,* Mamadou Diop,a,c Laura B. Morrison,a Keith St. Lawrence,a,b,c and
Ting-Yim Leea,b,c,d
a
Lawson Health Research Institute, Imaging Program, 268 Grosvenor Street, London, Ontario N6A 4V2, Canada
b
Robarts Research Institute, Imaging Research Laboratories, 1151 Richmond Street North, London, Ontario N6A 5B7, Canada
c
Western University, Department of Medical Biophysics, London, Ontario N6A 5C1, Canada
d
Western University, Department of Medical Imaging, London, Ontario N6A 5W9, Canada
Abstract. Hypothermia (HT) is a potent neuroprotective therapy that is now widely used in following neurological
emergencies, such as neonatal asphyxia. An important mechanism of HT-induced neuroprotection is attributed
to the associated reduction in the cerebral metabolic rate of oxygen (CMRO2 ). Since cerebral circulation and
metabolism are tightly regulated, reduction in CMRO2 typically results in decreased cerebral blood flow (CBF); it
is only under oxidative stress, e.g., hypoxia-ischemia, that oxygen extraction fraction (OEF) deviates from its
basal value, which can lead to cerebral dysfunction. As such, it is critical to measure these key physiological
parameters during therapeutic HT. This report investigates a noninvasive method of measuring the coupling of
CMRO2 and CBF under HT and different anesthetic combinations of propofol/nitrous-oxide (N2 O) that may be
used in clinical practice. Both CBF and CMRO2 decreased with decreasing temperature, but the OEF remained
unchanged, which indicates a tight coupling of flow and metabolism under different anesthetics and over the mild
HT temperature range (38°C to 33°C). © 2015 Society of Photo-Optical Instrumentation Engineers (SPIE) [DOI: 10.1117/1.NPh.2.3
.035006]
Keywords: brain temperature; indocyanine green; time-resolved near-infrared; cerebral blood flow; cerebral metabolic rate of oxygen;
oxygen extraction.
Paper 15028PR received May 27, 2015; accepted for publication Aug. 18, 2015; published online Sep. 21, 2015.
1 Introduction prolonged periods of cooling and rewarming phases since thera-
Mild hypothermia (HT), in which the brain temperature is low- peutic HT can last up to 72 h.9,10 By contrast, optical methods
ered to 32°C to 33°C, has been shown to be an effective neuro- are well suited for this since they are safe, compact, portable,
protective therapy to reduce brain injury following cardiac and can provide continuous monitoring at the bedside. We have
arrest, traumatic brain injury, birth asphyxia, and ischemic previously developed a dynamic contrast-enhanced near-infra-
encephalopathy.1 An important mechanism of HT-induced neu- red spectroscopy (NIRS) technique for measuring absolute
roprotection is the preservation of brain adenosine triphosphate CBF and CMRO2 using the light-absorbing dye, indocyanine
levels resulting from a reduction in the cerebral metabolic rate of green (ICG), as an intravascular contrast agent in newborn
oxygen (CMRO2 ).2 Indeed, the effects of HT on cerebral blood piglets11–15 and adult porcine model.16–18 However, there has
flow (CBF) are a consequence of the tight coupling between been no previous study investigating the feasibility of using
CMRO2 and CBF.3,4 Preservation of this coupling is an impor- time-resolved (TR) NIRS to measure CBF and CMRO2 during
tant factor in the control of the cerebral circulation and metabo- HT.
lism, connecting the change in metabolic demands with the Although the results from a recent study have shown that
supply of substrates by blood flow. As a consequence of this neonates with hypoxic-ischemic encephalopathy have lower
balance between flow and metabolism, the oxygen extraction blood flow index and relative CMRO2 during cooling when
fraction (OEF) represents a sensitive marker of brain health;5 compared to healthy neonates,19 the effect of HT on flow-
under oxidative stress, e.g., hypoxia-ischemia (HI), OEF metabolism coupling under different anesthetic regimes on
increases from its basal value of ∼33% leading to cerebral the noninjured brain has not been studied to our knowledge.
venous desaturation.6–8 In the present study, CBF and CMRO2 were measured by
Current methods of measuring cerebral energy metabolism TR-NIRS in healthy newborn piglets under isoflurane for induc-
using positron emission tomography and magnetic resonance tion of anesthesia and then both measurements were repeated
spectroscopy are not practical for neuromonitoring during under propofol/nitrous oxide (N2 O) while the brain temperature
was lowered from ∼38°C to 33°C.
*Address all correspondence to: Mohammad Fazel Bakhsheshi, E-mail:
mfazelba@alumni.uwo.ca 2329-423X/2015/$25.00 © 2015 SPIE
Neurophotonics 035006-1 Jul–Sep 2015 • Vol. 2(3)
Downloaded From: https://www.spiedigitallibrary.org/journals/Neurophotonics on 26 Dec 2021
Terms of Use: https://www.spiedigitallibrary.org/terms-of-useBakhsheshi et al.: Coupling of cerebral blood flow and oxygen consumption. . .
2 Materials and Methods 2.2 Optical Properties Measurement
2.1 Instrumentation To quantify tissue optical properties from the measured TPSFs,
the instrument response function (IRF) was measured to account
The light sources of the time-resolved system were thermoelec- for the temporal dispersion in the system.22 IRFs were measured
trically cooled picosecond pulsed diode lasers (LDH-P-C at the start and end of each experiment at the same count rate as
emitting at 760, 810, and 830 nm, PicoQuant, Germany) acti- the TPSFs (800 kHz). Figure 1 shows a typical IRF of the TR
vated by a computer-controlled laser driver (SEPIA PDL 828, instrument (FWHM ¼ 390 ps) and a TPSF measured on a pig-
PicoQuant). The 760- and 830-nm emission wavelengths were let’s head at a source-detector distance of 20 mm. Both TPSFs
chosen to quantify tissue oxyhemoglobin (HbO2 ) and deoxyhe- and IRF were acquired at 800 kHz at a sampling interval of
moglobin (Hb) concentrations, which were used to determine 400 ms. The tissue optical properties were obtained using an
the cerebral oxygen saturation, whereas the 810-nm laser coin- analytical model of light diffusion.23 The model solution was
cides with the peak absorption wavelength of ICG in plasma. first convolved with the measured IRF, and a nonlinear optimi-
The output power and pulse repetition rates of the lasers zation routine (based on the MATLAB® function fminsearch)
were set to 1.4 mW and ∼27 MHz, respectively. The individual was used to fit the convolved model to each measured TPSF to
pulses of the lasers were temporally separated by sharing the 80- determine the absorption coefficient (μa ), reduced scattering
MHz clock of the laser driver among the three lasers. Light emit- coefficient (μs0 ), and a scaling factor, which accounts for varia-
ted by each diode laser was attenuated by two adjustable neutral tions in laser power, detection gain, and coupling efficiency.22
density filters (NDC-50-4M, Thorlabs, Newton, New Jersey) The fitting range was set to 80% prior to the peak of the TPSF, as
and coupled by a microscope objective lens (NA ¼ 0.25, diffusion modeling is known to be a poor model for early
magnification ¼ 10×) into one arm of a trifurcated fiber bundle photons24,25 and 20% after the peak to minimize the effects of
(three step-index multimode fibers, NA ¼ 0.22, core 400 μm; noise. Tissue optical properties at each temperature were deter-
Fiber Optics Technology, Pomfret, Connecticut). The distal mined by averaging 32 TPSFs collected over 320 s. For the
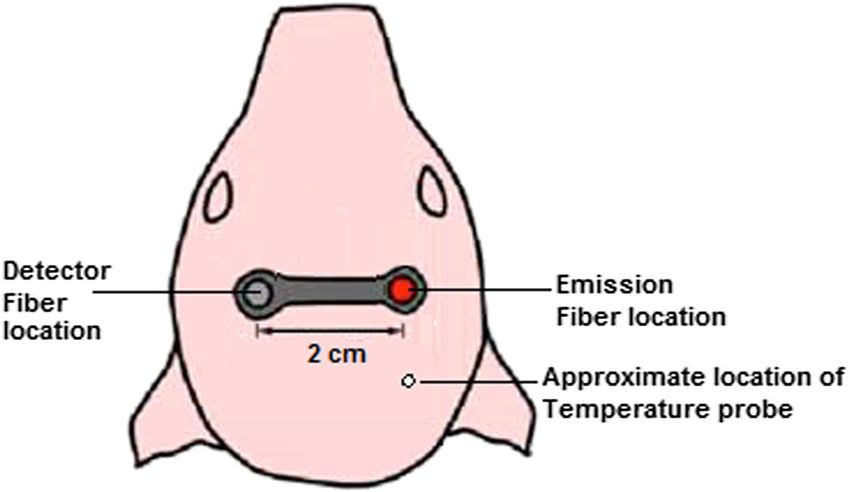
common end of the bundle (emission probe) was placed on hemodynamics measurements, changes in light absorption
the scalp of the animal and held in position by a probe holder. caused by ICG were characterized using only μa as a fitting
The average power delivered to a subject was attenuated to parameter, with μs0 and the scaling factor was fixed to their base-
∼20 μW∕laser, which is below ANSI safety limits for skin line values. Finally, the measured change in the absorption coef-
exposure.20 ficient was used to compute the ICG concentration, as discussed
Photons emerging from the scalp were collected by another in the following section.
fiber bundle (multimode step-index fibers, NA ¼ 0.55, 3.6 mm
diameter active area; Fiber Optics Technology, Pomfret,
Connecticut). The other end of the fiber bundle was secured in 2.3 Determination of Cerebral Blood Flow
front of an electromechanical shutter (SM05, Thorlabs). Light CBF was quantified using a bolus-tracking method that requires
transmitted through the shutter was collected by a Peltier cooled an intravenous bolus injection of ICG (1 ml, 0.2 mg∕kg) into
microchannel plate photomultiplier tube (PMC-100, Becker and a peripheral vein, followed by continuous measurement of
Hickl, Germany). Detection of single photons generated electri- the time-varying concentration of the dye in arterial blood and
cal pulses (amplitude of 50 to 200 mV, width ¼ 1.5 ns) that brain tissue. The arterial concentration, Ca ðtÞ, was measured
were transmitted to a time-correlated single-photon counting noninvasively by a dye densitometer (model DDG-2001 A/K,
(TCSPC) module (SPC-134, Becker and Hickl) to generate Nihon Kohden, Tokyo, Japan) with the probe attached to a
the temporal point spread function (TPSF). The TCSPC module front foot of the animal. Brain tissue concentration of ICG,
had a dead time of 100 ns, and because of that, the maximum Ctis ðtÞ, was determined from the measured changes in μa
count rate per laser was constrained to ∼800 kHz (i.e., one pho- acquired continuously for 76 s at a sampling interval of
ton detected every 1.25 μs) to minimize dead-time effects. This 400 ms:12
count rate, which was ∼3% of the laser pulse repetition rate, also
minimized pileup effects.21 Ctis ðtÞ ¼ ½μa ðtÞ − μa ð0Þ∕½lnð10Þ × εICG ;
EQ-TARGET;temp:intralink-;e001;326;268 (1)
Fig. 1 (a) Typical instrument response function of the time-resolved (TR) instrument with a FWHM of
390 ps and (b) a temporal point spread function acquired at the same wavelength on the piglet head at a
source-detector distance of 20 mm.
Neurophotonics 035006-2 Jul–Sep 2015 • Vol. 2(3)
Downloaded From: https://www.spiedigitallibrary.org/journals/Neurophotonics on 26 Dec 2021
Terms of Use: https://www.spiedigitallibrary.org/terms-of-useBakhsheshi et al.: Coupling of cerebral blood flow and oxygen consumption. . .
where μa ð0Þ represents the baseline absorption coefficient deter- continuous measurements of Sa O2 , whereas Sv O2 was deter-
mined over a 10-s period prior to ICG injection and εICG is the mined indirectly from the TR-NIRS measurements of the cer-
extinction coefficient of ICG at 802 nm (186 OD∕mM∕cm).26 ebral blood oxygen saturation, Stis O2 . This technique relies
The brain (tissue) and arterial concentrations of ICG are related on the assumption that there exists a stable arterial-venous
by the following equation: blood ratio in the CBV:30,31
Ctis ðtÞ ¼ Ca ðtÞ ½CBF · RðtÞ;
EQ-TARGET;temp:intralink-;e002;63;679 (2) Stis O2 ¼ αSa O2 þ ð1 − αÞSv O2 ;
EQ-TARGET;temp:intralink-;e005;326;679 (5)
where * represents the convolution operator and CBF · RðtÞ is where α represents the fraction of arterial blood in CBV. The
the flow-scaled impulse residue function, i.e., RðtÞ scaled by relative distribution of arterial and venous compartments is gen-
CBF. The function CBF · RðtÞ was extracted from the arterial erally accepted to be ∼25% and 75% of the total CBV; therefore,
and tissue ICG concentration curves [i.e., Eq. (2)] using a decon- α was set to 0.25.30,31 To obtain tissue cerebral blood oxygen
volution algorithm.27 The initial height of the derived function saturation, i.e., Stis O2 , cerebral hemoglobin (HbO2 , Hb) concen-
is CBF, since by definition Rð0Þ ¼ 1.28 Figure 2 shows typical trations were calculated from the TR-NIRS measurements.
brain and arterial ICG concentration curves measured with the These hemoglobin concentrations were determined by fitting
TR-NIRS technique and a pulse dye densitometer under isoflur- the tissue absorption coefficients to the extinction coefficients
ane at 38°C. The peak arterial concentration is ∼20 to 30 times of Hb and HbO2 , assuming a stable concentration of 85%
greater than that of tissue concentration since the cerebral blood water in the brain.32 A least-square optimization algorithm
volume (CBV) is about 3% to 5% of the total brain volume.
(MATLAB function fminsearch) was used to extract the concen-
trations of oxy- and deoxyhemoglobin from the absorption coef-
2.4 Determination of Cerebral Oxygen Metabolism ficients measured at the three wavelengths. Stis O2 was then
and Extraction Fraction calculated as follows:
CMRO2 was calculated using Fick’s principle:11 HbO2
Stis O2 ¼ : (6)
HbO2 þ Hb
EQ-TARGET;temp:intralink-;e006;326;494
CMRO2 ¼ CBFð½O2 a − ½O2 v Þ:
EQ-TARGET;temp:intralink-;e003;63;475 (3)
Using this relationship, a new expression for CMRO2 can be
The difference between the arterial oxygen concentration,
derived that is independent of Sv O2 :
½O2 a , and the cerebral venous concentration of oxygen, ½O2 v ,
is commonly referred to as the arteriovenous oxygen difference
Sa O2 − Stis O2
and is the difference between the O2 concentration of the arterial CMRO2 ¼ CBF 1.39 ½tHb : (7)
1−α
EQ-TARGET;temp:intralink-;e007;326;429
blood feeding the tissue of interest and O2 concentration of the
venous blood draining the tissue. Equation (3) can be further
expanded as follows:29 The fraction of oxygen extracted from arterial blood into the
brain, OEF, was also calculated using the method described
CMRO2 ¼ CBF 1.39 ½tHb ðSa O2 − Sv O2 Þ;
EQ-TARGET;temp:intralink-;e004;63;367 (4) by Brown et al.:11
where [tHb] is total hemoglobin concentration, which can be CMRO2
OEF ¼ : (8)
measured from blood samples. Sa O2 and Sv O2 are arterial CBF½O2 a
EQ-TARGET;temp:intralink-;e008;326;351
and venous O2 saturation, respectively. The constant 1.39 is
the O2 carrying capacity of hemoglobin measured in milliliters The tight coupling of CBF and CMRO2 in the normal brain
per gram of Hb. Note that the dye densitometer also provides leads to a stable level of OEF around ∼33%.33 A decoupling
Fig. 2 Samples (a) tissue ICG concentration curve measured with the TR near-infrared spectroscopy
(NIRS) technique and (b) arterial ICG concentration curve obtained with the pulse dye densitometer from
indocyanine green (ICG) bolus injection under isoflurane at brain temperature of 38°C. Both tissue and
arterial curves were measured simultaneously over a period of 50 s during injection of 1.0 ml of ICG
solution at a concentration of 0.1 mg∕ml.
Neurophotonics 035006-3 Jul–Sep 2015 • Vol. 2(3)
Downloaded From: https://www.spiedigitallibrary.org/journals/Neurophotonics on 26 Dec 2021
Terms of Use: https://www.spiedigitallibrary.org/terms-of-useBakhsheshi et al.: Coupling of cerebral blood flow and oxygen consumption. . .
of the two signifies oxidative stress and can lead to an increase in After the stabilization period, CBF and CMRO2 were first
OEF beyond the normal value.7 measured under isoflurane (1% to 2%) and then under intra-
venous infusion of propofol (9 to 22.4 mg∕kg∕h) and ventila-
tion with 70% nitrous oxide (N2 O70% ) and 30% oxygen (O2 30% )
2.5 Animal Preparation and Experimental Procedure while brain temperature was lowered from normothermia (38°C)
to HT (35° and 33°C). For propofol (10 mg∕ml) infusion, the
Experiments were conducted on five newborn piglets. All rate was adjusted according to the animal’s response to pain
animal experiments were approved by the Animal Use stimuli and change in vital signs such as blood pressure and
Subcommittee of the Canadian Council on Animal Care at our HR with a mean infusion rate of 2.51 1.15 ml∕h. For normo-
institution. Newborn Duroc cross piglets were obtained from a thermia, a heated water blanket was used to maintain rectal and
local supplier on the morning of the experiment. Anesthesia was brain temperature between 38°C to 38.5°C. HT was induced by
induced with 1% to 2% isoflurane, which was increased to 3% placing plastic ice bags on the surface of the piglet’s body. Each
to 4% during preparatory surgery. A tracheotomy was per- experiment was completed within 5 h and after the last meas-
formed and the piglet was ventilated with oxygen and medical urement, the animal was euthanized with intravenous potassium
air mixture. A femoral artery was catheterized to monitor heart chloride (1 to 2 ml∕kg, 2 mEq∕ml) infusion. The time-limiting
rate (HR) and mean arterial blood pressure (MAP) and to inter- factor of the proposed CBF method is the necessity for ICG to
mittently collect arterial blood samples for gas (pa CO2 , pa O2 ), be cleared from the blood stream by the liver. Since that takes
pH, and glucose concentration analysis. A cannula was about 10 to 15 min, CBF measurement can only be acquired
inserted into an ear vein for infusion of propofol (AstraZeneca every 15 min. Figure 4 illustrates the experimental workflow;
Pharmaceuticals, Inc., Canada) and ICG injection (Sigma- tissue oxygen saturation (Stis ) and CBF were acquired in two
Aldrich, Saint Louis, Missouri). After surgery, piglets were blocks during each condition. All data sets for each condition
maintained on 1% to 2% isoflurane at normothermia (NT38°C ). were acquired within ∼15 min.
Arterial CO2 tension (pa CO2 ) was monitored throughout the
experiment, either directly by blood gas measurements or by
2.6 Statistical Analysis
the end-tidal CO2 tension, and maintained at normocapnia
between 37 and 40 mmHg by adjusting the breathing rate and SPSS 17.0.0 (SPSS, Inc, Chicago, Illinois) was used for all stat-
ventilation volume. Arterial oxygen tension (pa O2 ) was main- istical analyses. Wilcoxon test was used to determine statistical
tained at a level between 90 and 130 mmHg by adjusting the differences between measurements acquired under normother-
ratio of oxygen to medical air. Blood glucose was monitored mia (38°C) when the anesthetic was switched from isoflurane
intermittently and if it fell below 4.5 mmol∕l, then a 1 to to propofol∕N2 O. Comparisons between temperature-based
2 ml infusion of 25% dextrose solution was administered intra- measurements were performed using the Friedman test.
venously. Brain temperature was also measured with a thermo- Statistical significance was based on p-valueBakhsheshi et al.: Coupling of cerebral blood flow and oxygen consumption. . .
Fig. 4 Experimental workflow: the solid boxes are distinctive steps, whereas the dotted box is recurring
for each induced condition.
Table 1 Physiological parameters measured at different brain temperatures. S a O2 , oxygen saturation of arterial blood; p a O2 , partial pressure of
oxygen in arterial blood; MAP, mean arterial pressure; HR, heart rate; tHb, total hemoglobin concentration in arterial blood; p a CO2 , partial pressure
of carbon dioxide in arterial blood; ½O2 a , arterial concentration of oxygen; S tis O2 , tissue cerebral blood oxygen saturation;
Baseline (isoflurane) Cooling (propofol-N2 O)
Variable (38°C) (38°C) (35°C) (33°C)
Baseline/Cooling
MAP (mmHg) (Isoflurane/propofol-N2 O) 42 4 56 6* 52 2* 50 11*
HR (bpm) (Isoflurane/propofol-N2 O) 148 5 226 41* 195 8* 138 28
p a CO2 (mmHg) (Isoflurane/propofol-N2 O) 40 2 41 2 41 1 40 2
p a O2 (mmHg) (Isoflurane/propofol-N2 O) 155 40 210 49 136 4* 85 16*
pH (Isoflurane/propofol-N2 O) 7.4 0.1 7.4 0.1 7.3 0.1 7.3 0.1
tHb (μmol∕l) (Isoflurane/propofol-N2 O) 8.1 0.3 8.3 0.8 8.5 1.1 8.4 1.2
S a O2 (%) (Isoflurane/propofol-N2 O) 100 97 2 98 1 97 1
½O2 a (ml∕dl) (Isoflurane/propofol-N2 O) 11 1 11 2 11 2 11 1
S tis O2 (%) (Isoflurane/propofol-N2 O) 0.69 0.01 0.69 0.01 0.69 0.01 0.69 0.01
*
A statistically significant (p < 0.05) difference compared to the baseline.
Fig. 5 (a) Cerebral blood flow (CBF) and oxygen metabolic rate (CMRO2 ); and (b) oxygen extraction
fraction (OEF) at each brain temperature under isoflurane or propofol∕N2 O anesthesia (N ¼ 5).
Values are shown as mean SD; *p < 0.05 versus at 38°C with isoflurane (baseline).
Neurophotonics 035006-5 Jul–Sep 2015 • Vol. 2(3)
Downloaded From: https://www.spiedigitallibrary.org/journals/Neurophotonics on 26 Dec 2021
Terms of Use: https://www.spiedigitallibrary.org/terms-of-useBakhsheshi et al.: Coupling of cerebral blood flow and oxygen consumption. . .
demand and preserve neuronal function and cellular integrity.5
If CPP continues to fall, CBF will progressively decline until the
increase in OEF is no longer sufficient to supply the necessary
oxygen to meet metabolic demand; energy failure will result and
permanent tissue damage follows. Therefore, increased OEF
from its basal value may be a sensitive and specific marker
of oxidative stress that can lead to cerebral dysfunction.
The vasodilating effects of isoflurane have limited its use as a
sedative agent in the neurosurgical intensive care unit (NICU)
because of the fear of a potential increase in intracranial pressure
(ICP) caused by the increase in CBF.42 By contrast, propofol is
being used more frequently in the NICU, particularly for head-
injury cases.43 Propofol is known to decrease CBF while pre-
Fig. 6 Plot of CBF and CMRO2 during cooling under different anes- serving brain flow-metabolism coupling and acts as a global
thetic conditions. Each symbol type represents data for each anes- central nervous system depressant.42 It has been shown that a
thetic group. The lines indicate the line of regression associated typical anesthetic induction dose of propofol reduces blood
with each group. pressure by ∼30% resulting from a decrease in sympathetic
activity, direct vasodilation, and myocardial depression.44,45
temperature combinations, confirming the tight coupling When the anesthetic was switched from isoflurane to propofol,
between CBF and CMRO2 ; any change in metabolic demand there was a statistically significant increase in HR, suggesting
was met by a corresponding change in substrate delivery via that decrease in peripheral vascular resistance induced by pro-
CBF modulation. pofol was partially compensated by an increase in HR.42
Figure 6 shows the relationships between CMRO2 and CBF In the present study, TR-NIRS was used to separate the
under the different anesthetic groups at baseline and during HT; effects of tissue scattering from absorption and measure both
there is a strong linear dependence of CBF on CMRO2 for both endogenous and exogenous tissue chromophore concentra-
anesthetic groups. This result shows that brain temperatures and tions.46 Although quantitative and mobile, a limitation with
anesthetics did not alter the CBF and CMRO2 coupling in the the TR-NIR technique is the need to inject a bolus of
healthy brain; however, this might not be the case for an ICG every time CBF is measured. However, this is a minimally
injured brain. invasive procedure since ICG is injected into a peripheral vein
and the time-dependent arterial ICG concentration curve can
4 Discussion be measured noninvasively by pulse dye densitometry.
Furthermore, ICG is approved for clinical use in North
We investigated the relationship between CMRO2 and CBF
America and the incidence of allergic reactions to the dye is
under normothermia (38°C) and mild whole body HT (35°C
very low (∼1∶250;000) in both adults and newborns.47 Recently,
or 33°C) with two different anesthetics, isoflurane ð1% to 2%Þ∕
Verdecchia et al. have shown that TR-NIRS can be combined
ðN2 66% ; O2 33% Þ, and propofol∕ðN2 O70% ; O2 30% Þ, which is rep-
resentative of what may be used in clinical practice.35 Previous with diffuse correlation spectroscopy to provide a quasicontin-
studies have shown that the temperature range associated with uous quantitative assessment of CBF and CMRO2 .14 With this
better neurological outcomes is between 33°C and 35°C.36 approach, only infrequent injections of ICG are needed to
However, cooling the whole body below 34°C can induce severe calibrate the continuous measurement of changes in CBF and
complications including shivering, skin erythema, renal failure, CMRO2 into absolute values.
coagulopathy, pulmonary hypertension, reducing cardiac, and The superficial layer on the newborn head (scalp and skull)
increased mortality.37,38 Consequently, to limit the deleterious is relatively thin (about 1 to 2 mm) so that the contribution of
effects of whole body cooling, only mild HT, in which the the extracerebral tissue layer to the signal is relatively small.
brain temperature is decreased to 33°C, has been applied in Consequently, the TPSFs were analyzed using the solution to
this study. Our results showed that compared to normothermia, the diffusion equation for a semi-infinite homogeneous
mild HT decreases both CBF and CMRO2 with preserved flow- medium.12 Extracerebral contamination is a major issue in
metabolism coupling shown by constant OEF under different the adult studies because of the greater thickness of the scalp
anesthetics. Flow-metabolism coupling within the brain is a and skull;16 however, depth-resolved approaches enable the sep-
complex physiologic process that is regulated by a combination aration superficial contributions and deep components on the
of metabolic, glial, neural, and vascular factors.5,39,40 In the nor- basis that light penetration increases with source-detector dis-
mal brain, autoregulated CBF is cerebrovascular and metabolic tance. Furthermore, TR-NIRS has the ability to distinguish early
reactivity induced by changes in arterial carbon dioxide tension from late arriving photons. Since photons with extended time-
operate to maintain a tight coupling between CBF and CMRO2 . of-flight have a higher probability of probing deeper tissue, TR-
However, during cerebral ischemic insults, alterations of cer- NIRS can discriminate superficial from deep tissue absorption
ebral hemodynamic and metabolism are highly dynamic. As from measurements acquired at a single source-detector.48
cerebral perfusion pressure (CPP) falls, CBF is maintained A potential concern with our experimental procedure is that
by autoregulation41 through vasodilatation of resistance arteri- anesthesia was initiated with isoflurane during preparatory
oles, but when the capacity for compensatory vasodilation is surgery and at normothermia. Besides being an easy to use anes-
exceeded, autoregulation fails and CBF falls as a function of thetic agent to induce anesthesia, isoflurane increases CBF
CPP. When oxygen supply is diminished due to decreasing relative to propofol/nitrous oxide and affords the condition
CBF, OEF increases in an effort to compensate for the reduced to investigate whether autoregulation responses (flow metabo-
CBF to maintain CMRO2 commensurate with metabolic lism coupling) remain intact at low-dose isoflurane at
Neurophotonics 035006-6 Jul–Sep 2015 • Vol. 2(3)
Downloaded From: https://www.spiedigitallibrary.org/journals/Neurophotonics on 26 Dec 2021
Terms of Use: https://www.spiedigitallibrary.org/terms-of-useBakhsheshi et al.: Coupling of cerebral blood flow and oxygen consumption. . .
normothermia.49 Understanding how the combination of HT 6. G. Q. Cheng et al., “Effects of selective head cooling on cerebral blood
under different anesthetics may alter flow-metabolism coupling flow and cerebral metabolic rate in newborn piglets,” Zhonghua Er Ke
Za Zhi 43, 748–752 (2005).
or OEF from its basal values in the healthy brain is critical
7. W. J. Powers, “Cerebral hemodynamics in ischemic cerebrovascular
before extending these neuroprotective strategies to the injured disease,” Ann. Neurol. 29, 231–240 (1991).
brain. Therefore, it might be worth trying different anesthetic 8. C. P. Derdeyn et al., “Variability of cerebral blood volume and oxygen
induction agents in future studies. As well, rewarming is a criti- extraction: stages of cerebral haemodynamic impairment revisited,”
cal phase of therapeutic HT in which too fast rewarming rates Brain 125, 595–607 (2002).
may retrigger destructive processes at the cellular level.50 Rapid 9. D. Azzopardi et al., “Treatment of asphyxiated newborns with moderate
rewarming of the injured brain commonly leads to a mismatch hypothermia in routine clinical practice: how cooling is managed in the
UK outside a clinical trial,” Arch. Dis. Child Fetal Neonatal Ed. 94,
between cerebral metabolism and perfusion (hence increased F260–F264 (2009).
OEF) and can cause rebound ICP elevations, cerebral venous 10. S. Enomoto et al., “Rapid rewarming causes an increase in the cerebral
desaturation, and brain ischemia. It is suggested that controlling metabolic rate for oxygen that is temporarily unmatched by cerebral
the rewarming rate to as low as 0.1°C to 0.4°C∕h is preferred to blood flow. A study during cardiopulmonary bypass in rabbits,”
reduce the neurological risks.51 Therefore, monitoring for pos- Anesthesiology 84, 1392–1400 (1996).
sible deleterious effects of rewarming via TR-NIRS measure- 11. D. W. Brown et al., “Near-infrared spectroscopy measurement of
oxygen extraction fraction and cerebral metabolic rate of oxygen in
ment of OEF as developed in this study is important for
newborn piglets,” Pediatr. Res. 54, 861–867 (2003).
guaranteeing HT treatment efficacy. 12. M. Diop et al., “Comparison of time-resolved and continuous-wave
near-infrared techniques for measuring cerebral blood flow in piglets,”
J. Biomed. Opt. 15, 057004 (2010).
5 Conclusion 13. D. W. Brown et al., “Quantitative near infrared spectroscopy measure-
We have measured the cerebral metabolic activity (CMRO2 ) and ment of cerebral hemodynamics in newborn piglets,” Pediatr. Res. 51,
CBF at different temperatures in a neonatal animal model. Both 564–570 (2002).
CBF and CMRO2 decreased with lowering of the brain temper- 14. K. Verdecchia et al., “Quantifying the cerebral metabolic rate of oxygen
by combining diffuse correlation spectroscopy and time-resolved near-
ature but the OEF remained unchanged, which indicates a tight infrared spectroscopy,” J. Biomed. Opt. 18, 027007 (2013).
coupling of flow and metabolism over the mild HT temperature 15. K. M. Tichauer et al., “Measurement of cerebral oxidative metabolism
range (38°C to 33°C). This tight coupling might not be preserved with near-infrared spectroscopy: a validation study,” J. Cereb. Blood
leading to increased OEF above the normal values when oxida- Flow Metab. 26, 722–730 (2006).
tive stress occurs as in the ischemic brain. Furthermore, rewarm- 16. J. T. Elliott et al., “Quantitative measurement of cerebral blood flow in a
ing is a critical phase of therapeutic HT to monitor for oxidative juvenile porcine model by depth-resolved near-infrared spectroscopy,”
J. Biomed. Opt. 15, 037014 (2010).
stress.10,52 Rapid rewarming of the injured brain commonly
17. J. T. Elliott et al., “Quantifying cerebral blood flow in an adult pig ische-
leads to a mismatch between cerebral metabolism and perfu- mia model by a depth-resolved dynamic contrast-enhanced optical
sion10 (hence increased OEF) and can cause rebound ICP ele- method,” Neuroimage 94, 303–311 (2014).
vations,53 cerebral venous desaturation,52 and brain ischemia. It 18. J. T. Elliott et al., “Variance of time-of-flight distribution is sensitive to
is suggested that controlling the rewarming rate to as low as 0.1° cerebral blood flow as demonstrated by ICG bolus-tracking measure-
C to 0.4°C∕h is preferred to reduce the neurological risks.54 ments in adult pigs,” Biomed. Opt. Express 4, 206–218 (2013).
Therefore, monitoring for possible deleterious effects of 19. M. Dehaes et al., “Cerebral oxygen metabolism in neonatal hypoxic
ischemic encephalopathy during and after therapeutic hypothermia,”
rewarming via TR-NIRS measurement of OEF as developed
J. Cereb. Blood Flow Metab. 34, 87–94 (2013).
in this study is important for guaranteeing HT treatment efficacy. 20. R. H. Ossoff, “Implementing the ANSI Z 136.3 laser safety standard in
Although the results from this pilot study were encouraging, the medical environment,” Otolaryngol. Head Neck Surg. 94, 525–528
more animal experiments will be required to evaluate flow- (1986).
metabolism coupling in the injured brain, e.g., in HI. 21. W. Becker, Advanced Time-Correlated Single Photon Counting
Technique, Springer, New York (2005).
22. V. Ntziachristos and B. Chance, “Accuracy limits in the determination of
Acknowledgments absolute optical properties using time-resolved NIR spectroscopy,”
Med. Phys. 28, 1115–1124 (2001).
The authors would like to thank Jennifer Hadway for her help in
23. A. Kienle and M. S. Patterson, “Improved solutions of the steady-state
conducting the animal experiments. This study was funded in and the time-resolved diffusion equations for reflectance from a semi-
part through support from the Canadian Institutes of Health infinite turbid medium,” J. Opt. Soc. Am. A Opt. Image Sci. Vis. 14,
Research and the Heart and Stroke Foundation of Canada. 246–254 (1997).
24. K. M. Yoo et al., “When does the diffusion approximation fail to
describe photon transport in random media?,” Phys. Rev. Lett. 64,
References 2647–2650 (1990).
25. R. Cubeddu et al., “Experimental test of theoretical models for time-
1. E. M. Moore et al., “Therapeutic hypothermia: benefits, mechanisms
resolved reflectance,” Med. Phys. 23, 1625–1633 (1996).
and potential clinical applications in neurological, cardiac and kidney
26. M. L. Landsman et al., “Light-absorbing properties, stability, and spec-
injury,” Injury 42, 843–854 (2011).
tral stabilization of indocyanine green,” J. Appl. Physiol. 40, 575–583
2. M. Erecinska et al., “Effects of hypothermia on energy metabolism in
(1976).
mammalian central nervous system,” J. Cereb. Blood Flow Metab. 23,
27. A. Cenic et al., “Dynamic CT measurement of cerebral blood flow: a
513–530 (2003).
validation study,” AJNR Am. J. Neuroradiol. 20, 63–73 (1999).
3. M. Sakoh and A. Gjedde, “Neuroprotection in hypothermia linked to
28. K. L. Zierler, “Equations for measuring blood flow by external moni-
redistribution of oxygen in brain,” Am. J. Physiol. Heart Circ.
toring of radioisotopes,” Circ. Res. 16, 309–321 (1965).
Physiol. 285, H17–H25 (2003).
4. M. P. Ehrlich et al., “Effect of hypothermia on cerebral blood flow and 29. N. Roche-Labarbe et al., “Noninvasive optical measures of CBV, StO
(2), CBF index, and rCMRO(2) in human premature neonates’ brains in
metabolism in the pig,” Ann. Thorac. Surg. 73, 191–197 (2002).
the first six weeks of life,” Hum. Brain Mapp. 31, 341–352 (2010).
5. W. J. Powers et al., “Cerebral blood flow and cerebral metabolic rate
of oxygen requirements for cerebral function and viability in humans,” 30. G. Mchedlishvili, Arterial Behavior and Blood Circulation in the Brain,
J. Cereb. Blood Flow Metab. 5, 600–608 (1985). Consultants Bureau, New York (1986).
Neurophotonics 035006-7 Jul–Sep 2015 • Vol. 2(3)
Downloaded From: https://www.spiedigitallibrary.org/journals/Neurophotonics on 26 Dec 2021
Terms of Use: https://www.spiedigitallibrary.org/terms-of-useBakhsheshi et al.: Coupling of cerebral blood flow and oxygen consumption. . .
31. H. M. Watzman et al., “Arterial and venous contributions to near- 52. J. van der Linden et al., “Is cerebral blood flow/metabolic mismatch
infrared cerebral oximetry,” Anesthesiology 93, 947–953 (2000). during rewarming a risk factor after profound hypothermic procedures
32. D. R. White et al., “The composition of body tissues (II). Fetus to young in small children?,” Eur. J. Cardiothorac. Surg. 3, 209–215 (1989).
adult,” Br. J. Radiol. 64, 149–159 (1991). 53. T. Shiozaki et al., “Effect of mild hypothermia on uncontrollable
33. A. Nozari et al., “Maximisation of cerebral blood flow during experi- intracranial hypertension after severe head injury,” J. Neurosurg. 79,
mental cardiopulmonary resuscitation does not ameliorate post-resusci- 363–368 (1993).
tation hypoperfusion,” Resuscitation 40, 27–35 (1999). 54. J. T. Povlishock and E. P. Wei, “Posthypothermic rewarming consider-
34. M. Diop et al., “Time-resolved near-infrared technique for bedside mon- ations following traumatic brain injury,” J. Neurotrauma 26, 333–340
itoring of absolute cerebral blood flow,” Proc. SPIE 7555, 75550Z (2009).
(2010).
35. C. Yokoe et al., “The effect of nitrous oxide inhalation on the hypoten- Mohammad Fazel Bakhsheshi received his PhD in medical biophys-
sive response to propofol: a randomized controlled trial,” Oral Surg. ics from Western University, Canada, in 2014. He received his BSc
Oral Med. Oral Pathol. Oral Radiol. 118, 166–173 (2013). degree in mechanical engineering from the University of Tehran, Iran,
36. P. J. Andrews et al., “European society of intensive care medicine study and MSc degree in mechanical engineering from Western University,
of therapeutic hypothermia (32–35 degrees C) for intracranial pressure Canada. He is currently a postdoctoral researcher at Robarts
reduction after traumatic brain injury (the Eurotherm3235Trial),” Trials Research Institute. His research interests include application of optics
12, 8 (2011). in brain temperature monitoring and developing of selective brain
37. M. Okada, “The cardiac rhythm in accidental hypothermia,” J. cooling methods to induce hypothermia.
Electrocardiol. 17, 123–128 (1984).
38. R. Y. Chen and S. Chien, “Hemodynamic functions and blood viscosity Mamadou Diop obtained a PhD in physics from the Center for Optics,
in surface hypothermia,” Am. J. Physiol. 235, 136–143 (1978). Photonics, and Lasers at Laval University (Quebec). He then took a
39. D. Attwell et al., “Glial and neuronal control of brain blood flow,” two-year postdoctoral position at the Institute for Microsctructural
Nature 468, 232–243 (2010). Sciences of the National Research Council (NRC) of Canada in
40. E. C. Peterson et al., “Regulation of cerebral blood flow,” Int. J. Vasc. Ottawa. After completion of his postdoc, he moved to London
(Ontario) to become a research associate at the Lawson Health
Med. 2011, 823525 (2011).
Research Institute (LHRI). He is currently a research scientist with
41. E. T. MacKenzie et al., “Effects of hemorrhagic hypotension on the cer- the imaging program of the LHRI at St. Joseph’s Hospital, where
ebral circulation. I. Cerebral blood flow and pial arteriolar caliber,” he develops noninvasive optical instruments and algorithms for medi-
Stroke 10, 711–718 (1979). cal applications.
42. F. Villa et al., “Inhalation versus endovenous sedation in subarachnoid
hemorrhage patients: effects on regional cerebral blood flow,” Crit. Care Laura B. Morrison received an associate degree in veterinary tech-
Med. 40, 2797–2804 (2012). nology from the University of Guelph (Ridgetown) and became a reg-
43. B. Matta and D. Menon, “Severe head injury in the United Kingdom and istered veterinary technician in 2005. She graduated from the
Ireland: a survey of practice and implications for management,” Crit. University of Guelph in 2008 with a Bachelor of Science in animal sci-
Care Med. 24, 1743–1748 (1996). ence. She started working in imaging research at Lawson Health
44. H. Moseley et al., “Propofol: a new intravenous anaesthetic,” West Research Institute in 2010 and acquired registered laboratory animal
Indian Med. J. 37, 229–231 (1988). technician status through the Canadian Association for Laboratory
45. T. Kazama et al., “Relation between initial blood distribution volume Animal Science in 2012. She continues to work passionately with
and propofol induction dose requirement,” Anesthesiology 94, 205– many biomedical imaging research projects and has been a previ-
210 (2001). ously published co-author.
46. J. Selb et al., “Improved sensitivity to cerebral hemodynamics during
brain activation with a time-gated optical system: analytical model Keith St. Lawrence is an associate professor in medical biophysics
and experimental validation,” J. Biomed. Opt. 10, 011013 (2005). at the University of Western Ontario and a scientist at the LHRI. His
research focuses on the development and application of imaging
47. T. R. Garski et al., “Adverse reactions after administration of indocya-
modalities, including optical methods, for mapping brain function and
nine green,” J. Am. Med. Assoc. 240, 635 (1978). assessing cerebrovascular health. He is currently supported by a per-
48. M. Diop and K. St Lawrence, “Improving the depth sensitivity of time- sonnel award from the Heart and Stroke Foundation, Ontario
resolved measurements by extracting the distribution of times-of-flight,” Provincial Office, to develop optical techniques for detecting cerebral
Biomed. Opt. Express 4, 447–459 (2013). ischemia in critical-care patients.
49. S. Strebel et al., “Dynamic and static cerebral autoregulation during
isoflurane, desflurane, and propofol anesthesia,” Anesthesiology 83, Ting-Yim Lee is director of PET/CT imaging research at Lawson
66–76 (1995). Health Research Institute, a scientist with Robarts Research
50. K. H. Polderman, “Application of therapeutic hypothermia in the inten- Institute, and a professor of medical imaging at the University of
sive care unit. Opportunities and pitfalls of a promising treatment Western Ontario. His research focuses on the use of imaging to
modality—Part 2: practical aspects and side effects,” Intensive Care study physiological processes in diseases. His lab has pioneered a
Med. 30, 757–769 (2004). method of using x-ray dye and CT scanning to measure blood flow
51. K. H. Polderman, “Mechanisms of action, physiological effects, and in various tissues, including the brain, tumors, and the heart.
complications of hypothermia,” Crit. Care Med. 37, S186–S202 (2009).
Neurophotonics 035006-8 Jul–Sep 2015 • Vol. 2(3)
Downloaded From: https://www.spiedigitallibrary.org/journals/Neurophotonics on 26 Dec 2021
Terms of Use: https://www.spiedigitallibrary.org/terms-of-useYou can also read