Brain networks underlying the processing of sound symbolism related to softness perception
←
→
Page content transcription
If your browser does not render page correctly, please read the page content below
www.nature.com/scientificreports
OPEN Brain networks underlying
the processing of sound symbolism
related to softness perception
Ryo Kitada1,2*, Jinhwan Kwon3, Ryuichi Doizaki4, Eri Nakagawa5, Tsubasa Tanigawa5,6,
Hiroyuki Kajimoto4, Norihiro Sadato5,6 & Maki Sakamoto4
Unlike the assumption of modern linguistics, there is non-arbitrary association between sound and
meaning in sound symbolic words. Neuroimaging studies have suggested the unique contribution of
the superior temporal sulcus to the processing of sound symbolism. However, because these findings
are limited to the mapping between sound symbolism and visually presented objects, the processing
of sound symbolic information may also involve the sensory-modality dependent mechanisms. Here,
we conducted a functional magnetic resonance imaging experiment to test whether the brain regions
engaged in the tactile processing of object properties are also involved in mapping sound symbolic
information with tactually perceived object properties. Thirty-two healthy subjects conducted a
matching task in which they judged the congruency between softness perceived by touch and softness
associated with sound symbolic words. Congruency effect was observed in the orbitofrontal cortex,
inferior frontal gyrus, insula, medial superior frontal gyrus, cingulate gyrus, and cerebellum. This
effect in the insula and medial superior frontal gyri was overlapped with softness-related activity that
was separately measured in the same subjects in the tactile experiment. These results indicate that
the insula and medial superior frontal gyrus play a role in processing sound symbolic information and
relating it to the tactile softness information.
In modern linguistics, it is widely assumed that the acoustic features of a word are arbitrarily associated with
its meaning1,2. This assumption is supported by the fact that the same concept is expressed by different sounds
in different languages. However, an increasing number of studies have shown that a non-arbitrary association
between sound and meaning can exist in some words called sound symbolic w ords3–8. For instance, a curvy
round shape and spiky angular shape can be associated with the nonsense word “maluma” or “bouba” and with
the nonsense word “takete” or “kiki”, respectively (the “bouba/kiki effect”)8. However, the neural mechanisms
underlying this non-arbitrary mapping between sound and its semantic dimensions are not well understood.
Because sound symbolic words are associated with specific semantic dimensions, the processing of such
words can involve the neural substrates for processing the corresponding semantic dimensions. For instance,
if the sound symbolic words are associated with object shape and size, then the processing of these words
can involve the neural substrates that associate the sound with the sensory processing of object shape and
size. This idea is supported by findings which showed that congenitally blind individuals show weaker sound-
shape associations9–11 and a study that found that prelingual auditory deprivation reduced the bouba–kiki effect,
although they performed above chance level12. These findings raise the possibility that the processing of sound
symbolic words associated with object properties involves sensory-modality dependent brain networks.
Previous neuroimaging studies have examined the brain networks that are involved in the processing of sound
symbolic words7,13–19. Among them, more recent neuroimaging studies have examined brain activity when the
subjects conducted matching tasks between sound symbolic words and visually presented objects such as: match-
ing between Japanese mimetic words and body g estures16; matching between the size of visual stimuli and sound
“bobo”/”pipi”18; and matching between sound “bouba”/”kiki” and the spikiness/roundness of visual s timulus19.
Two of these studies showed that the matching between sound symbolic words and visually presented objects
1
Division of Psychology, School of Social Sciences, Nanyang Technological University, 48 Nanyang Avenue,
Singapore 639818, Singapore. 2Faculty of Intercultural Studies, Kobe University, 1‑2‑1 TsuruKabuto, Nada‑ku,
Kobe 657‑8501, Japan. 3Kyoto University of Education, Fukakusa‑Fujimori‑cho 1, Fushimi‑ku, Kyoto 612‑8522,
Japan. 4Department of Informatics, Graduate School of Informatics and Engineering, The University of
Electro-Communications, 1‑5‑1 Chofugaoka, Chofu, Tokyo 182‑8585, Japan. 5National Institute for Physiological
Sciences, Nishigonaka 38, Myodaiji‑cho, Okazaki 444‑8585, Japan. 6The Graduate University for Advanced Studies
(SOKENDAI), Shonan Village, Hayama, Kanagawa 240‑0193, Japan. *email: ryokitada@ntu.edu.sg
Scientific Reports | (2021) 11:7399 | https://doi.org/10.1038/s41598-021-86328-6 1
Vol.:(0123456789)
www.nature.com/scientificreports/
involves the region in and around the posterior part of the superior temporal sulcus (e.g., the middle temporal
gyrus18), though the exact location of activation varied among the studies16,18. Kanero et al.16 proposed that this
region is a part of the unique neural networks that process the sound symbolism. On the other hand, several
studies also reported the activation of sensory-dependent networks in the processing of sound symbolic words.
For instance, a study also reported that regions in the occipital cortex can be sensitive to incongruency between
the visually presented object size and its sound18. Another study showed that the imagery of unpleasantness from
pain-related mimetic words evoked activation of several brain regions including the anterior cingulate cortex, a
part of the network of pain p rocessing14. These findings partially support the hypothesis that the processing of
sound symbolic words can involve sensory-dependent and sensory-independent networks in the brain.
The majority of the aforementioned neuroimaging studies have focused on the mapping between visually
presented objects and sound symbolic words. Thus, it is unclear if the same neural substrates are involved in
the matching between sound symbolic words and objects presented in other sensory modalities. In the present
study, we focused our investigation on the neural correlates of association between sound symbolic words and
object properties perceived by touch.
Previous neuroimaging studies have shown that specific sets of brain regions are engaged in tactile pro-
cessing of object properties. Tangible object properties are organized into two major categories: macro-spatial
and material p roperties20. The former category, which includes the perception of shape, orientation, and loca-
tion, needs some form of a spatial reference system (spatial coding)21. By contrast, the latter category, which
includes roughness, softness, and temperature, is expressed as intensity (intensity coding). It has been demon-
strated that distinct but overlapping brain networks are involved in the processing of macro-spatial and material
properties22–24. Specifically, activity in the parietal operculum (including the secondary somatosensory cortex,
PO), insula, and occipital cortex is greater for texture perception than for perception of s hape23 and of dot loca-
tion on a c ardboard24. The activation pattern in the parietal operculum and insula is related to the magnitude of
perceived roughness25,26 and temperature27, though the ascending pathways for mechanical and thermal inputs
differ. A recent functional magnetic resonance imaging (fMRI) study found that softness magnitude perceived
by touch is represented in the network including the posterior insula, anterior insula, parietal operculum, and
medial superior frontal g yrus28. Collectively, these studies indicate that the insula and PO are key nodes of the
network for tactile perception of material p roperties29,30. Thus, if the sensory-dependent network plays a key
role in the understanding sound symbolic information, the insula and PO can be also involved in the processing
of sound symbolic words for material properties. Though a previous behavioral study showed that high pitched
sounds are matched to haptically perceived angular shape and s oftness10, the underlying neural substrates have
not been investigated. Thus, it remains unknown whether this network involving the insula is also associated
with the mapping between tactile material information and sound symbolic words.
Another issue regarding the sound symbolic word is the familiarity with such words. If conventional sound
symbolic words evoke brain regions that are related to sensory information, it can be based on the learned arbi-
trary rules or inherent non-arbitrary associations. Previous functional MRI studies used either conventional
words14,16 or unfamiliar w ords18,19. However, to the best of our knowledge, the effect of familiarity of sound
symbolic words has not been investigated. If a specific sound is associated with specific object properties, we
can expect common brain networks involved in the processing of sound symbolic information, regardless of
the familiarity.
In this study, we tested the hypothesis that the mapping between sound symbolic words and tactually per-
ceived softness involves the insula/PO and medial superior frontal gyrus as the softness-dependent r egions28 and
the region in and around the posterior superior temporal sulcus (pSTS) as the sensory modality independent
region16,18. To this end, we conducted a functional MRI study that involves the three tasks: matching task (main
task), tactile task, and word softness-judgment task (word task).
The purpose of the matching task was to examine the neural correlates for the mapping between sound
symbolic words and associated softness information. This design was adopted from previous studies on sound
symbolic words16,18,19 and visuo-haptic association of material i nformation31. Specifically, the task design includes
two factors: the match between tactile and sound symbolic information and familiarity of sound symbolic words
(Fig. 1). We then compared the conditions in which tactually perceived softness is matched to sound symbolic
words (congruent conditions) with the conditions in which tactually perceived softness and sound symbolic
words are mismatched (incongruent conditions). The assumption is that the interaction of the tactile informa-
tion and sound symbolic information occurs to compare the two types of information in the hypothesized brain
regions. We manipulated the familiarity of sound symbolic words by using genetic algorithms32.
Additionally, the two supplementary experiments (tactile and word judgment tasks) were conducted to
examine signals when only tactile or sound symbolic information was given to the subjects. We assumed that
activity of the hypothesized regions shows response even when only one type of the inputs was given.
Results
Thirty-two healthy volunteers participated in the study. The matching task included five conditions: congruent
pairs of tactile stimuli and familiar words, congruent pairs of tactile stimuli and unfamiliar words, incongruent
pairs containing familiar words, incongruent pairs including unfamiliar words, and the low-level control condi-
tion. In the low-level control condition, only pseudowords were presented without tactile stimulation. The list of
the sound symbolic words is available in the Supplementary material (Supplementary Table 1).
Task performance. Matching task. Table 1 shows the congruency ratings and response times in the
matching task. Two-way repeated-measures analysis of variance (ANOVA) (2 levels of matching × 2 levels
of familiarity) for rating revealed a significant main effect of matching [F(1, 31) = 1629.3, p < 0.001] and a
Scientific Reports | (2021) 11:7399 | https://doi.org/10.1038/s41598-021-86328-6 2
Vol:.(1234567890)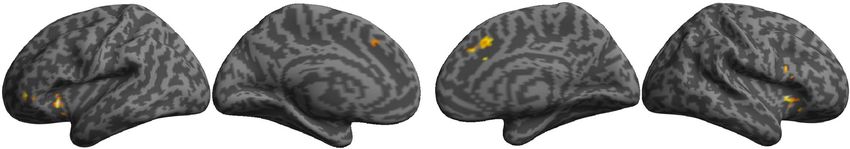
www.nature.com/scientificreports/
Figure 1. Experimental design. (A) Setup. We used an apparatus consisting of two cylinders that are connected
via an air tube. A weight that was placed on the cylinder outside the scanner (not shown in the figure) pushes
the cylinder inside the scanner via the air tube, which moved the stimulus onto the subject’s middle finger.
The tactile stimuli had identical shapes and sizes, whereas their compliances, deformation per applied force,
were varied. (B) Task schedule. In each trial, the fixation cross was replaced with one of the sound symbolic
words, and the tactile stimulus was pushed onto the finger twice within 5 s. The subject was asked to judge the
congruency of softness/hardness between tactile stimulus and sound symbolic words by pressing a button when
the red fixation cross was presented. In the control condition in which randomized characters were presented
and no tactile stimulus was given, the subject was asked not to respond.
Incongruent conditions Congruent conditions
Unfamiliar Familiar Unfamiliar Familiar
Congruency rating 1.45 1.20 3.27 3.65
SEM 0.04 0.03 0.05 0.04
Response time (s) 5.84 5.79 5.85 5.81
SEM 0.05 0.04 0.05 0.04
Table 1. Behavioral results. Response time is the time relative to the onset of each trial. SEM standard error of
the mean.
significant main effect of familiarity [F(1, 31) = 6.02, p = 0.02]. The same analysis also showed a significant
interaction [F(1, 31) = 105.8, p < 0.001] with the effect of matching on ratings was greater for the familiar
condition than the unfamiliar condition. Nevertheless, the post-hoc paired t-tests with Bonferroni correction
confirmed that the rating was greater for congruency than for incongruency pairs, regardless of the familiar-
ity (p values < 0.001).
The same ANOVA for response time showed only a significant main effect of familiarity [F(1, 31) = 14.67,
p = 0.001]. A significant main effect was observed neither for matching nor its interaction. Post-hoc paired t-tests
with Bonferroni correction showed greater response time for pairs with unfamiliar words than for those with
familiar words (p values < 0.05).
Word judgment task. Two-way repeated-measures ANOVA (2 levels of softness × 2 levels of familiarity) on
rating showed significant main effects of softness [F(1, 30) = 2498.62, p < 0.001] and familiarity [F(1, 30) = 9.08,
p = 0.005]. However the same ANOVA also showed a significant interaction between the two factors [F(1,
30) = 268.41, p < 0.001] with the difference of rating between “soft” and “hard” words in the familiar condition
being greater than the same difference of rating in the unfamiliar condition. Paired t-tests with Bonferroni cor-
rection confirmed that softness ratings for words associated with softness were greater than those related to
hardness, regardless of the familiarity (p values < 0.001) (Supplementary Table 2).
Tactile task. The behavioral ratings for the tactile task were shown in a previous study18. Specifically, we con-
firmed that the rating for the stimulus with higher compliance was greater than the stimulus with lower compli-
ance in all pairs of stimuli.
fMRI results. Matching task. Main effects of matching. As hypothesized, the contrast of congruent con-
ditions with incongruent conditions (congruency effect) revealed regions of significant activation in both the
Scientific Reports | (2021) 11:7399 | https://doi.org/10.1038/s41598-021-86328-6 3
Vol.:(0123456789)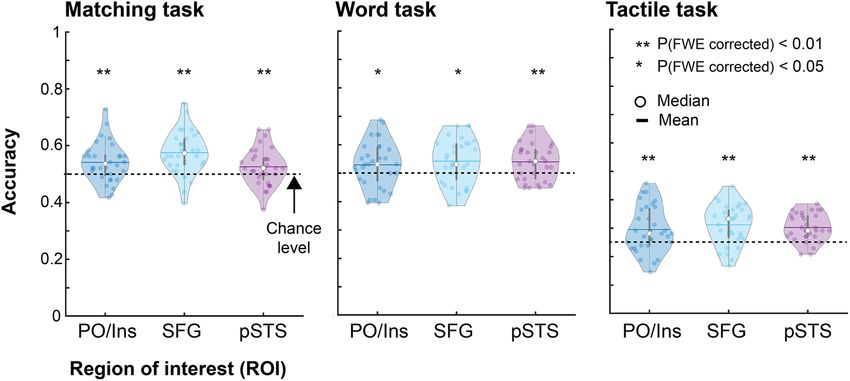
www.nature.com/scientificreports/

                                            Figure 2.  Main effects of matching (congruency effect). The activation revealed by the main effect of matching
                                            (congruency effect) in the group analysis was superimposed on a surface-rendered T1-weighted high-resolution
                                            MRI of an individual unrelated to the study. The opposite contrast revealed no significant activation. Note that
                                            no significant interaction with familiarity was observed. The statistical threshold for the spatial extent test was
                                            set at p < 0.05; family-wise error (FWE) corrected for multiple comparisons over the whole brain when the
                                            height (cluster-forming) threshold was set at p < 0.001 (uncorrected).

                                            Figure 3.  Main effects of familiarity (familiar conditions–unfamiliar conditions) in the matching task. The
                                            group-level activation revealed by the contrast of familiar sound symbolic words against unfamiliar words and
                                            by the opposite contrast was superimposed on a surface-rendered T1-weighted MRI of an individual unrelated
                                            to the study. No significant interaction with matching was observed. The statistical threshold for the spatial
                                            extent test was set at p < 0.05; family-wise error (FWE) corrected for multiple comparisons over the whole brain
                                            when the height (cluster-forming) threshold was set at p < 0.001 (uncorrected).

                                            bilateral insula and medial superior frontal gyrus. Additionally, the same contrast revealed activation in the
                                            bilateral inferior frontal gyrus, left orbitofrontal cortex, bilateral anterior insula, right cingulate gyrus, and right
                                            cerebellum (Fig. 2, Supplementary Table 3). A significant effect was not observed in the posterior temporal
                                            regions (e.g., middle temporal gyrus). The opposite contrast revealed no significant activation.

                                            Main effects of familiarity. The contrast of conditions with familiar words against conditions with unfamiliar
                                            words revealed regions of significant activation bilaterally in the angular gyrus, cuneus, insula, lingual gyrus,
                                            middle temporal gyrus, precuneus, superior frontal gyrus, superior occipital gyrus, superior temporal gyrus,
                                            and supramarginal gyrus. Moreover, the same contrast showed activation in the left cingulate gyrus, left fusiform
                                            gyrus, left parahippocampal gyrus, left postcentral gyrus, left precentral gyrus, right middle occipital gyrus, and
                                            right parietal operculum (Fig. 3A, Supplementary Table 4).
                                                The opposite contrast revealed regions of significant activation in the bilateral angular gyrus, bilateral inferior
                                            occipital gyrus, bilateral middle frontal gyrus, bilateral middle occipital gyrus, bilateral superior frontal gyrus,
                                            bilateral superior occipital gyrus, bilateral superior parietal lobule, left inferior frontal gyrus, left insula, left
                                            supramarginal gyrus, right precuneus, and bilateral cerebellum (Fig. 3B, Supplementary Table 4).

                                            Interaction between matching and familiarity effects.      No significant activation was observed.

          Scientific Reports |   (2021) 11:7399 |                 https://doi.org/10.1038/s41598-021-86328-6                                                      4

Vol:.(1234567890)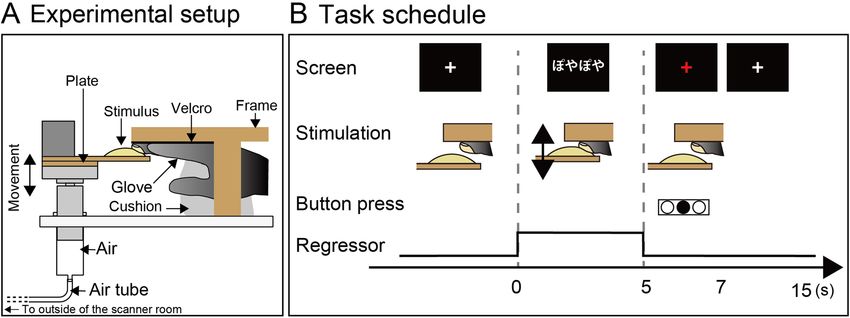
www.nature.com/scientificreports/
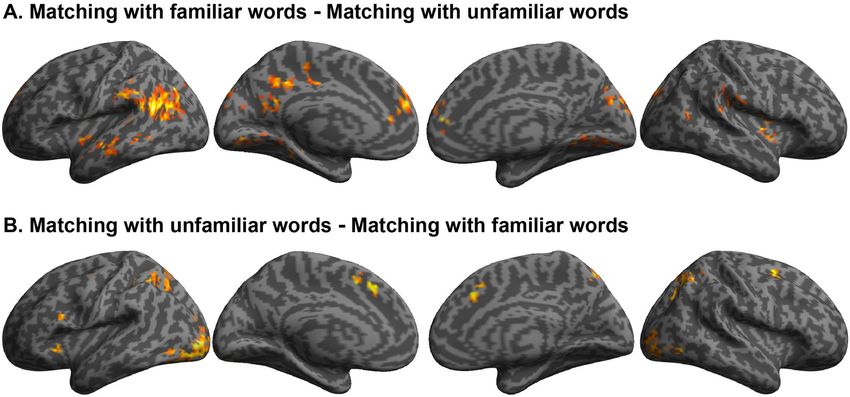
Figure 4. Overlap between the congruency effect in the matching task and the softness-related activation in
the tactile task. (A) Overlap of activation at the group-level between the congruency effect in the matching
task (Fig. 2) and the softness-related activation revealed by the parametric-modulation analysis of the tactile
task. The activation was presented on coronal and horizontal sections of the MRI averaged over the subjects.
The statistical threshold for the spatial extent test was set at p < 0.05; family-wise error (FWE) corrected for
multiple comparisons over the whole brain when the height (cluster-forming) threshold was set at p < 0.001
(uncorrected). (B) Representative individual results of overlapped activation. The height threshold was set at
p < 0.001 (uncorrected) without a cluster threshold.
Tactile task. The contrast for parametric-modulation revealed activation in the left insula, parietal opercu-
lum, and medial superior frontal gyrus. As shown in Fig. 4A, the congruency effect in the matching task was
overlapped with the softness-related activation in the tactile task in the anterior insula and medial superior
frontal gyrus. The conjunction analysis (with conjunction null) using an inclusive masking procedure33,34 con-
firmed significant activation in the left anterior insula and medial superior frontal gyrus (FWE corrected p
values < 0.05). Figure 4B shows the data of three representative subjects.
Word judgment task. The contrast of judgment of sound symbolic words against baseline revealed multiple
regions of significant activation over the whole brain, including the bilateral insula, medial superior frontal
gyrus, and pSTS (Supplemental Fig. 1A). The contrast of the interaction between softness impression and famili-
arity [(Familiar_Soft–Familiar_Hard) − (Unfamiliar_Soft–Unfamiliar_Hard)] revealed no significant activation
in the hypothesized regions; instead it revealed regions of significant activation in the bilateral lingual gyrus,
bilateral middle occipital gyrus, bilateral cuneus, and left inferior occipital gyrus. Given the presence of signifi-
cant interaction, we evaluated the effect of softness in each level of familiarity. As compared to the hard unfamil-
iar word condition, the soft unfamiliar word condition revealed greater activation in the bilateral lingual gyrus,
bilateral middle occipital gyrus, bilateral cuneus, and left inferior occipital gyrus (Supplementary Fig. 1B–E,
Supplementary Table 5). By contrast, no brain region showed greater activation in the soft familiar word condi-
tion than in the hard familiar word condition. Collectively, no significant effect of softness-hardness impressions
in the hypothesized regions was observed in the whole brain analysis.
VOI analysis. Next, we conducted volume-of-interests (VOI) analysis to examine the activation patterns in the
hypothesized regions (insula and the medial parts of the superior frontal gyrus) across the three tasks (Fig. 5).
To minimize the selection bias that using the same dataset for selection and selective analysis cause (“double-
dipping” problem)35, we used two independent data sets. One data set originated from our previous study28 and
was used to localize peak coordinates in these hypothesized regions. Then, we examined activity in these coor-
dinates in the other data set that included the tasks in the present study.
Matching task. Two-way repeated-measures ANOVA (2 levels of matching × 2 levels of familiarity) on the con-
trast estimates (relative to the control) revealed significant main effects of matching, with the congruent condi-
tion showing greater contrast estimates than the incongruent condition in both regions [F(1,31) = 6.2, p = 0.019
for the left insula; F(1, 31) = 25.2, p < 0.001 for the superior frontal gyrus]. The same analysis showed significant
main effects of familiarity, with unfamiliar conditions showing greater activation than familiar conditions in
both regions [F(1,31) = 5.7, p = 0.023 for the insula; F(1, 30) = 11.8, p = 0.002 for the superior frontal gyrus]. None
of the ROIs showed a significant interaction effect (p values > 0.4).
Word judgment task. Two-way repeated-measures ANOVA (2 levels of softness × 2 levels of familiarity) on
parameter estimates revealed significant main effect of softness with hard words producing greater activity than
soft words in the insula [F(1, 30) = 6.3, p = 0.018]; main effects of familiarity with unfamiliar words producing
Scientific Reports | (2021) 11:7399 | https://doi.org/10.1038/s41598-021-86328-6 5
Vol.:(0123456789)www.nature.com/scientificreports/
Figure 5. Volume-of-interest analysis. Activity (parameter or contrast estimates) extracted from the volumes
of interest (VOIs) that were defined with the independent data set (the main experiment in Kitada et al.28). Data
are presented as boxplots, where the box indicates the interquartile range [IQR, from 25th percentile (Q1) to
75th percentile (Q3)]. The thick line and black cross in the box indicate the median and mean, respectively.
Whiskers indicate the maximum and minimum value. Circles and notches of the boxes indicate data points
and 95% confidence levels, respectively. Asterisks and symbols indicate the result of ANOVA for the matching
and word judgment tasks, and the result of post-hoc pairwise comparisons (with Bonferroni correction) for
the tactile task. Note that one subject’s data was excluded from the analysis of the word judgment task due to
technical issues. The figure was made with BoxPlotR (http://shiny.chemgrid.org/boxplotr/).
greater activity in the all ROIs [F(1, 30) = 23.7, p < 0.001 for the left insula; F(1, 30) = 14.5, p = 0.001 for the supe-
rior frontal gyrus]. None of the regions showed significant interaction (p values > 0.1).
Tactile task. Two-way repeated-measures ANOVA (4 levels of softness) on the contrast estimates (relative to
the control) revealed a significant main effect in all regions [F(3, 93) = 4.7, p = 0.004 for the insula; F(3, 93) = 7.1,
p < 0.001 for the superior frontal gyrus]. Pairwise comparisons with Bonferroni correction showed that the con-
trast estimates for the hardest stimulus were lower than those for the second-hardest (Med-Hard) stimulus in
both regions (p values < 0.01), lower than those for the softest stimulus in the left insula (p = 0.033), and lower
than those for the second-softest stimulus (Med-Soft) in the superior frontal gyrus (p = 0.007). These results
confirm that the insula and superior frontal gyrus are affected by the magnitude of tactually perceived softness.
Multi‑voxel pattern analysis. The univariate anlaysis showed the matching effect in the insula nad medial supe-
rior frontal gyrus, whereas no such effect was found in the pSTS. To further examine whether the pSTS contains
information about sound symbolic information and its matching effect with tactile information, we conducted a
multi-voxel pattern analysis (MVPA) (Fig. 6). Based on our previous studies16,18,28 the insula/PO, medial part of
superior frontal gyrus, and pSTS were chosen as ROIs. All ROIs in all tasks showed significantly greater accuracy
than chance level (p values < 0.05 Bonferroni corrected).
Scientific Reports | (2021) 11:7399 | https://doi.org/10.1038/s41598-021-86328-6 6
Vol:.(1234567890)www.nature.com/scientificreports/
Figure 6. Multi-voxel pattern analysis on object compliance. Distributions of performance accuracy of MVPA.
Each dot indicates the performance for each subject. Asterisks indicate the result of permutation tests (with
Bonferroni correction). PO/Ins, parietal operculum/insula; SFG, medial superior frontal gyrus; pSTS, region in
and around the superior temporal sulcus; FWE, family-wise error. Note that dot lines indicate the theoretical
chance level: 50% for the matching and word judgment tasks and 25% for the tactile task.
Discussion
In this study, we examined the brain networks engaged in the processing of sound symbolic information that are
associated with object’s softness and hardness. While a distributed set of brain regions was affected by the con-
gruency between perceived softness and sound symbolic words, the congruency effect was observed in or close
to the region that showed the graded response to perceived softness in the anterior insula and medial superior
frontal gyrus. This effect was similarly observed regardless of the familiarity (i.e., no interaction effect between
familiarity and matching). The MVPA showed that the PO/insula contained information on congruency, the
magnitude of softness perceived by touch, and the magnitude of softness associated with sound symbolic words.
This study used different words between conditions. The matching task involved the same sets of words and
tactile stimuli between the congruency and incongruency conditions. The subtraction of the incongruency effect
from the congruency effect should cancel out the difference of these inputs. Thus, it is unlikely that the observed
congruency effect is explained merely by the difference in stimuli. We used two independent data sets for the
VOI and ROI analysis: one data set was used to localize the brain regions for tactile softness perception in VOI
and ROI analysis from our previous s tudy28 and the other data set which consist of the three tasks (matching task,
tactile task, and word judgement task) were used to evaluate activity in these identified regions. This procedure
follows the policy of selective analysis35 as used in previous studies18,36,37. Thus, we have minimized selection
bias in our procedure.
To the best of our knowledge, this is the first neuroimaging study that depicted the interaction of brain activity
between sound symbolic words and material properties perceived by touch. More specifically, previous neuroim-
aging studies highlighted the involvement of the pSTS in the matching between visually presented body action
and mimetic words16 and between the size of visual stimuli and auditorily presented onomatopoeia18. In contrast,
the present study revealed that the insula and medial superior frontal gyrus are associated with the congruency
effect between tactile softness perception and sound symbolic words. This network contained information on
the perceived magnitude of softness, as well as the congruency effect. This result indicates that the brain network
that processes information of perceived softness is also engaged in processing the associated sound symbolic
words. This finding is consistent with the idea that the processing of sound symbolic information involves the
sensory-modality dependent regions. For instance, the onomatopoeia of pain can evoke brain activation in the
anterior cingulate cortex, which is considered a part of the pain processing n etwork14. The comparison of visual
sizes of stimuli with sound symbolic words activated the occipital lobe as well as the p STS18.
Within the regions showing the congruency effect, the left insula contained some information about sound
symbolic words, as evidenced by the VOI and MVPA analyses on the word judgment task. Thus, it is possible
that the insula receives the information about softness perceived by touch and softness associated with sound
symbolic words, causing the interaction between the two types of information. This speculation is fit to the
concept of multisensory integration that occurs in a region with signals of each sensory m odality38,39.
We also found the congruency effect in other prefrontal regions, consistent with the previous finding of an
intermodal interaction effect in the prefrontal cortex6,7. In our stimuli, the sounds /k/ and /g/ were associated
with words related to hard referents (e.g., kada-kada and gai-gai), whereas the sounds /p/ and /f/ were associated
with words related to soft objects (e.g., funo-funo and yapu-yapu). To confirm the associated tactile softness,
Scientific Reports | (2021) 11:7399 | https://doi.org/10.1038/s41598-021-86328-6 7
Vol.:(0123456789)www.nature.com/scientificreports/
some subjects reported that they covertly produced the sounds of the presented words. Thus, activation in these
regions may be partly associated with such heuristics. This speculation is consistent with the perspective that
the anterior insula and inferior frontal gyrus are associated with covert a rticulation40, as well as with previous
findings that this region is also sensitive to matching between picture and words that do not contain sound
symbolism41–43. The congruency between the impression of softness from covertly-produced sounds and tactile
information may become more salient, leading to activation in the insula and the medial areas in the superior
frontal gyrus. This idea is in accord with the view that the anterior insula and medial prefrontal cortex form the
network for salient stimuli (saliency network) 44,45.
The MVPA also showed that the pSTS contains information about congruency. This indicates that the pos-
terior temporal region is also a part of the network in matching between tactile stimuli and sound symbolic
information. However, contrary to the findings in previous studies16,18, this region showed a nonsignificant effect
in the mass-univariate analysis. One interpretation for this weak effect is the difference in the stimuli. Again, the
comparison of sensory stimulus with the sound symbolic information should occur in the regions that receive
inputs from each related network. For instance, Kanero et al.16 used body actions as the referents of mimetic
words. The pSTS is a key node of the network of action u nderstanding46–48 as well as language processing48,49;
hence, a suitable area for the matching effect. Likewise, other studies have shown an interaction effect in a distrib-
uted set of the occipital and temporal cortex, which is ideal for auditory-visual integration18,19. By contrast, our
study involved tactile softness perception, which involves a network of frontal regions rather than the posterior
temporal region28. Thus, it is possible that the pSTS plays a minor role in the matching between tactile stimuli and
sound symbolic words, although it can be a part of the engaged network. Thus, further research is necessary to
examine to what extent the pSTS plays a modality-independent role in processing sound symbolic information.
Familiar and unfamiliar sound symbolic words caused different patterns of brain activation in the match-
ing between tactile and symbolic word information. Thus, our results indicate that, although mapping between
tactile and sound symbolic words occurs in the same frontal regions, the familiarity affects the activation of
cortical networks. The familiar sound symbolic words evoked activation in the brain regions including the
infero-medial prefrontal cortex, angular gyrus, and posterior cingulate gyrus. This network for the recognition
of familiar sound symbolic words is highly similar to that in the results of a meta-analysis on f amiliarity50. On
the other hand, unfamiliar sound symbolic words showed stronger activation in a different set of brain regions.
Our behavioral results showed that the effect of matching on ratings was greater for the familiar condition than
the unfamiliar condition, and the response time for unfamiliar words was greater than that for familiar words.
These findings indicates that it requires greater task demand to interpret unfamiliar words than familiar words.
Thus, it is possible that greater activation in the unfamiliar condition may be due to the increased task demand
to process novel information.
Finally, it is worth noting two interpretational issues. First, the word judgment task showed a higher signal
for hardness than for softness in the left anterior insula, whereas activity in the tactile task was positively graded
response to softness. Even though this region contains information about softness associated with the sound
symbolic word, the similarities and differences between tactile and sound symbolic representation of softness
in this region remain unclear. Thus, further research is necessary to address this point. Second, it is not clear to
what extent our result can be generalized to tactile tasks, since we used a limited set of sound symbolic words
and a single tactile stimuli. This is because fMRI studies with stringent control of tactile stimuli are technically
challenging and it is difficult to use multiple object properties in one experimental setup (e.g., both roughness
and softness). Future studies should examine to what extent the matching effect is generalized by using other
sound symbolic words and tactile stimuli with perceptual dimensions other than softness.
In conclusion, the insula and the medial parts of the superior frontal gyrus, which were associated with
softness magnitudes perceived by touch, showed a congruency effect between softness perceived by touch and
softness associated with sound symbolic words. This result indicates that these regions constitute nodes of the
network for mapping sound symbolic information onto tactile material information. In contrast to the previous
findings on the neural correlates for sound symbolic words, our finding highlights the role of the nodes in the
prefrontal cortex for the network of the matching between sound symbolic information and tactile material
information.
Methods
Subjects. Thirty-two Japanese individuals (17 men, 15 women) aged 18–35 years (mean ± standard devia-
tion = 23.3 ± 4.9 years) participated in the study. All subjects were right-handed, as assessed using the Edinburgh
Handiness Inventory51. None of the subjects reported a prior loss of tactile sensation or a history of major medi-
cal or neurological illnesses, such as epilepsy, significant head trauma, or a lifetime history of alcohol depend-
ence.
The study was conducted in accordance with the Declaration of Helsinki. All subjects provided written
informed consent before participation. The study protocol was approved by the ethics committees at the National
Institute for Physiological Sciences. All procedures were performed in accordance with the approved guidelines.
Experimental design and statistical analysis. The subjects performed three tasks: the main task,
touch-word matching task (matching task), tactile softness-judgment task (tactile task), and word softness-judg-
ment task (word judgment task). We adopted within-subject experimental designs in all tasks. All behavioral
data were analyzed using SPSS software (version 23; IBM Corporation, Armonk, NY). Bonferroni correction
was applied to control for multiple comparisons. All fMRI data were analyzed using the Statistical Parametric
Mapping 12 (SPM12) software package52 (RRID: SCR_007037) in MATLAB (MathWorks, Natick, MA, USA). In
the mass-univariate analysis, the statistical threshold for the spatial extent test on the clusters was set at p < 0.05,
Scientific Reports | (2021) 11:7399 | https://doi.org/10.1038/s41598-021-86328-6 8
Vol:.(1234567890)www.nature.com/scientificreports/
family-wise error (FWE) corrected for multiple comparisons over the whole brain. The height (cluster-forming)
threshold was set at p < 0.001 (uncorrected). This threshold is sufficiently high to use the random-field theory
to control FWE rate53. We used CoSMoMVPA toolbox to perform multi-variate voxel pattern analysis54 (RRID:
SCR_014519).
Stimulus presentation. Words. We prepared 60 words. Twelve sound symbolic words that refer to soft-
ness (Familiar_Soft) and 12 that refer to hardness of objects (Familiar_Hard) were selected from a dictionary of
Japanese mimetic w ords55. For instance, “fuka-fuka” and “kachi-kachi” were included in the stimuli. In addition,
we prepared 24 unfamiliar sound symbolic words, 12 for softness (Unfamiliar_Soft) and 12 for hardness (Unfa-
miliar_Hard) using genetic algorithms32. These new words include “yapu-yapu” for softness and “guko-guko” for
hardness (Supplementary Table 2). The number of Japanese characters ranged from 4 to 6 in each category and
the number of morae was limited to 2–3. Initially, 300 sound symbolic words were generated by the algorithm
and then evaluated by 12 subjects (7 male and 5 female) who did not participate in this study. We selected 24
based on the result of this pilot experiment. Finally, we made 12 pseudowords by assigning 4 Japanese characters
in a pseudo-randomized order (Random, e.g., “fugusau”).
Tactile stimuli presentation. We used 5 spherical segments that were made of urethane elastomer covered by
a plastic membrane and 1 spherical segment made of fiberglass-reinforced plastic (Bioskin; Beaulax Co., Ltd.,
Tokyo, Japan), all of which had the same size (5-cm diameter base × 1.3-cm height). We selected four stimuli
for the matching task based on their c ompliance28; the compliances for these stimuli were 10.26, 5.76, 0.79, and
0.20 mm/N. The former two stimuli were considered as soft, and the latter as hard stimuli. To examine the activ-
ity associated with moderately soft stimuli (i.e., between 1 and 5 mm/N), we used a different set of four stimuli
for the tactile task (10.26, 4.27, 1.13, and 0.20 mm/N).
We used the same MRI-compatible stimulus presentation device used in our previous study (Fig. 1A)28. This
device had a wooden frame supporting the subject’s right hand and pneumatic cylinders. The subjects wore a
glove that had a hole at the tip of the right middle finger. The backside of the glove was fastened to a Velcro strip
that was attached to the ceiling of the wooden frame. At the onset of each trial, the device pushed the stimuli
upward onto the right middle finger. The duration of each stimulation was approximately 2.2 s, repeated twice
within 5 s. One experimenter stood beside the scanner and wore MRI-compatible headphones (Kiyohara Optics,
Tokyo, Japan).
Matching stimuli. We paired each sound symbolic word with both soft and hard stimuli, creating congruent
and incongruent pairs. Each of the four tactile stimuli was paired with 6 words in each of the four categories
(Unfamiliar_Hard, Unfamiliar_Soft, Familiar_Hard, and Familiar_Soft; 6 words × 4 categories = 24 words for
each tactile stimuli). Consequently, we prepared 24 congruent pairs with familiar words, 24 congruent pairs with
unfamiliar words, 24 incongruent pairs with familiar words, and 24 incongruent pairs with unfamiliar words.
Each pair was presented only once in the experiment.
Setup. The setup was identical to our previous s tudy28. Subjects were placed in the supine position and were
instructed to remain relaxed during the scanning. Their heads were fixed using foam pads and tape to minimize
movement. The subjects were asked to extend their arms, placing their right hand in the wooden frame. They
held a response box in their left hand. Visual stimuli were presented to the subjects using the Presentation soft-
ware (Neurobehavioral Systems, Inc., Albany, CA, USA) implemented on a personal computer (dc7900; Hewl-
ett-Packard, Ltd., Palo Alto, CA, USA). A liquid crystal display projector (CP-SX12000; Hitachi, Ltd., Chiyoda,
Tokyo, Japan) located outside and behind the scanner projected the stimuli through a waveguide to a translucent
screen, which the subjects viewed via a mirror placed on the MRI scanner. The same software was used to present
auditory cues for the next stimulus to be presented and the timing of replacing the stimulus with the next one.
The auditory cues were only presented to the experimenter via headphones.
Data acquisition. We used a 3-T whole-body MRI scanner (Verio; Siemens, Erlangen, Germany) with a
32-element phased-array head coil. We employed a multiband echo-planar imaging (EPI) sequence that col-
lected multiple slices simultaneously, reducing the repetition time (TR) per v olume56. The same parameters
as our previous study28 was used to cover the whole brain: gradient-echo EPI, TR = 1000 ms, multiband fac-
tor = 6, echo time (TE) = 35 ms, flip angle = 65°, 60 axial slices of 2-mm thickness with a 25% slice gap, field-of-
view = 192 × 192 mm2, and in-plane resolution = 2.0 × 2.0 mm2. T1-weighted high-resolution anatomical images
were acquired for each subject using magnetization-prepared rapid acquisition gradient-echo (MP-RAGE)
m3).
sequences (TR = 1800 ms, TE = 1.98 ms, flip angle = 9°, and voxel size = 1 × 1 × 1 m
Matching task. The matching task included two factors: degree of match and familiarity of the sound sym-
bolic word. Each subject completed 6 runs of the task, which included each of the five conditions: congruent
pairs of tactile stimuli and familiar words, congruent pairs of tactile stimuli and unfamiliar words, incongruent
pairs containing familiar words, incongruent pairs including unfamiliar words, and the control condition. In the
low-level control condition, only pseudowords (Random) were presented without tactile stimulation.
A single run consisted of twenty 15-s trials (300 s in total) preceded by 20-s rest and followed by 10-s rest
(300 + 20 + 10 = 330 s in total, 330 volumes). Each condition was repeated 4 times in a single run (4 repetitions × 6
runs = 24 trials for each condition). One of the four tactile stimuli was presented once for each condition in
each run. The order of the five conditions in each run was pseudo-randomized. In each trial, a white cross was
Scientific Reports | (2021) 11:7399 | https://doi.org/10.1038/s41598-021-86328-6 9
Vol.:(0123456789)www.nature.com/scientificreports/
replaced with words for 5 s (Fig. 1B). During this period, the subject’s middle finger was stimulated in all condi-
tions except for the control condition. After 5 s, the red cross was presented for 2 s, during which the subject
pressed one of the four buttons with their left hand to indicate the degree of match (congruency) between the
words and the tactile stimuli. The response was calculated as the degree of match from 1 (lowest congruency)
to 4 (highest congruency). The order of the button presses was counterbalanced across the subjects. During the
rest of the trial, the subject was asked to stay still and the experimenter replaced the stimuli.
Data processing and analysis. The first 15 volumes of each fMRI run were discarded to allow the MR signal
to reach a state of equilibrium. The remaining volumes were used for the subsequent analyses. To correct for
head motion, functional images from each run were realigned to the first image and again realigned to the
mean image after the first realignment. The T1-weighted anatomical image was co-registered to the mean of
all realigned images. Prior to co-registration, the T1-weighted anatomical image was skull-stripped to prevent
non-brain tissue from affecting the alignment between the EPI and T1-weighted images. Each co-registered
T1-weighted anatomical image was normalized to the Montreal Neurological Institute (MNI) space using the
DARTEL procedure57. More specifically, each anatomical image was segmented into tissue class images using a
unified segmentation approach. Gray and white matter images were registered and normalized to space using
the preexisting template that is based on the data from 512 Japanese individuals scanned at the National Insti-
tute for Physiological Sciences, Japan. The parameters from DARTEL registration and normalization were then
applied to each functional and T1-weighted anatomical image. The normalized functional images were filtered
using a Gaussian kernel of 4-mm full-width at half-maximum (FWHM) in the x, y, and z axes. We then con-
ducted mass-univariate analyses as explained below.
Mass‑univariate analysis. A general linear model was fitted to the fMRI data for each subject. The blood-oxy-
gen-level dependent (BOLD) signal for the period of stimulus presentation was modeled using boxcar functions
convolved with the canonical hemodynamic response function. Each run in the design matrix included 4 task-
related regressors for each task condition (2 levels of match × 2 levels of familiarity) and 1 control condition. The
time series for each subject was high-pass-filtered at 1/128 Hz. As the traditional AR(1)+ white noise model can
fail to whiten the data with short TR, temporal autocorrelations were modeled and estimated from the pooled
active voxels by the FAST model and were used to whiten the data58,59. Motion-related artifacts were minimized
by incorporating the 6 parameters (3 displacements and 3 rotations) from the rigid-body realignment stage into
each model. The contrast estimates for the main effects of each factor and their interactions were evaluated using
linear contrasts.
Contrast images from the individual analyses were used for the group analysis, with between-subject variance
modeled as a random factor. The contrast images obtained from the individual analyses represent the normal-
ized task-related increment of the MR signal of each subject. We performed one-sample t-tests on the contrast
estimates obtained from the individual analyses. The resulting set of voxel values for each contrast constituted
the SPM{t}. The search volume was the whole brain. Brain regions were anatomically defined and labeled in
accordance with probabilistic atlases60 and an anatomical MR image averaged over all subjects.
VOI analysis. We conducted a VOI analysis to confirm the activation patterns in the brain areas that showed
congruency effect in the main experiment and softness-related activity in the supplementary tasks (described
below). We selected the coordinates by analyzing independent data on tactile softness perception28. Briefly, the
experiment of this independent data was identical to the tactile task in the present experiment except that it
adopted 2 within-subject factor design with 3 levels of softness and 2 levels of forces. To identify the coordinates
that showed softness-related activation regardless of the force levels, we employed a full factorial design that
includes all the task-related conditions. We used standardized scores of softnes ratings as contrast weights for
each force condition. We extracted parameter estimates from peak coordinates found in this analysis.
Multi‑voxel pattern analysis. We examined whether the predefined regions of interest (ROIs) contain informa-
tion on matching between words and touched objects. We constructed new design matrices to obtain t-values
for each trial. For each subject, 6 design matrices were produced with each modeling trials in each run. Each
regressor in a design matrix modeled BOLD signal during the presentation of stimuli in each trial. Thus, each
design matrix contained 20 task-related regressors (4 repetitions × 4 matching conditions + 4 repetitions per run
for the control condition) as well as the 6 motion-related parameters. We generated a map of voxel-wise t-values
(SPM{t} map) for each trial of each subject by evaluating the linear contrast of the regressor of each trial against
implicit baseline.
We performed classification analyses on the voxel-wise t-values of each s ubject61. A linear support vec-
tor machine (MATLAB’s SVM) was trained on data obtained from 5 runs to predict matching (congruent or
incongruent) in the remaining run. Accuracy was recorded for the attempted classification of the data. This
process was repeated 6 times, using a different run as the test data (leave-one-run-out cross-validation). These
cross-validated analyses were performed separately for each ROI. Because the conventional one-sample t-test
against the theoretical chance level may not provide a valid population inference62,63, we used random permu-
tation tests in each region at the single-subject level, and then combined the results at the group-level with a
bootstrap method63. More specifically, we randomly shuffled categories for each t map and then conducted the
aforementioned procedure 1000 times for each region of each subject. We then drew one result (including the
original result) from each subject and calculated the group-level mean 1000 times. We calculated the p value by
counting the number of permutations with equal or higher accuracy than that of the original result and corrected
it with Bonferroni correction.
Scientific Reports | (2021) 11:7399 | https://doi.org/10.1038/s41598-021-86328-6 10
Vol:.(1234567890)www.nature.com/scientificreports/
Based on previous studies on tactile softness p erception28 and matching between sound symbolic words and
visual stimuli16,18, we selected the following anatomically defined regions as ROIs: the left parietal operculum/
insula (PO/Insula, 23,048 mm3), right superior frontal gyrus (SFG, limited to y ≥ 0; 82,040 mm3), and the region
in and around the right posterior superior temporal sulcus (pSTS, limited to y ≦ 0; 39,328 mm3). The pSTS only
included the middle temporal gyrus and superior temporal sulcus because the superior temporal gyrus can
partially overlap the parietal operculum of subjects. These ROIs were anatomically defined using Shattuck’s
probabilistic map (LBPA40)60 and the probabilistic map in the SPM anatomy t oolbox64–66.
Supplementary task 1: word judgment task. We conducted two supplementary tasks to examine the
activation patterns when only one type of stimuli (sound symbolic words or touch) was presented: word judg-
ment task and tactile task.
The word judgment task included two within-subject factors: softness and familiarity. The experimental design
was identical to that of the matching task except for the following two points; no tactile stimulus was presented,
and the subject was asked to estimate the magnitude of softness that is associated with each word. The subject
reported the impression of the presented word from 1 (hard) to 4 (soft) by pressing buttons after the stimulus
presentation. The order of words was pseudo-randomized such that the same number of words in each category
(Familiar_Soft, Familiar_Hard, Unfamiliar_Soft, Unfamiliar_Hard, and Random) were presented in each run.
Each word was repeated twice (2 repetitions × 12 words × 5 categories = 120). The design matrix included 6 runs,
with each run containing five task-related regressors, each for each category of sound symbolic words.
We conducted whole brain analysis to examine the effect of softness and mean activation of all task conditions
against baseline. In the MVPA, a linear SVM was trained on data obtained from 5 runs to predict softness associ-
ated with sound symbolic words (softness or hardness) in the remaining run (theoretical chance level = 50%).
The remaining procedure was identical to that in the matching task. We analyzed the data of 31 subjects because
fMRI data of one subject was not collected due to technical issues.
Supplementary task 2: tactile task. Finally, the same subjects conducted the tactile task that involved
four levels of object compliance. The data was previously reported as “a functional localizer” (Supplemental
information in the previous study)28. Briefly, the experimental design was identical to that of the matching task,
except that no word was presented and the subject was asked to rate the softness of four tactile stimuli. Each
stimulus was repeated 4 times in a single run (4 repetitions × 6 runs = 24 trials for each stimulus). The control
condition served as an explicit baseline condition where no stimulus was presented. The design matrix included
6 runs, with each run containing two task-related regressors: one for the tactile stimulation, and the other for
the baseline condition.
To evaluate the brain activity positively correlated with the subject’s rating of perceived softness (softness-
related activation), we performed parametric-modulation analysis67 in which the subject’s trial-by-trial ratings
were used as parametric modulators. The regressor for parametric modulators was orthogonalized to that for the
task-related regressors. In the group analysis, we performed a one-sample t-test on the parameter estimates for
parametric modulators that were obtained from the individual analysis. The MVPA procedure was identical to
that in the matching task, except that the trained classifier was used to predict softness (4 levels) in the remaining
run (theoretical chance level = 25%).
Data availability
The datasets generated during and/or analyzed during the current study are available from the corresponding
author on reasonable request.
Received: 23 April 2020; Accepted: 15 March 2021
References
1. de Saussure, F. Course in General Linguistics (Open Court, 1983).
2. Hockett, C. F. The origin of speech. Sci. Am. 203, 88–111 (1960).
3. Sapir, E. A study in phonetic symbolism. J. Exp. Psychol. 12, 225–239 (1929).
4. Ramachandran, V. S. & Hubbard, E. M. Synaesthesia—a window into perception, thought and language. J. Conscious. Stud. 8, 3–34
(2001).
5. Maurer, D., Pathman, T. & Mondloch, C. J. The shape of boubas: sound-shape correspondences in toddlers and adults. Dev. Sci.
9, 316–322 (2006).
6. Nygaard, L. C., Cook, A. E. & Namy, L. L. Sound to meaning correspondences facilitate word learning. Cognition 112, 181–186
(2009).
7. Kovic, V., Plunkett, K. & Westermann, G. The shape of words in the brain. Cognition 114, 19–28 (2010).
8. Köhler, W. Gestalt Psychology 2nd edn. (Liveright, 1947).
9. Fryer, L., Freeman, J. & Pring, L. Touching words is not enough: how visual experience influences hapticauditory associations in
the ‘bouba-kiki’ effect. Cognition 132, 164–173 (2014).
10. Hamilton-Fletcher, G. et al. The role of visual experience in the emergence of cross-modal correspondences. Cognition 175, 114–121
(2018).
11. Sourav, S. et al. A protracted sensitive period regulates the development of cross-modal sound-shape associations in humans.
Psychol. Sci. 30, 1473–1482 (2019).
12. Gold, R. & Segal, O. The Bouba–Kiki Effect in persons with prelingual auditory deprivation. Lang. Learn. Dev. 16, 49–60 (2020).
13. Osaka, N. et al. An emotion-based facial expression word activates laughter module in the human brain: a functional magnetic
resonance imaging study. Neurosci. Lett. 340, 127–130 (2003).
14. Osaka, N., Osaka, M., Morishita, M., Kondo, H. & Fukuyama, H. A word expressing affective pain activates the anterior cingulate
cortex in the human brain: an fMRI study. Behav. Brain Res. 153, 123–127 (2004).
Scientific Reports | (2021) 11:7399 | https://doi.org/10.1038/s41598-021-86328-6 11
Vol.:(0123456789)You can also read