SIKKIM THE LAND OF PEACE AND TRANQUILITY - DO-DRUL CHORTEN STUPA IN GANGTOK, SIKKIM
←
→
Page content transcription
If your browser does not render page correctly, please read the page content below
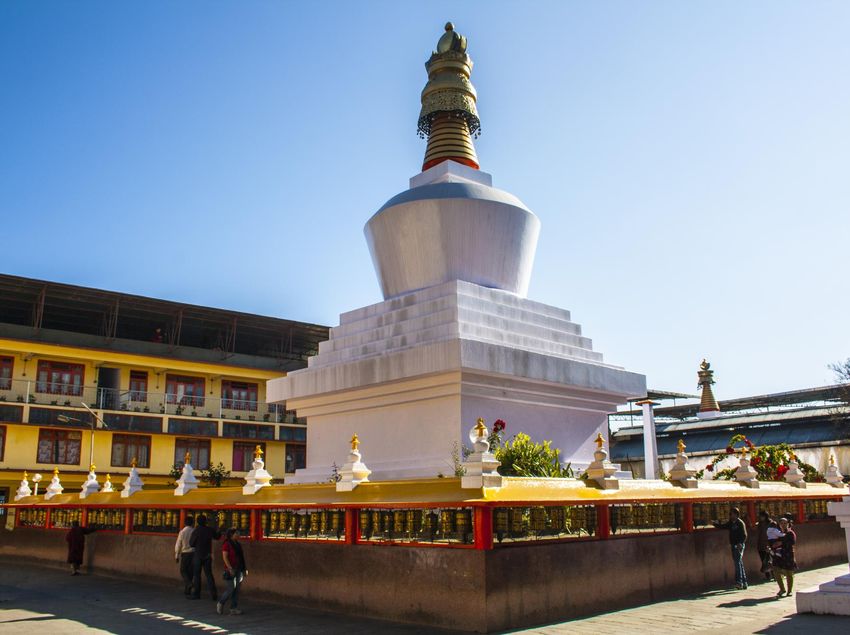
DO-DRUL CHORTEN STUPA IN GANGTOK, SIKKIM

 SIKKIM
 THE LAND OF PEACE AND TRANQUILITY

For updated information, please visit www.ibef.org                                  February 2019
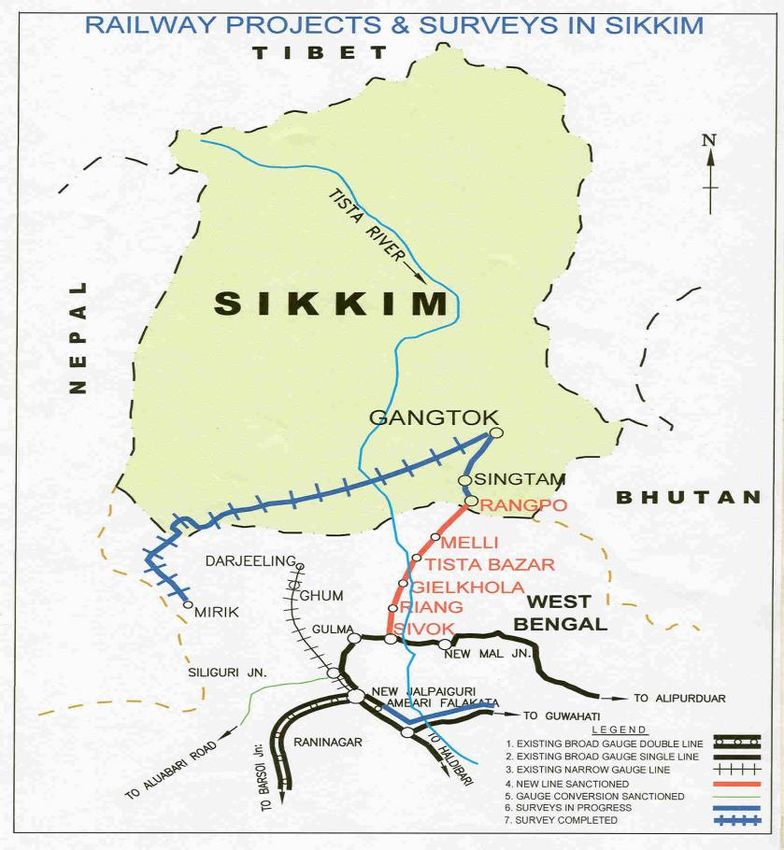
Table of Content

   Executive Summary .…………….…….…...3

   Introduction ……..………………………...…4

   Economic Snapshot ……………….….……9

   Physical Infrastructure ………..……..........15

   Social Infrastructure ..................................22

   Industrial Infrastructure ……..……….........26

  Key Sectors ………….………………..…...29

  Key Procedures & Policies………………...39

  Annexure.………….……..….......................44

EXECUTIVE SUMMARY
Sikkim is home to around 5,000 species of flowering plants, 515 rare orchids, 60 primula species & 36
Strong floriculture
rhododendron species. This makes it one of the leading states in the Northeast region in terms of production &
sector supply of cut flowers to mainland consumer markets.
Strong potential of Of the 6,000 medicinal plants in India, over 424 plants (including the famous Artemisia vulgaris that is used as
medicinal plants an antiseptic) are grown in Sikkim. Moreover, it is all set to be recognised and certified by the Government of
industry India under National Medicinal Plant Board (NMPB) proposed under the 12th Five Year Plan.
The state is considered as a huge cardamom epicentre of the world, producing around 80 per cent of large
Second-largest
cardamom in the country. Additionally, India is the world leader of the crop, producing over 50 per cent of the
producer of cardamom global yield.
Presence of world’s Sikkim has mighty snow-capped peaks including the Kanchenjunga, the world’s 3rd highest peak, which
third highest peak attracts a large number of tourists from across the globe.
The state's economy is largely agrarian, based on the terraced farming of rice & the cultivation of crops such
as maize, millet, wheat, barley, oranges, tea & cardamom.
Agrarian economy
Sikkim produces more cardamom than any other Indian state & is home to the largest cultivated area of
cardamom
Source: Ministry of Agriculture, Government of India
3 SIKKIM For updated information, please visit www.ibef.org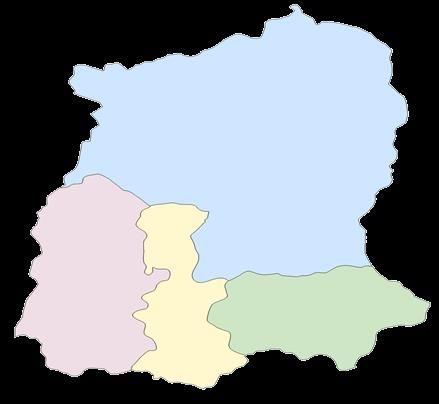
SIKKIM

INTRODUCTION
ADVANTAGE: SIKKIM
High economic growth and stable Conducive agro-climatic conditions
political environment
Sikkim’s GSDP grew at a Compound Annual Growth Sikkim has favourable agro-climatic conditions, which
Rate (CAGR) of 12.18 per cent between 2011-12 and support agriculture, horticulture & forestry; there is
2017-18. potential for development in related areas
Large production of cardamom and flowers has opened As per the state budget 2016-17, Sikkim got certified
up immense possibilities for the state economy. as the first fully organic state in India by the Central
Rail and air connectivity as well as optical-fibre Ministry of Agriculture and Farmers’ Welfare as well as
networks are being developed in the state. other recognized agencies of the country.
Advantage
Sikkim
Rich labour pool Policy and institutional
Sikkim has a high literacy rate of around 81.42 per support
cent.
The state has a skilled and educated labour force. The state follows the North East Industrial Investment
With the establishment of Sikkim Manipal University Promotion Policy, 2007, which provides several
and the Sikkim University, the quality and quantity of incentives and concessions for investment.
employable graduates in the state has steadily Institutional support is provided through various central
improved. & state government agencies viz., North East Council,
Skilled labour contributes in the modernization of the Ministry of Development of North Eastern Region &
state through the development of services sector. Commerce and Industries Department.
Source: Central Electricity Authority, GSDP: Gross State Domestic Product;
5 SIKKIM For updated information, please visit www.ibef.orgNORTH EAST REGION VISION 2020
Improving standard of living of
State government has set a target to
people in the region to meet the
grow GSDP by 9.5 per cent and per
national standard by 2020
capita GSDP by 8.3 per cent over the
Improving the quality and creating
period 2007-20.
state-of-art hospitals and
educational institutions
Encouraging public investment in Better governance and ensuring
infrastructure to attract private Quality of life of Growth rate in
peace and harmony through
investment. people GSDP1
maximising self governance and
Creating a centre for trade and increased people participation.
commerce through improving Promoting
investments Governance
relations with neighbouring
countries. Vision
2020
Encouraging HYV crops Industry Development of agro-processing
Agriculture
through better use of organic and sericulture industries.
manure, fertilisers and
Increase in investment in
pesticides. Infrastructure Tourism manufacturing units depending
Preventing soil erosion by upon the availability of resources
controlling floods. in the region.
Promoting cultivation of
horticulture crops.
Facilitating easy movement of Focusing and developing
goods and people by investing in services that would promote
road, rail, inland water and air tourism and create employment
transportation. opportunities in the states.
Source: NER Vision 2020, HYV: High Yielding Variety, 1GSDP is at fixed costs at 2006-07 prices
6 SIKKIM For updated information, please visit www.ibef.orgSIKKIM FACT FILE
Nepali, Bhutia, Lepcha, Limboo, Magar, Rai, Gurung, Sherpa,
Tamang, Newari & Sunuwar (Mukhia) are the commonly spoken
languages. Hindi & English are also widely spoken. Sikkim has 10
mountain peaks, 84 glaciers, 315 glacial lakes (including the
Tsomgo, Gurudongmar & Khecheopalri), 5 hot springs & 8 mountain
passes – making it an ideal tourist location. The Teesta & the
Rangeet are the 2 major rivers with nearly hundred tributaries.
Parameters Sikkim
Capital Gangtok
Geographical area (lakh sq. km) 7,096
Administrative districts (No) 4
Sikkim is surrounded by vast stretches of Tibetan Plateaus in the
north, the Chumbi Valley of Tibet & the Kingdom of Bhutan in the Population density (persons per sq. km) 86
east, the Kingdom of Nepal in the west & Darjeeling district of West
Total population (million) 0.61
Bengal in the south
Male population (million) 0.32
Sikkim has 4 districts – East Sikkim, West Sikkim, North Sikkim &
Female population (million) 0.29
South Sikkim. The district capitals are Gangtok, Gyalshing, Mangan
& Namchi respectively Sex ratio (females per 1,000 males) 890
Literacy rate (%) 81.42
Source: Sikkim State Portal, Census 2011
7 SIKKIM For updated information, please visit www.ibef.orgSIKKIM IN FIGURES
Sikkim’s Contribution to Indian Economy (2017-18) Physical Infrastructure in Sikkim
Parameter Sikkim India Parameter Sikkim India
GSDP as a percentage of all Installed power capacity
0.13 100.0 962.15 349,288.22
states’ GSDP (MW)
GSDP growth rate (%) 11.13 9.96 Wireless subscribers*
58,473,201 1,171,755,011
(No)
Per capita GSDP (US$) 5,286.32 1,977.60
Internet subscribers* (Mn) 22.62 560.01
Social Indicators
National highway length
463 131,326
Parameter Sikkim India (km)
Literacy rate (%) 81.42 73.0 Airport 1 129
Birth rate (per 1,000
16.6 20.4
population)
Industrial Infrastructure Investments (as of September 2018)
Parameter Sikkim India Parameter Sikkim India
Operational and Maintenance Cumulative FDI equity inflows
1 886 5.11** 398.44
stage since April 2000 (US$ billion)
Note: GSDP, per capita GSDP figures are taken at current prices
PPP -Public-Private Partnership, * - Including West Bengal, ** - Including West Bengal and Andaman and Nicobar
8 SIKKIM For updated information, please visit www.ibef.orgSIKKIM ECONOMIC SNAPSHOT
ECONOMIC SNAPSHOT – GSDP
GSDP of Sikkim at current prices GSDP per capita of Sikkim at current prices
CAGR (in Rs) 12.18% 6,000 CAGR (in Rs) 11.03% 3,60,000
4.00 0.25
3,30,000
3,40,703.11
3.50 5,000 3,00,000
5,286.32
3,09,435.29
0.22
0.20 2,70,000
3.45
2,81,780.35
4,612.24
3.00
0.20
4,000 2,40,000
4,304.62
2.98
2,43,392.12
0.18
3,980.25
2.50 2,10,000
2.75
3,792.32
2,21,082.97
0.15
3,654.26
3,648.97
2.52
0.15 3,000 1,80,000
1,98,686.32
2.33
2.29
2.27
2.00
1,81,841.97
0.14
1,50,000
0.12
0.10 2,000 1,20,000
0.11
1.50
90,000
1.00 1,000 60,000
0.05
0.50 30,000
0 0
0.00 0.00
2011-12
2012-13
2013-14
2014-15
2015-16
2016-17
2017-18
2011-12
2012-13
2013-14
2014-15
2015-16
2016-17
2017-18
US$ Rs
US$ billion Rs trillion
The state’s per capita GSDP was Rs 340,703.11 (US$
At current prices, Sikkim’s Gross State Domestic Product
5,286.32) in 2017-18 as compared to Rs 181,841.97 (US$
(GSDP) was Rs 0.22 trillion (US$ 3.45 billion) in 2017-18.
3,792.32) during 2011-12.
GSDP expanded at a CAGR of 12.18 per cent between 2011-
Per capita GSDP increased at a CAGR of 11.03 per cent
12 and 2017-18.
between 2011-12 and 2017-18.
Note: GSDP, per capita GSDP figures are taken at current prices, Exchange Rate as per slide 46, data expected to be updated from Ministry of Statistics and Programme Implementation in
March 2019
Source: Ministry of Statistics and Programme Implementation
10 SIKKIM For updated information, please visit www.ibef.orgECONOMIC SNAPSHOT – NSDP
NSDP of Sikkim at current prices NSDP per capita of Sikkim at current prices
3.50 CAGR (in Rs) 12.21% 0.25 5,000 CAGR (in Rs) 11.06% 3,50,000
4,500
4,620.09
3.00 3,00,000
0.20
3.02
4,000
2,97,764.72
4,032.97
2.50
0.19
2,50,000
2,70,572.21
3,500
3,757.83
2.61
0.18
2,45,987.42
3,502.00
2.41
0.15 3,000
3,309.02
2.00
3,216.93
2.22
3,198.95
0.16
2,00,000
2,14,147.51
2.03
2.02
1.99
2,500
1,94,624.07
0.14
1.50
0.12
1,74,182.75
0.10 2,000 1,50,000
1,58,667.38
0.11
0.10
1.00 1,500 1,00,000
0.05 1,000
0.50 50,000
500
0.00 0.00 0 0
2011-12
2012-13
2013-14
2014-15
2015-16
2016-17
2017-18
2011-12
2012-13
2013-14
2014-15
2015-16
2016-17
2017-18
US$ billion Rs trillion US$ Rs
Sikkim’s per capita NSDP was Rs 297,764.72 (US$ 4,620.09)
At current prices, Sikkim’s Net State Domestic Product (NSDP)
in 2017-18 as compared to Rs 158,667.38 (US$ 3,309.02)
was Rs 0.19 trillion (US$ 3.02 billion) during 2017-18.
during 2011-12.
NSDP of the state expanded at a CAGR of 12.21 per cent
Per capita NSDP of Sikkim increased at CAGR of 11.06 per
between 2011-12 and 2017-18.
cent between 2011-12 and 2017-18.
Note: GSDP, per capita GSDP figures are taken at current prices, Exchange Rate as per slide 46, data expected to be updated from Ministry of Statistics and Programme Implementation in
March 2019
Source: Ministry of Statistics and Programme Implementation
11 SIKKIM For updated information, please visit www.ibef.orgECONOMIC SNAPSHOT – PERCENTAGE
DISTRIBUTION OF GSVA
The overall performance of the economy of the state during 2017-18 Percentage distribution of GSVA
was encouraging.
100%
In 2017-18, the secondary sector contributed 59.38 per cent to the 28.82% CAGR 30.19%
90%
state’s GSVA at current prices. It was followed by the tertiary sector
at 30.19 per cent and primary sector at 10.43 per cent. 80% 12.67%
70%
At a CAGR of 16.04 per cent, the primary sector witnessed the 62.83% 59.38%
fastest growth among the three sectors between 2011-12 and 2017- 60%
18. The growth has been driven by livestock, mining and quarrying, 50%
fishing and aquaculture and crops subsectors.
10.76%
40%
The secondary sector grew at a CAGR of 10.76 per cent between 30%
2011-12 and 2017-18. The tertiary sector grew at a CAGR of 12.67
20%
per cent between 2011 and 2017-18.
10%
16.04% 10.43%
8.35%
0%
2011-12 2017-18
Primary Secondary Tertiary
Note: GSDP, per capita GSDP figures are taken at current prices, Exchange Rate as per slide 46, data expected to be updated from Ministry of Statistics and Programme Implementation in
March 2019
Source: Ministry of Statistics and Programme Implementation
12 SIKKIM For updated information, please visit www.ibef.orgECONOMIC SNAPSHOT – FDI INFLOWS &
INVESTMENTS
According to the Department of Industrial Policy & Promotion (DIPP), FDI inflows in Sikkim^
FDI inflows in Sikkim^ totalled US$ 5.11 billion between April 2000 April 2000 - September 2018 (in US$ million)
and September 2018.
5,500
Sikkim^ contributes around 1 per cent to the total FDI inflows of the 5,108
country. 5,000
Government of India has introduced North East Industrial
Development Scheme 2017 under which all new industrial units 4,500
located in eight north-eastern states in manufacturing and services
4,000 905
sector of the state will be eligible for various incentives.
218
49
3,500
3,000
239 955
2,500
436
2,000
424
1,488
1,500
394
1,000
2011-12
2012-13
2013-14
2014-15
2015-16
2016-17
2017-18
FY01-FY19*
FY01-FY11
2018-19*
Note: ^Including West Bengal and Andaman & Nicobar Islands, *up to September 2018
Source: Department of Industrial Policy & Promotion (DIPP)
13 SIKKIM For updated information, please visit www.ibef.orgECONOMIC SNAPSHOT – EXPORT TRENDS
Merchandise Exports from Sikkim (US$ million) Principal Commodities Exported in 2018-19*
16.00 Drug Formulations,
Biologicals
14.00
13.96 Cereal Preparations
12.00 25%
26%
10.00 Petroleum Products
8.00
Medical and Scientific
6.00 6% Instruments
6.13
4.00 4.91 Miscelaneous Processed
15%
3.91 8% items
2.00 2.93
9% 10% Cement, Clinker and
0.00 Asbtos cement
2014-15
2015-16
2016-17
2017-18
2018-19*
Others
Merchandise exports from Sikkim have increased from US$ 3.91 million in 2014-15 to US$ 13.96 million in 2017-18. During 2018-19*, the exports
stood at US$ 6.13 million from the state.
Drug Formulations and Biologicals are the largest export items from the state, accounting for nearly 26 per cent of total exports in 2018-19*,
followed by Cereal Preparations (15 per cent) and Petroleum products (10 per cent).
Note: * - Upto December 2018
Source: DGCIS Analytics
14 SIKKIM For updated information, please visit www.ibef.orgSIKKIM PHYSICAL INFRASTRUCTURE
PHYSICAL INFRASTRUCTURE – ROADS
Sikkim had a total road network of 2,425.45 km. The state is Road type Length (km) (2016-17)
connected to West Bengal & the rest of India through National National highways (NH)
463
(November 2018)
Highway (NH)-31A. The Sikkim Nationalised Transport (SNT)
State highways 701.09
operates 114 buses (covering 43 routes), 64 trucks & 33 tankers
across the state. As per budget 2018-19, more than 2,977 km new District roads* 1,080.85
roads have been constructed since 1994.
Other district roads* 334.51
Bus/truck terminus will be constructed at all district headquarters &
other major stations. 600 km of major district roads to be made
Fund Allocation and Expenditure
intermediate lane & efforts to black topped with permanent bridges.
CRF (US$ million) EI & ISC (US$ million)
The state government proposed an allocation of Rs. 278.59 crore
Allocation Expenditure Accrual Expenditure
(US$ 43.23 million) for roads and bridges department during 2018-
19. 2014-15 0.77 0.24 NA NA
The state government has proposed a vision for the development of 2015-16 0.79 NA NA NA
roads and bridges until 2020.
2016-17 1.96 1.40 NA NA
2017-18 1.88 1.25 0.98 1.09
Note: NA – Data not available.*as of 2015-16, data is expected to be updated from Sikkim Economic Survey 2018-19
Source: Public Works Roads and Bridges Department, Government of Sikkim, mhupa.gov.in, Ministry of Road Transport & Highways
16 SIKKIM For updated information, please visit www.ibef.orgPHYSICAL INFRASTRUCTURE – RAILWAYS
Indian Railway Construction Company approved the construction of
rail connectivity between Sevoke in West Bengal to Rangpo in
Sikkim.
Total length of rail track between Savor and Rangoon will be 52.7
km. Rail connectivity between Rangpo-Siliguri is also under
construction.
As of May 2018, Indian Railways has planned several projects worth
of Rs 40,000 crore (US$ 6.21 billion) which will involve construction
of rail links connecting capital cities of northeast states such as
Manipur, Mizoram, Meghalaya, Sikkim and Nagaland.
Source: North-East Region Rail Infrastructure presentation; Ministry of Railways, Sikkim Times, June 2013, Assorted news articles
17 SIKKIM For updated information, please visit www.ibef.orgPHYSICAL INFRASTRUCTURE – AIRPORTS
In September 2018, Prime Minister of India inaugurated Pakyong airport in Sikkim, the state’s first airport, which is expected to significantly boost
the state’s connectivity. In 2018-19*, passenger and aircraft moments reached 10,007 and 164, respectively.
The greenfield airport has been constructed by Airports Authority of India over 201 acres of area at an estimated cost of Rs 605 crore (US$ 90.24
million). It is located around 30 km from the state’s capital - Gangtok.
Spicejet will be operating flights from the airport under Government of India’s Ude Desh Ka Aam Nagrik (UDAN) regional connectivity scheme.
Spicejet operated Sikkim’s first commercial flight from Pakyong to Kolkata on October 04, 2018.
The airport has a capacity to handle 50 in-bound and 50 out-bound passengers. It is expected to handle over 0.5 million passengers per annum
(mppa).
Note: NA – Not available.*- between April-December 2018
Source: Public Works Roads and Bridges Department, Government of Sikkim, mhupa.gov.in, Ministry of Road Transport & Highways
18 SIKKIM For updated information, please visit www.ibef.orgPHYSICAL INFRASTRUCTURE – POWER
As of December 2018, Sikkim had a total installed power generation Installed power capacity (MW)
capacity of 962.15 MW, of which 151.03 MW was under central
1200.00
utilities, 399.01 MW was under private utilities & 412.11 MW was
1000.00
under state utilities. Of the overall installed power generation
962.14
962.15
800.00
414.48
capacity in the state, thermal power contributed 87.03 MW, while
305.50
323.48
314.00
758.14
600.00
206.40
hydropower and renewable power contributed 823 MW & 52.12 MW,
400.00
respectively. 200.00
0.00
Power generation in the state reached 8,112 GWH during Apr-Nov
2015-16
2011-12
2012-13
2013-14
2014-15
2016-17
2017-18
2018-19*
2018. All villages of the state have been electrified.
Sarda Energy and Minerals Limited (SEML) plans to add
hydroelectric capacity of over 125 MW over the upcoming 2-3 years Hydro Electric Potential Development Status (in terms of
in Sikkim and Chhattisgarh. Installed capacity (in MW)) (December 2018)
Total Identified capacity (above 25 MW) 4,248
Capacity under operation 2,169
Capacity under construction 1,133
Schemes allotted by the state for
55,709
development
Note: * As of December 2018, MW – Megawatt, GWH – Gigawatt Hour
Source: Central Electricity Authority
19 SIKKIM For updated information, please visit www.ibef.orgPHYSICAL INFRASTRUCTURE – TELECOM
The state* recorded tele-density of 89.16 per cent in November Telecom Infrastructure (As of November 2018)
2018.
Wireless subscribers* 58,473,201
Virtual Private Network (VPN) and 3G-services are available in the
state. Wireline subscribers* 249,683
Forty five common service centres have been constructed across the Internet subscribers*^ (in million) 22.62
state. The centres provide an internet-based interface for
Source: Telecom Regulatory Authority of India
implementing various government programmes and schemes.
Vodafone launched its services in Lachung as the first private
Major telecom operators in Sikkim Vodafone Idea
telecom operator in the region. With this expansion, it has now
Bharat Sanchar Nigam Limited
covered more than 91 per cent of population in Sikkim.
(BSNL)
Postal services are available through India Post and other private Bharti Airtel
courier services.
Note: *Includes West Bengal, ^As of September 2018
Source: Telecom Regulatory Authority of India
20 SIKKIM For updated information, please visit www.ibef.orgPHYSICAL INFRASTRUCTURE – URBAN
To extend financial support to the state government and to provide Classification of AMRUT Cities in Sikkim (Funds allocated,
water supply facilities in towns having population less than 20,000,
committed and sanctioned by central) (US$ million)
the centrally sponsored Accelerated Urban Water Supply Total
Committed Sanctioned
Programme (AUWSP) was launched that has been merged with Allocation
Urban Infrastructure Development Scheme for Small and Medium Fund under AMRUT
5.55 5.00 1.55
Program^
Towns (UIDSSMT).
Total number of
1
Under this, US$ 8.7 million has been allocated for development of AMRUT cities
water supply systems and sewerage in Mangan, Namchi, Jorethang,
Melli and Rangpo. The Sikkim Water Security & Public Health
Engineering Department (WS & PHED) provides water supply to Funds Sanctioned to Sikkim under Asian Development Bank
Gangtok, six major notified towns, 41 other urban towns and 92 assistance to improve urban services (US$ million)
notified rural marketing centres.
Funds sanctioned (US$
Year
million)
As per state budget 2018-19, out of 736 Home stay sanctioned
earlier, more than 90 per cent have been completed and made 2014-15 3.35
operational. All eligible habitation as per 2001 census in the state
shall be connected by PMGSY roads by the year 2019. 2015-16 2.10
The total budget allocation for urban development and housing 2016-17 2.09
during 2018-19 is Rs. 136.23 crore (US$ 21.14 million).
2017-18* 1.18
Note: 2017-18* - Up to November 2017, ^ Status as of January 04, 2019
Source: Ministry of Urban Development, Government of India
21 SIKKIM For updated information, please visit www.ibef.orgSIKKIM SOCIAL INFRASTRUCTURE
SOCIAL INFRASTRUCTURE – EDUCATION
Sikkim has a literacy rate of 81.42 per cent; the male and female Funds released for Primary Education (US$ million)
literacy rates were 86.55 per cent and 75.61 per cent, respectively.
8.00
The Sikkim Manipal University (SMU), a partnership between the
7.00
Government of Sikkim and Manipal Education and Medical Group
7.02
6.00
6.49
6.29
(MEMG), provides technical, healthcare and science education. It is 5.00
5.40
rated as one of the top universities in the country. 4.00
1.61
1.55
1.40
3.00
1.08
Sikkim is the first state to partner with United Nation Educational and 2.00
Scientific Organization (UNESCO) MGIEP (Mahatma Gandhi 1.00
0.00
Institution of Education for Peace and Sustainable Development) for *
2014-15
2015-16
2016-17
2017-18
implementation of Sustainable Development Goal (SDG) in Primary
Text Books.
As of 2017-18, enrolment in higher education in the state stood at MDM Scheme SSA Programme
29,000 students.
Literacy rates (%)
Literacy rate 81.42
Male literacy 86.55
Female literacy 75.61
Note: * As of December 2017
Source: NEDFI Databank;, Budget 2017-18
23 SIKKIM For updated information, please visit www.ibef.orgSOCIAL INFRASTRUCTURE – HEALTH … (1/2)
Sikkim has an impressive health infrastructure, one of the best in the Health infrastructure (as of February 07, 2019)
country. The state has witnessed declining critical health indicators Sub centres 197
such as disease prevalence, mortality rates, morbidity, etc. over the Primary health centres 28
past years.
Community health centres 2
Health tourism is being promoted in the state to utilise its medical District hospitals 5
infrastructure and boost the economy. The state had 28 primary Sub district hospitals 1
health centres, 197 sub-centres, two community health centres and Source: Ministry of Health & Family Welfare, NHRM
five district hospitals as of February 07, 2019.
The Department of Health and Family Welfare is instrumental and
Health indicators (2016)
responsible for implementation of various national programs in the
Birth rate (per thousand persons) 16.6
areas of health and family welfare as well as prevention and control
of communicable diseases in the state. Death rate (per thousand persons) 4.7
Sir Thutob Namgyal Memorial (STNM) Hospital has introduced latest Infant mortality rate (per thousand live births) 16
technology for Laparoscopic Machine in surgery department. Now
onwards patients will be able to undertake medical treatment of
various cases like hernia, gallbladder stone and appendix with
advanced techniques and innovative methodology.
Source: Central Bureau of Health Intelligence, Government of India, Sample Registration System (SRS) Bulletin, NHRM
24 SIKKIM For updated information, please visit www.ibef.orgSOCIAL INFRASTRUCTURE – HEALTH … (2/2)
As per the Budget 2018-19, Drug Testing Laboratory is being constructed at Chuwatar at a cost of Rs. 880 Lakh (US$ 1.37 million).
As per the new Budget, Tuberculosis hospitals at Gyalshing and Mangan and Blood Bank at Mangan will be completed in FY2018-19.
Construction of new district hospitals at Mangan at a cost of Rs. 20 crore (US$ 3.10 million) has been initiated.
Sikkim government is also setting up Sowa Rigpa at National Institute of Tibetology, Deorali at a cost of Rs. 10.50 crore (US$ 1.63 million).
Government of Sikkim would provide free health care services with various improvements in infrastructure and improvised provision of complete
health services. Moreover, government is coming up with 1,000 bedded multi-specialty hospital.
Source: Central Bureau of Health Intelligence, Government of India, State Budget 2016-17
25 SIKKIM For updated information, please visit www.ibef.orgSIKKIM INDUSTRIAL INFRASTRUCTURE
INDUSTRIAL INFRASTRUCTURE… (1/2)
Brewing, distilling, tanning and watchmaking are the main industries Prime Minister's Employment Generation Programme (PMEGP)
Schemes, fund allocation and utilisation in Sikkim
located in the southern regions of Sikkim.
Allocated (US$ Utilized (US$ Employment
A small mining industry exists in the state, extracting minerals such Year
million) million) generated
as copper, dolomite, talc, graphite, quartzite, coal, zinc and lead.
2014-15 0.84 0.05 54
Sikkim has identified Rangpo-Gangtok, Melli-Jorethang, Jorethang-
Rishi & Ranipool-Gangtok as industrial corridors with provision for 2015-16 0.35 0.29 397
giving land to investors on a lease basis.
2016-17 0.13 0.06 201
Sikkim is a leading north-eastern state in hydroelectric power
development with 28 different projects identified under PPP mode. 2017-18* 0.31 0.04 168
The units that are engaged in the manufacturing sector are mainly Sikkim has identified agro-based industries, horticulture & floriculture,
dealing with pharmaceuticals, chemicals, liquors, foam mattresses, minor forest-based industries, animal husbandry & dairy products,
food products, iron rods, etc. tourism-related industries, IT including knowledge-based industries,
precision oriented high value-low volume products, hydro-power, tea,
education and hospitality as thrust sectors.
The Information Technology (IT) Department, Government of Sikkim
is in the process of setting up a state-of-the-art IT Park and National
Institute of Electronics and Information Technology (NIELIT) at
Note: * As on January 2018
Pakyong.
27 SIKKIM For updated information, please visit www.ibef.orgINDUSTRIAL INFRASTRUCTURE… (2/2)
Smart cities in Sikkim
Cities Population Literacy Rate
Namchi 12,190 88.10%
Gangtok 100,286 89.33%
The central government announced plans to develop Namchi and
Gangtok as two of the 100 smart cities in India.
From the state of Sikkim, Gangtok has been included under AMRUT
(Atal Mission for Rejuvenation and Urban Transformation).
Gangtok
Namchi
28 SIKKIM For updated information, please visit www.ibef.orgSIKKIM KEY SECTORS Agro & Food Processing and Horticulture Tourism Floriculture & Sericulture Pharmaceuticals
KEY SECTORS – AGRO & FOOD PROCESSING AND
HORTICULTURE… (1/3)
Production of vegetables (in ‘000 MT) Production of fruits (in ‘000 MT)
250.0 30
200.0 25
214.6
27.0
25.8
25.6
190.7
24.1
150.0
24
20
23.5
22.5
147.7
19.7
15
18.5
134.5
100.0
132.5
130.1
127.7
121.0
106.9
98.0
15.7
50.0 10
5
0.0
0
2016-17
2008-09
2009-10
2010-11
2011-12
2012-13
2013-14
2015-16
2017-18P
2014-15
2008-09
2009-10
2010-11
2011-12
2012-13
2013-14
2015-16
2016-17
2017-18P
2014-15
Agriculture is vital to the progress of Sikkim as more than 64 per cent of the population depends on it for their livelihoods. The Sikkim AGRISNET
is an internet-based agriculture information centre to promote scientific agricultural methods and convert research into practice in the agricultural
sector.
Sikkim has a suitable climate for agricultural and horticultural products. It supports multiple crops; viz., rice, wheat, maize, millet, barley, urad, pea,
soya bean, mustard and large cardamom.
The surveyed arable land in Sikkim is 109,000 ha, of which only 9.5 per cent is used; this provides a vast untapped potential for development.
The state government is also laying emphasis on improving organic farming in the state. The state was certified as the first fully organic state in
India, by the Central Ministry of Agriculture and Farmers’ Welfare as well as other recognized agencies of the country.
There are large areas of fallow land available, having the potential to be converted into productive farms for cash crops. Egg production in the
state stood at 63.28 lakh units in 2017-18. Meat production in the state was recorded at 4.40 thousand tonnes in 2017-18. Milk production in the
state increased to 4.40 thousand tonnes in 2017-18.
Note: MT: Metric Tonnes, P - Provisional
Source: Indian Horticulture Database 2014-National Horticulture Board, Department of Agriculture Cooperation and Farmers Welfare
30 SIKKIM For updated information, please visit www.ibef.orgKEY SECTORS – AGRO & FOOD PROCESSING AND
HORTICULTURE… (2/3)
Crop Production – 2017-18 (‘000 tones)
The primary sector contributed around 9.05 per cent to Sikkim’s
Fruits 26.97P
GSDP in 2016-17. Agriculture provides livelihood to more than 64
Vegetables 214.61P
per cent of the people of Sikkim, either directly or indirectly. Sikkim is
Flowers 16.59
the top producer of large cardamom, contributing over 80 per cent to Spices 67.14
India’s total production.
Sector Allocation (2018-19) (US$ million)
The area under production for fruits and vegetables during 2017-18 Crop husbandry 24.30
was 18,330 hectares and 25,540 hectares respectively Soil & water conservation 2.40
Animal husbandry 9.22
The state government is targeting to launch new agricultural
Dairy development 0.12
schemes for making farming more profitable and allowing the youth
Fisheries 0.93
to determine agriculture as a budding source of livelihood.
Implementation of such schemes is expected to result in increase in Forestry & wild life 19.28
the area utilization for the cultivation & production of various crops. Plantations 1.36
The state government is also laying emphasis on improving organic Food, storage & warehousing 2.94
farming in the state. Cooperation 2.62
Other agricultural programmes 4.25
As per budget 2018-19, allocation of Rs. 484.52 crore (US$ 67.42
million) is made for the development of the agriculture & allied Budget 2018-19 states that total vegetables requirement to feed the
services sector. Sikkim will become self sufficient in terms of food entire population of the sate (Including tourist and floating population)
grains production within next 5 years. is 95,000 metric tonnes per annum
Note: Exchange rate as per slide number 46, P – Provisional
Source: ENVIS Centre: Sikkim Annual Report; Sikkim Agrisnet; Spices Board, State Budget 2018-19, Department of Agriculture Cooperation and farmers Welfare
31 SIKKIM For updated information, please visit www.ibef.orgKEY SECTORS – AGRO & FOOD PROCESSING AND
HORTICULTURE… (3/3)
Allocation to Krishi Vigyan Kendras (in US$ ‘000) Allocation under PKVY scheme (in US$ ‘000)
760 1600.00
740 1400.00
1,472.1
720
738
700 1200.00
680 1000.00
1,013.5
660 800.00
666
640 600.00
653
620
614.2
400.00
627
600
580 200.00
560 0.00
2014-15
2015-16
2016-17
2017-18
2015-16
2016-17
2017-18
In 2003, the state government took the decision to become a fully organic state through a declaration in the legislative assembly. In January 2016,
Sikkim became the first fully organic state in India. Around 75,000 hectares of agricultural land in the state was gradually converted to certified
organic land by implementing practices and principles as per guidelines laid down in National Programme for Organic Production.
The Indian Council of Agricultural Research (ICAR) has established three Krishi Vigyan Kendras (KVKs) in Sikkim to impart training to farmers in
various aspects of agriculture including organic farming
Paramparagat Krishi Vikas Yojana (PKVY) is a sub-scheme under National Mission of Sustainable Agriculture (NMSA) through which assistance
is provided for Organic Farming clusters. The state has around 150 clusters and the government plans to develop 200 more clusters in 2017-18.
State Irrigation Plan (SIP) for the period of 5 years from 2017-18 to 2021-22 has been approved to surface minor irrigation and Repair,
Restoration and Renovation (RRR) of existing water bodies to support Sikkim Organic Mission.
Source: Ministry of Agriculture and Family Welfare.
32 SIKKIM For updated information, please visit www.ibef.orgKEY SECTORS – TOURISM… (1/2)
Foreign tourists arrivals in Sikkim (in ‘000) Domestic tourists arrival in Sikkim (in ‘000)
70.0
1600
60.0
66.0
1400
50.0
1376
1200
49.2
49.1
40.0 1000
38.5
30.0 800
31.7
741
600
705
26.5
700
20.0
23.9
616
577
20.8
562
559
552
400
19.2
16.5
18.0
17.8
17.7
512
485
10.0
422
348
200
0.0
0
2005
2006
2007
2008
2009
2010
2011
2012
2013
2014
2015
2016
2017
2005
2006
2007
2008
2009
2010
2011
2012
2013
2014
2015
2016
2017
An extraordinary increase in the number of tourists in the state has been witnessed over the past few years owing to the efforts that the state
government is making for promoting tourism in the state.
Sikkim is setting up a fossil park in Mamley (south Sikkim), where rare one billion-year-old Stromatolite fossils occur. GSI plans to set up a
geological museum in Sikkim, displaying fossils, rock samples, etc., from various parts of India. This would attract palaeontology enthusiasts
across the world.
Tourist arrival (domestic and foreign tourist) in the state has increased from 99,000 in 1994 to more than 1.4 million in 2017.
The newly constructed Pakyong airport is expected to provide a significant boost to tourism in the state.
Source: Ministry of Tourism- Government of India, Sikkim Tourism, Government of Sikkim
33 SIKKIM For updated information, please visit www.ibef.orgKEY SECTORS – TOURISM… (2/2)
Tourism in Sikkim has emerged as the new profession of the Sikkimese people with its vast natural potential. Promotion of village tourism,
homestay, cultural tourism, trekking tourism, ecotourism, wellness tourism, flori–tourism and adventure tourism has given fillip to the tourism trade
in the state where a large of number of people are engaged under different employment opportunities.
Sikkim has been featured and ranked 17th in the New York Times “52 best places to go in 2017”.
The government is aiming at developing a number of tourist infrastructures in the state so as to provide the tourists with village tourism, nature
tourism, culture tourism, etc.
Sikkim has the perfect blend of natural wealth and topography, which ranges from tropical to temperate to alpine. The state is richly endowed with
thick forests, flora and fauna, lakes, glaciers and mountain peaks, which makes it a tourist paradise.
Creation of tourist complexes, ecotourism, adventure tourism, ethnic-culture tourism, health farms, hotels, convention centres, tourist travel
services, etc., are various avenues for investment in the tourism sector.
Cho-Lhamu lake situated in Sikkim is the highest lake in the country and sixth highest in the world. It is expected that recognition of this lake will
boost tourism in the state.
During 2018-19, an allocation of Rs. 96.99 crore (US$ 15.05 million) is made for the tourism and civil aviation departments.
Ministry of Tourism, Government of India, awarded the capital city of Sikkim, Gangtok, with the title of 'Cleanest Tourist Destination' in the country.
Source: Department of Tourism, Government of Sikkim, state budget 2018-19
34 SIKKIM For updated information, please visit www.ibef.orgKEY SECTORS – FLORICULTURE & SERICULTURE…
(1/2)
Sikkim's geographical & environmental conditions are quite conducive for development of floriculture at a higher altitude. The state is also
considered to be the Kingdom of flowers and is an innovator in cultivating Gladiolus.
Sikkim is the natural home to more than 600 different types of orchids, over 100 primulas & rhododendrons. A number of cut flowers & bulbs are
supplied by the farmers to areas in Delhi, Kolkata, Kalimpong, Uttaranchal & Bihar.
The existing industry is at a nascent stage & has the potential to be developed & promoted towards an export-oriented business. The Sikkim
government has announced a technical collaboration with floriculturists from the Netherlands & Thailand to develop the state’s potential in
floriculture & market cut flowers from the state globally.
Sikkim’s most important commercial flowers are Cymbidium Orchids, Gladiolus, Carnation, Gerbera, Asiatic, Oriental Lilies & Anthurium, among
others, that can be grown for domestic & export markets.
During 2017-18, production of cut flowers & loose flowers in the state is expected to reach 0.09 thousand metric tonnes and 16.50 thousand metric
tonnes, respectively.
During the year 2017-18 total funds allocated under National Horticulture Mission For North Eastern Himalayan States for the promotion of
horticulture were Rs 35,330 crores (US$ 5.45 billion) of which Sikkim has been allocated Rs 3,050 crores (US$ 470.86 million).
Source: Indian Horticulture Database 2014-National Horticulture Board
35 SIKKIM For updated information, please visit www.ibef.orgKEY SECTORS – FLORICULTURE & SERICULTURE…
(2/2)
Mulberry, muga, eri, oak-tussar & silk are cultivated in Sikkim. Raw silk production in Sikkim (million tonnes)
The Sericulture Directorate is responsible for development of Year Production
sericulture in Sikkim. The Directorate is maintaining three sericulture
2013-14 0.20
farms, one each in east, south & west district.
2014-15 8
Forest Department has two sericulture farms, one at Rorathang (east
2015-16 6
Sikkim) and the other at Mamring & Namthang (south district).
2016-17 9
The sericulture potentiality of Sikkim state has been explored jointly
2017-18 0.001
by the State Department & Central Silk Board, through launching a
2018-19* 3
flagship programme titled Catalytic Development Programme.
Over the years with consorted efforts from the both ends (state &
central governments), considerable success have been achieved by
the state sericulture industry in generating employment.
Note: * - target between April-September 2018
Source: Central Silk Board, Directorate of Sericulture, Sikkim
36 SIKKIM For updated information, please visit www.ibef.orgKEY SECTORS – PHARMACEUTICALS… (1/2)
Pharmaceutical is an emerging industry in Sikkim due to tax Export of drug formulations, biologicals
incentives offered by the state government as well as low (US$ ‘000)
manufacturing and labour costs. Sikkim is home to 14 major pharma 10000.00 9,330.0
companies, which have significant investments in the state. These 9000.00
include Cipla, Sun Pharma, Zydus Cadila, Alembic, IPCA, Alkem Lab, 8000.00
Intas Pharma, Torrent Pharma & Unichem. 7000.00
6000.00
The North-East Industrial Development Scheme, 2017 is highly
beneficial for pharmaceutical investments in Sikkim. Some of the 5000.00
policy incentives provided under the scheme are: 4000.00
3000.00
• New industrial units are provided Central Capital Investment 1,840.0
2000.00 1,590.0
Incentive for Access to Credit (CCIIAC) at 30 per cent of 860.0
1000.00 460.0
investment in plant and machinery with an upper limit of Rs 5 crore
0.00
(US$ 0.75 million).
2014-15
2015-16
2016-17
2017-18
2018-19*
• Industrial units set up under the scheme are allowed to claim
reimbursement of central share of income tax for the first five
years of operations During 2017-18, drug formulation and biological exports from the
state stood at US$ 9.33 million. The exports stood at US$ 1.59
• New industrial units can claim reimbursement of Goods and
million during 2018-19*
Services Tax (GST) paid on finished products manufactured in the
state up to the extent of Central GST and Integrated GST for a Note: * - Upto December 2018
Source: Sikkim Human Development Report 2014, North-East industrial
period of five years from date of commencement of production. Development Scheme 2017, News articles, DGCIS Analytics
37 SIKKIM For updated information, please visit www.ibef.orgKEY SECTORS – PHARMACEUTICALS… (2/2)
Cipla is one of the world’s largest generic pharmaceutical companies with presence in over 170 countries. It
exports raw materials, intermediates, prescription drugs, over the counter (OTC) & veterinary products, among
others.
The Cipla has 2 plants locations in Rangpo and Rorathang in the state.
Cipla
India-based Sun Pharmaceutical Industries Limited is a global pharmaceutical company headquartered in
Mumbai, Maharashtra. It manufactures and sells pharmaceutical formulations and Active Pharmaceutical
Ingredients (APIs) mainly in India and the US.
The company offers formulations in therapeutic areas such as cardiology, psychiatry, neurology, gastroenterology
and diabetology. There are 13,000 employees in the company.
Sun Pharmaceutical
industries limited
India-based Cadila Healthcare is a pharmaceutical company headquartered in Ahmedabad, Gujarat. It is the 5th
largest pharmaceutical company in India & is a significant manufacturer of generic drugs. The company has a
workforce of 13,181 employees worldwide.
Cadila Healthcare has global operations in four continents spread across the US, Europe, Japan, Brazil, South
Africa & 25 other emerging markets.
Zydus Cadila
38 SIKKIM For updated information, please visit www.ibef.orgSIKKIM KEY PROCEDURES & POLICIES
KEY APPROVALS REQUIRED

     List of approvals and clearances required                                                           Department

     Incorporation of company                                                                       Registrar of Companies

     Registration, Industrial Entrepreneurs Memorandum, industrial licences

     Permission for land use                                                                 Commerce and Industries Department

     Allotment of land

     Site environmental approval
                                                                                                 Sikkim Pollution Control Board
     No-objection Certificate and consent under Water and Pollution Control Act

     Registration under States Sales Tax Act and Central and State Excise Act
                                                                                  Excise Department, Sales Tax Department, Commercial Taxes
                                                                                      Division, Finance, Revenue & Expenditure Department
     Commercial taxes

     Sanction of power

     Power feasibility                                                                          Energy and Power Department

     Power connection

     Approval for construction activity and building plan                           Building & Housing Department, Public Works Department

     Water and sewerage clearance
                                                                                     Water Security & Public Health Engineering Department
     Water connection

40     SIKKIM                                                                                For updated information, please visit www.ibef.org
CONTACT LIST
Agency Contact information
Government of Sikkim
Gangtok-737101, Sikkim
Commerce and Industries Department Phone: 91-3592-202 670
Website: sikkimindustries.gov.in
E-mail: industriesdept@yahoo.co.in
Energy & Power Department
Gangtok, Sikkim
Energy and Power Department
Website: www.sikkimpower.org
E-mail: pbsubba@sikkimpower.org
Bhanu Path,
Gangtok-737103, Sikkim
Sikkim Industrial Development & Investment Corporation Limited Phone: 91-3592-202287, 202637, 209622,
(SIDICO) Fax: 91-3592-202287
Website: www.sidico.org
E-mail: mdsidico@rediffmail.com
Director, D.H.H, Gangtok
Directorate of Handloom and Handicrafts East Sikkim
Phone: 91-3592-203 126/202 926
41 SIKKIM For updated information, please visit www.ibef.orgCOST OF DOING BUSINESS IN SIKKIM
Cost parameter Cost estimate Source
Hotel costs US$ 30-150 per room per night Industry sources
Office space rent (2,000 sq ft) US$ 500-2,500 per month Industry sources
Residential space rent (2,000 sq ft) US$ 100-500 per month Industry sources
Unskilled: US$ 1.8 Ministry of Labour and Employment,
Labour cost (minimum wages per day)
Skilled: US$ 2.8 Government of India
42 SIKKIM For updated information, please visit www.ibef.orgSTATE ACTS & POLICIES
Objectives
To develop tourism as a key sector in Sikkim’s economy.
Sikkim Tourism Policy
To promote low impact sustainable tourism for the state.
2018
Read more
To make Sikkim a prime round the year destination for nature, adventure and culture based tourism
To establish Sikkim as an ultimate and unique ecotourism destination, offering memorable and high quality learning
Sikkim Ecotourism Policy experiences to visitors to contribute to poverty alleviation and promote nature conservation.
2011
To promote ecotourism in a sustainable manner based on the Global Sustainable Tourism Criteria. Read more
To make the state’s farming more respectable, sustainable as well as remunerative.
Sikkim Policy on Organic
To extend the conserved traditional agricultural knowledge in the state.
Farming 2010 Read more
To minimize the use of agrochemicals as well as other hazardous materials in various agro-based plants.
North East Industrial To promote industrialisation in the states in the North Eastern Region
Development Scheme
2017 To improve productivity in government departments through computerisation. Read more
IT Policy of Sikkim 2006 To promote the Northeast as an attractive investment destination through several concessions and incentives.
Read more
43 SIKKIM For updated information, please visit www.ibef.orgSIKKIM ANNEXURE
ANNEXURE…(1/2) - SOURCES

                          Data                                                     Sources

     GSDP (state)                                              Directorate of Economics and Statistics of Sikkim

     Per capita GSDP figures                                   Directorate of Economics and Statistics of Sikkim

     GSDP (India)                                              Ministry of Statistics and Program Implementation

     Installed power capacity (MW)                             Central Electricity Authority, as of December 2018

     Wireless subscribers (No)                           Telecom Regulatory Authority of India, as of November 2018

     Internet subscribers (Mn)                           Telecom Regulatory Authority of India, as of September 2018

     National highway length (km)                        NHAI, Roads and Building Department - Government of India

     Literacy rate (%)                                                           Census 2011

     Birth rate (per 1,000 population)                                  SRS Bulletin, September 2017

     Cumulative FDI equity inflows (US$ billion)   Department of Industrial Policy & Promotion, April 2000 to September 2018

     Operational PPP projects (No)                                 Ministry of Finance, Government of India

45      SIKKIM                                                                      For updated information, please visit www.ibef.org
ANNEXURE…(2/2) - EXCHANGE RATES
Exchange Rates (Fiscal Year) Exchange Rates (Calendar Year)
Year INR INR Equivalent of one US$ Year INR Equivalent of one US$
2004–05 44.95 2005 44.11
2005–06 44.28
2006 45.33
2006–07 45.29
2007 41.29
2007–08 40.24
2008–09 45.91 2008 43.42
2009–10 47.42 2009 48.35
2010–11 45.58 2010 45.74
2011–12 47.95
2011 46.67
2012–13 54.45
2012 53.49
2013–14 60.50
2014-15 61.15 2013 58.63
2015-16 65.46 2014 61.03
2016-17 67.09 2015 64.15
2017-18 64.45
2016 67.21
Q1 2018-19 67.04
2017 65.12
Q2 2018-19 70.18
Q3 2018-19 72.15 2018 68.36
Source: Reserve bank of India, Average for the year
46 SIKKIM For updated information, please visit www.ibef.orgDISCLAIMER
India Brand Equity Foundation (IBEF) engaged Aranca to prepare this presentation and the same has been prepared by Aranca in consultation with
IBEF.
All rights reserved. All copyright in this presentation and related works is solely and exclusively owned by IBEF. The same may not be reproduced,
wholly or in part in any material form (including photocopying or storing it in any medium by electronic means and whether or not transiently or
incidentally to some other use of this presentation), modified or in any manner communicated to any third party except with the written approval of
IBEF.
This presentation is for information purposes only. While due care has been taken during the compilation of this presentation to ensure that the
information is accurate to the best of Aranca and IBEF’s knowledge and belief, the content is not to be construed in any manner whatsoever as a
substitute for professional advice.
Aranca and IBEF neither recommend nor endorse any specific products or services that may have been mentioned in this presentation and nor do
they assume any liability or responsibility for the outcome of decisions taken as a result of any reliance placed on this presentation.
Neither Aranca nor IBEF shall be liable for any direct or indirect damages that may arise due to any act or omission on the part of the user due to any
reliance placed or guidance taken from any portion of this presentation.
47 SIKKIM For updated information, please visit www.ibef.orgYou can also read