ANDHRA PRADESH THE RICE GRANARY OF INDIA - IDOL OF NANDI IN LEPAKI, ANDHRA PRADESH
←
→
Page content transcription
If your browser does not render page correctly, please read the page content below
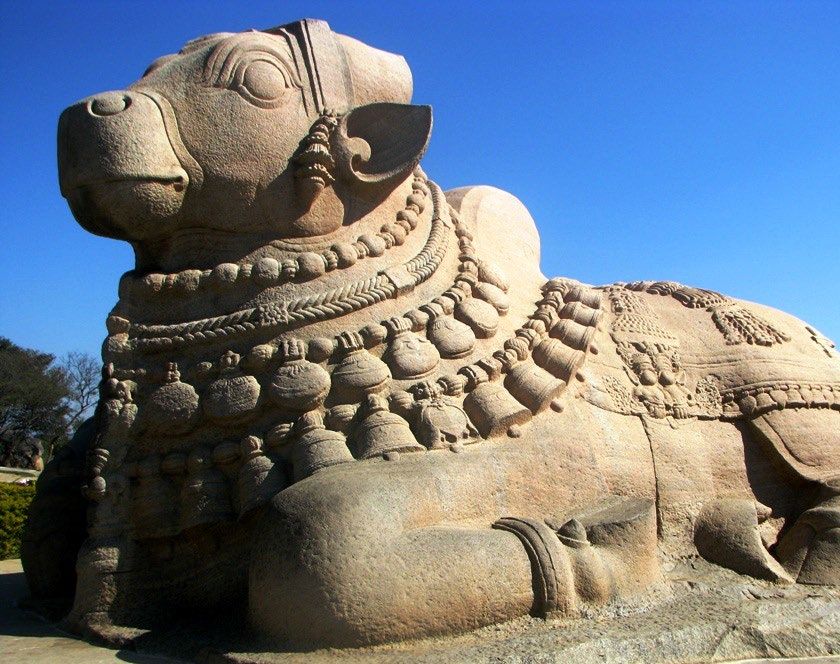
IDOL OF NANDI IN LEPAKI, ANDHRA PRADESH

 ANDHRA PRADESH
 THE RICE GRANARY OF INDIA

For updated information, please visit www.ibef.org                               March 2020

Table of Content

  Executive Summary…….………….…..…….3

  Re-organisation Act, 2014..………….…......4

  Introduction..………………………...………..6

  Economic Snapshot..…………………..…..11

  Physical Infrastructure..………...............…17

  Social Infrastructure...................................25

  Industrial Infrastructure..............................28

  Key Sectors..…..........................................31

  Key Procedures & Policies...…….........…..37

  Annexure...…….……….........................….48
EXECUTIVE SUMMARY
Andhra Pradesh accounts for a major share in the overall exports of seafood products from India, in value
Largest exporter of marine terms.
products Andhra Pradesh ranks first in prawn and fish production in the country and fourth in production of marine
fisheries.
Various pharmaceutical companies have set up their manufacturing hubs in Visakhapatnam and Srikakulam
districts. The state provides ample growth opportunities due to availability of ports along with large parcels of
Growth of pharmaceutical land for expansion, etc.
industry Out of the 20 operational SEZs in Andhra Pradesh, four are pharmaceutical SEZs, as of November 14th,
2019. Exports of pharmaceuticals* from the state stood at US$ 1.15 billion in FY19 and reached US$ 900
million in FY20.
A National Investment and Manufacturing Zone (NIMZ) is under works in Prakasam district. It is going to be
Largest exporter of marine
set up over an area of 14,231 acres and will help in generating 500,000 jobs over the next 10 years. As per
products latest available data, land acquisition for the project has already been started.
Tourist arrivals in Andhra Pradesh increased by 17.7 per cent to 195.05 million in 2018.
Tourist destination Under Budget 2018-19, the Government of Andhra Pradesh announced an allocation of Rs 290 crore (US$
44.79 million) for the development of tourism and culture in the state.
Note: P – Provisional, *includes drug formulations, biologicals, bulk drugs and drug intermediates
Source: The Marine Products Export Development Authority (MPEDA), Ministry of Tourism, Government of India, State Budget, AP State Portal, Andhra Pradesh Tourism, DGCIS Analytics
3 Andhra Pradesh For updated information, please visit www.ibef.org
REORGANISATION ACT, 2014 … (1/2)
Andhra Pradesh Reorganisation Act, 2014 or the Telangana Act is a parliamentary declaration of the bifurcation of Andhra Pradesh state into 2
states, Telangana & residuary Andhra Pradesh. The act consisted of the aspects of division of assets and liabilities, the boundaries of the proposed
new states & status of the capital city Hyderabad after the separation of the state. As per the Ministry of Law & Justice, this act may be called the
Andhra Pradesh Reorganisation (Amendment) Act, 2015. After the amendment of this act, number size of members will increase to 58 from 50.
Common capital and Greater Hyderabad Municipal Corporation area of Hyderabad would be the common capital for the states for a period not
Governor more than 10 years. However, the new capital city would be Amaravati. Both states to have a common Governor.
Central Government to provide assistance to raise additional forces.
Police forces
New training centre for Seemandhra would be established.
High Court at Hyderabad would be a common High Court till a separate High Court is established for Seemandhra.
High Court
The expenditure is to be allocated on the basis of population ratio.
Central Government to make appropriate grants, provide adequate benefits & incentives in the form of a special
Special development development package for Seemandhra.
package
This will ensure expansion of physical & social infrastructure.
4 Andhra Pradesh For updated information, please visit www.ibef.org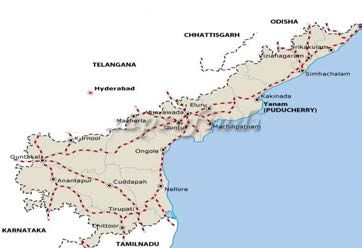
REORGANISATION ACT, 2014 … (2/2)
For central government employees, an advisory committee would be appointed to draw up guidelines and take up the
Services of allocation exercise.
Employees For state government employees, district, zonal & multi-zonal cadres falling in one of the successor states are deemed to be
allotted to that state; else employees would be allocated based on options.
2 separate boards would be created by the central government for Krishna & Godavari Rivers to look after administration,
Water Resources regulation, maintenance & operation of notified projects.
Existing PPAs would continue; units of APGENCO and assets of APTRANSCO would be divided based on location.
Energy
Central power would be allotted on actual energy consumption trend.
The Government of India shall take steps to establish institutions of national importance in the newly formed state.
The Government of India shall establish an AIIMS-type super-specialty hospital-cum-teaching institution.
Higher Education
Admissions in higher, technical & medical education would be common for 10 years.
Quotas under article 371-D would also continue.
Central Government to provide financial support for creation of a new capital.
An expert committee to be constituted by the central government to study various alternatives & make a recommendation
within 6 months. However, the new capital city would be Amaravati.
New Capital The World Bank, Housing & Urban Development Corporation (HUDCO) & Andhra Bank, sanctioned US$2.61 billion for the
construction of capital city of Amaravati.
The state government is planning to build a new world class capital city, Amaravati, on a 217 sq km open area in Guntur
district. The city is being designed with 10% water bodies and 51% green spaces, along with several iconic buildings.
5 Andhra Pradesh For updated information, please visit www.ibef.org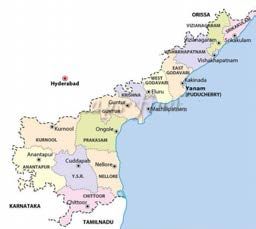
ANDHRA PRADESH
ANDHRA PRADESH FACT FILE
Most commonly spoken language is Telugu. Urdu, Hindi, Tamil,
Kannada & Oriya are the other languages used.
Out of various districts in the state, Krishna district has the highest
population density at 518 persons per sq. km.
Parameters Andhra Pradesh
1
Capital Hyderabad , Amaravati
Geographical area (sq km) 1,62,970
Source: Maps of India
Administrative districts (No) 13
Population density (persons per sq km) 304
Total population (million) 54.0944
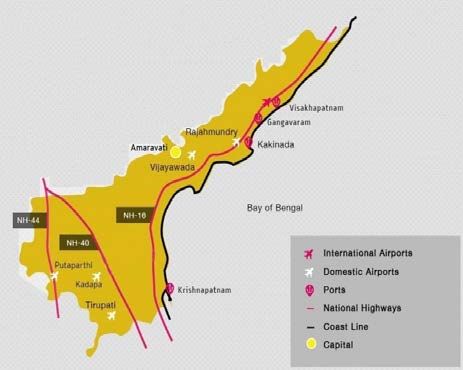
Andhra Pradesh is located in the southern peninsula of India & has a
coast line of 974 km. It is eighth largest states in the country. Male population (million) 24.73
The state of Andhra Pradesh is bound by Chhattisgarh on the north, Female population (million) 24.64
Odisha on the northeast, Telangana & Karnataka on the west, Tamil Sex ratio (females per 1,000 males) 997
Nadu on the south & the Bay of Bengal on the east.
Literacy rate (per cent) 67.4
Visakhapatnam, Vijayawada, Tirupati, Rajahmundry, Guntur,
Kakinada, Ongole, Nellore & Kurnool are some of the key cities in
the state.
Source: Andhra Pradesh State Portal, Andhra Pradesh Socio-Economic Survey 2018-19, 1For ten years
7 Andhra Pradesh For updated information, please visit www.ibef.orgADVANTAGE
High economic growth Long coastline
During 2018-19, the services sector accounted for a A 974-km long coastline provides numerous
share of 43.6 per cent in the total GVA of the state, opportunities for the state to develop a number of
followed by agriculture and allied sector at 33.64 per ports.
cent and Industry at 23.38 per cent
The Visakhapatnam port ranks fourth in terms of
At current prices, the GSDP of Andhra Pradesh was port traffic. During FY19, the traffic handled at the
Rs 10.08 trillion (US$ 154.62 billion) in 2019-20. port was 65.30 million tonnes.
Advantage
Andhra
Pradesh
Adequate power Growth in Exports
generation capacity Andhra Pradesh primarily exports drugs,
pharmaceuticals and allied chemicals and
plastics, agriculture and agro-based products,
Most of the coal-based power plants are located
engineering products, mineral products,
in the coastal regions due to their connectivity to
handicrafts and carpets, textiles, leather, animal
the ports.
and marine products.
The Government of Andhra Pradesh delivers
Exports for the year 2018-19 have recorded Rs
24X7 reliable and quality power across the
98,983.95 crore (US$ 14.16 billion) against Rs
industrial commercial and domestic sectors of the
84,640.56 crore (US$ 12.11 billion) in 2017-18.
state.
Note: GSDP: Gross State Domestic Product, * In Rs terms
Source: Central Electricity Authority, Directorate of Economics & Statistics of Andhra Pradesh, Central Statistics Office, Andhra Pradesh State Portal, Indian Port Association,
8 Andhra Pradesh For updated information, please visit www.ibef.orgANDHRA PRADESH IN FIGURES
Andhra Pradesh’s Contribution to Indian Economy (2018-19) Physical Infrastructure in Andhra Pradesh
Andhra
Parameter India Parameter Andhra Pradesh India
Pradesh
GSDP as a percentage of all Installed power capacity
4.80 100.00 24,803 36,427.97
states’ GSDP (MW) (February 2020)
GSDP growth rate (%) 15.30 9.80 Wireless subscribers (No)
87.02 1172.44
(in December 2019) (Mn)
Per capita GSDP (US$) 2,460.93 1,975.05
Internet subscribers (Mn)
Social Indicators 53.80 687.62
(till September 2019)
Andhra National highway length
Parameter India 6,913 132,499
Pradesh (km) (March 2019)
Literacy rate (%) 67.40 73.0 Major and minor ports
1+12 12+200
(No)
Birth rate (per 1,000
16.4 20.4
population) Airports (No) (March
7 129
2019)
Industrial Infrastructure Investments (as of September 2019)
Andhra Andhra
Parameter India Parameter India
Pradesh Pradesh
Operational PPP projects (No)
85 1824 Cumulative FDI equity inflows
(December 2019) 18.98 456.79
since April 2000 (US$ billion)
Operational SEZs (No) (as of
20 238
February 2020)
Note: GSDP, per capita GSDP figures are taken at current prices, For source refer to Annexure
9 Andhra Pradesh For updated information, please visit www.ibef.orgVISION - 2029
Add value to 40 per cent of total fish produce
by 2029
As per the Budget 2019-20, government has Increase GSDP per capita to Rs 5.07 lakh
set up a price stabilization fund (US$ 7,866.56) by 2029-30.
with a corpus of Rs 3,000 crore (US$ 429.24
Achieve12 per cent annual GSDP growth till
million) to enable market intervention in
2029-30.
agriculture and horticultural crops.
Agriculture Economic
and Growth
Establish 100 Fisheries
Incubators/Accelerators
Start-up Job Creation 25,000 new and export oriented
Incubate 5,000 companies and
start-ups Ecosystem Vision 2029 through MSMEs MSMEs
Share of MSME Employment to be
10 per cent by 2029
Social
Infrastructure
Development
Development
Achieve Human Development Index
(HDI) score of 0.9 Construct 24,000 km of roads and
highways
Receive very high human
development status Increase storage and warehouse
capacity to 62.9 MTPA by 2029
As per the Budget 2019-20,
Government has started a massive
school infrastructure modernization
program with an allocation of Rs
1,500 crore (US$ 210 million).
Source: Sunrise Andhra Pradesh Vision 2029
10 Andhra Pradesh For updated information, please visit www.ibef.orgANDHRA PRADESH
ECONOMIC SNAPSHOT – GSDP
GSDP of Andhra Pradesh at current prices GSDP per capita of Andhra Pradesh at current prices
180 12 3500 250000
CAGR (In Rs) 13.97% CAGR (In Rs) 13.15%
160
3000
10.81
10
3,029.38
154.62
200000
211,723.32
140
2500
2,616.58
182,872.98
120 8
2,460.93
150000
158,607.22
100 2000
2,048.87
6.95
103.67
6.80
6
137,458.93
97.34
95.08
1,829.78
6.13
91.70
80
6.00
1500
1,711.84
119,777.31
85.85
100000
1,605.77
79.12
1,539.19
5.25
1,524.36
76.74
75.56
104,679.07
60 4
4.64
93,120.73
1000
4.11
83,001.25
76,996.85
3.79
40 50000
2 500
20
0 0 0 0
2011-12
2012-13
2013-14
2014-15
2015-16
2016-17
2017-18
2011-12
2012-13
2013-14
2014-15
2015-16
2016-17
2017-18
2018-19
2019-20
2018-19AE
2019-20BE
US$ billion Rs trillion
US$ Rs
At current prices, the GSDP of Andhra Pradesh was Rs 10.08 The state’s per capita GSDP in 2018-19 was Rs 182,872 (US$
trillion (US$ 154.62 billion) in 2019-20. 2,616.6) compared with Rs 76,996.85 (US$ 1,642.42) in 2011-
12.
The GSDP grew at a CAGR of 13.97 per cent from 2011-12 to
2019-20. Per capita GSDP increased at a CAGR of 13.15 per cent
between 2011-12 and 2018-19.
Source: Andhra Pradesh Socio Economic Survey 2017-18
12 Andhra Pradesh For updated information, please visit www.ibef.orgECONOMIC SNAPSHOT – NSDP
NSDP of Andhra Pradesh at current prices NSDP per capita of Andhra Pradesh at current prices
140 CAGR (In Rs) 13.97% 9 2500 CAGR (In Rs) 13.17% 180000.00
8 160000.00
2,346.90
8.47
120
164,025.00
2,233.28
2000
121.20
7 140000.00
7.35
113.99
143,935.00
100
1,854.24
6 120000.00
6.31
124,401.00
94.09
1500
1,649.89
80 5 100000.00
1,535.62
5.45
108,002.00
83.23
1,439.00
1,371.68
77.01
1,369.75
93,903.00
4.71
4 80000.00
70.91
60
68.29
67.99
1000
82,870.00
4.13
74,688.00
3.70
3 60000.00
69,000.00
3.40
40
2 500 40000.00
20
1 20000.00
0 0 0 0.00
2011-12
2012-13
2013-14
2014-15
2015-16
2016-17
2017-18
2018-19
2011-12
2012-13
2013-14
2014-15
2015-16
2016-17
2017-18
2018-19
US$ billion Series 2 Series 3 Rs trillion US$ Rs
At current prices, the NSDP of Andhra Pradesh was Rs 8.47 The state’s per capita NSDP in 2018-19 is Rs 164,025.00 (US$
trillion (US$ 121.20 billion) in 2018-19. 2,346.90) compared with Rs 69,000.00 (US$ 1,471.84) in 2011-
12.
The NSDP grew at a CAGR of 13.97 per cent from 2011-12 to
2018-19 Per capita GSDP increased at a CAGR of 13.17 per cent
between 2011-12 and 2018-19
Source: Andhra Pradesh Socio Economic Survey 2017-18
13 Andhra Pradesh For updated information, please visit www.ibef.orgECONOMIC SNAPSHOT – PERCENTAGE
DISTRIBUTION OF GSVA
During 2018-19, the services sector accounted for a share of 43.6 Visakhapatnam
GSVA composition
port trafficby
(million
sectortonnes)
per cent in the total GVA of the state, followed by agriculture and
allied sector at 33.64 per cent and Industry at 23.38 per cent. 100%
40.91% CAGR^ 42.98%
90%
The agriculture and allied sector grew at the fastest rate at 20.49 per
cent between 2011-12 and 2018-19AE, followed by the services 80% 17.02%
sector at 17.02 per cent and industry sector at 10.03 per cent. 70%
60%
32.21%
10.03% 23.38%
50%
40%
30% 33.64%
26.88%
20%
20.49%
10%
0%
2011-12 2018-19
Agriculture & Allied Industry Services
Note: AE – Advance Estimates
Source: Andhra Pradesh Socio Economic Survey 2018-19
14 Andhra Pradesh For updated information, please visit www.ibef.orgECONOMIC SNAPSHOT – FDI INFLOWS &
INVESTMENTS
FDI inflows in Andhra Pradesh in April 2000-September 2019
According to the Department for Promotion of Industry and Internal Visakhapatnam port traffic (million tonnes)
(US$ million)
Trade (DPIIT), FDI inflows in Andhra Pradesh between April 2000
20000 18,990
and September 2019 reached US$ 18.98 billion. 3,457
18000 521
16000 1,246
During AP-CII Partnership Summit 2018 held at Vishakhapatnam, 14000
2,195
the state signed MoUs worth Rs 4.39 lakh crore (US$ 68.11 billion). 1,556
12000
1,369
10000 678
1,159
In January 2019, Asia Pulp & Paper decided to invest US$ 3.5 billion 8000 848
for setting up of a greenfield pulp and paper plant in Prakasam 6000
4000
district.
2000
0
During 2019, 139 investment intentions worth Rs 18,823 crore (US$
2011-12
2012-13
2013-14
2014-15
2015-16
2016-17
2017-18
2018-19
FY20
FY01-FY11
FY01-FY20
2.69 billion) were filed in Andhra Pradesh.
Investment intentions in terms of IEMs filed, LOIs / DILs issued
Year Number Proposed Investments (US$ billion)
2016 164 5.13
2017 154 4.54
2018 161 2.83
2019 139 2.69
Source: Department for Promotion of Industry and Internal Trade
15 Andhra Pradesh For updated information, please visit www.ibef.orgECONOMIC SNAPSHOT – EXPORT TRENDS
Merchandise Exports from Andhra Pradesh (US$ billion) Principal Commodities Exported in 2019-20 (till December 2019)
18.00 Marine Products
16.00 Iron and Steel
15.91
14.00
14.08 20.53% Drug Formulations,
12.00 13.02 Biologicals
12.14 11.94
10.00 38.06% Ship, Boats and Other
10.69 Floating Structures
8.00 6.90% Rice (Other than Basmati)
6.00
Residul Chemical
4.00 10.14%
2.00 Spices
3.12%
0.00 9.96%
Tobacco Unmanufactured
FY15 FY16 FY17 FY18 FY19 FY20 (till
September Others
19) 6.13% 3.42% 1.74%
Merchandise exports from Andhra Pradesh have increased to US$ 14.08 billion in 2018-19 from US$ 11.94 billion in 2016-17. In 2019-20, it
reached US$ 10.68 billion (till December 2019).
Marine Products is the largest export category of the state, accounting for nearly 20.07 per cent of total exports in 2019-20.
Note: MEIS – Merchandise Export from India Scheme
Source: APEDA, Economic Survey 2018-19
16 Andhra Pradesh For updated information, please visit www.ibef.orgANDHRA PRADESH
PHYSICAL INFRASTRUCTURE – ROADS
The total R&B road network (excluding NH roads) in the state was
46,237.65 kms as on March 2019, comprising 13,500.45 kms of State Road length (km)
Road Surface
Highways, 32,737.20 kms of Major district road and Rural roads. (As of March 2019)
In September 2016, the state had approved India’s first coastal corridor – Cement & concrete 2,366.705
the Vishakhapatnam Chennai Industrial Corridor (VCIC). The Asian
Development Bank (ADB) has approved US$ 631 million (in loans and
Black top 48,463.888
grants) for the project. Further, in State Budget 2018-19, the government
allocated Rs 1,668 crore (US$ 258.81 million) for the project. Under the
project, four nodes – Vishakhapatnam, Kakinada, Kankipadu-Gannavaram Metalled and unmetalled 2,266.709
and Yerpedu-Srikalahasti have been identified for development. The
master planning of two nodes of the corridor – Vishakhapatnam and
Total roads 53,097.302
Yerpedu-Srikalahasti – is currently ongoing.
As per the State Budget 2019-20, Andhra Pradesh has allocated 1.6 per
cent of its total expenditure for roads and bridges.
For 2019-20, the state government has allocated Rs 6,202.98 crore (US$
887.53 million) as capital expenditure on transport, road and buildings
department in the state.
Under Andhra Pradesh Petroleum, Chemicals & Petrochemicals
Investment Region (AP PCPIR), construction of 40 km of national
highways, 42 km of state highways & nearly 75 km of major districts roads
is under planning & is expected to be completed in the next 5 years. As of
July 2018, the draft master plan and draft Environmental Impact
Assessment Study has been prepared.
Source: NHAI, State Budget 2019-20
18 Andhra Pradesh For updated information, please visit www.ibef.orgPHYSICAL INFRASTRUCTURE – RAILWAYS & METRO
RAIL
The state is well connected through the rail network. Rail network across the state
Visakhapatnam, the largest city in the state, has rail accessibility to
nine district headquarters out of thirteen in the new state. The city is
also well connected to the neighbouring states of Odisha and
Chhattisgarh.
The state government has undertaken construction of Nadikudi-
Srikalahasti line, covering a length of 308 km. The main purpose
behind the construction of this new line is to develop the backward
areas of Guntur, Prakasam, Nellore and Chittoor districts and
improve their connectivity with other states and also enable exports
of raw materials that are used in cement and granite industries. As
of July 2018, a section of the line stretching between Piduguralla
and Rompicherla has been laid and trial runs initiated.
The Union Government has also planned to develop metro rail
projects at Visakhapatnam and Vijayawada. The Visakhapatnam
project, estimated to cost Rs 8,300 crore (US$ 1,287.82 million), will Source: Maps of India
develop three important routes. As of Nov 2018, the state
government has approved the proposal for metro rail with public
private partnership.
The first phase of the Vijayawada Metro Rail Project is expected to
be completed by August 2018 and the Visakhapatnam Metro Rail
Source: News Articles
19 Andhra Pradesh For updated information, please visit www.ibef.orgPHYSICAL INFRASTRUCTURE – AIRPORTS
Andhra Pradesh has eight operational airports/air strips at Visakhapatnam, Tirupati, Rajahmundry, Vijayawada, Bobbili, Nagarjuna Sagar and
Puttaparthi. Apart from these, Donakonda airport is non-operational (closed) whereas 4 are under development in Nellore, Kurnool, Ongole.
Kadapa airport has been made operational. Visakhapatnam, also popular as Vizag, has an international airport, which is under the Navy's
command.
In January 2018, Andhra Pradesh inaugurated its seventh airport at Orvakallu near Kurnool city. It is developed on a 1,010 acre site at a cost of
Rs 110 crore (US$ 15.25 million).
The upcoming international airport Bhogapuram will be developed by the state government, under PPP mode, at an estimated cost of US$ 328.60
million & will cater to 6.3 million passengers a year. It is expected that the airport will be completed by December 2020.
In 2019, existing runways at Vijaywada airport has been extended from 2,286 metres to 3,360 metres similarly, Rajahmundry airport extended
from 1,750 metres to 3,165 metres.
Andhra Pradesh Airport Statistics
2019-20 (up to Jan
Parameter 2018-19 2017-18 2016-17
2020)
Passenger traffic- Vijayawada airport 9,83,238 1,184,853 746,392 622,354
Passenger traffic-Visakhapatnam airport 23,16,731 2,853,390 2,480,379 2,358,029
Aircraft movement-Vijayawada airport 13,094 19,026 11,998 10,333
Aircraft movement-Visakhapatnam airport 17,595 23,695 19,595 19,550
Source: Airports Authority of India
20 Andhra Pradesh For updated information, please visit www.ibef.orgPHYSICAL INFRASTRUCTURE – PORTS
Traffic handled by Visakhapatnam port reached 63.54 million tonnes Visakhapatnam port traffic (million tonnes)
in 2017-18. In 2018-19, traffic handled reached 65.30 million tonnes.
70.00
The state government had invited bids for development of
Bhavanapadu port in 2016. In January 2018, the state government
66.74
finalised Adani Ports and SEZ Ltd as the developer of the greenfield
65.00
65.30
project. The port is expected to have a capacity of 30.57 million
tonnes and will be constructed over 2,050 acres of land. The project
63.54
is expected to be completed by 2023 to 2024.
61.02
60.00
Further, the Visakhapatnam multi-modal logistics parks (MMLP) is
ready for operation. The government has also announced its plans to
57.03
set up 2 more MMLPs at Krishnapatnam and Kakinada.
55.00
On November 17, 2019, ports of Visakhapatnam and Ranong in
Thailand entered in joint venture to explore business opportunities.
50.00
In November 2019, Visakha Container Terminal at Vizag port
2015-16
2016-17
2017-18
2018-19
2019-20*
operated the first-ever direct service from South East India to North
Europe (IEX), also connecting the Mediterranean region.
Note:*- April to February 2020
Source: Ministry of Shipping, Indian Ports Association, News Articles
21 Andhra Pradesh For updated information, please visit www.ibef.orgPHYSICAL INFRASTRUCTURE – POWER
As of February 2020, Andhra Pradesh had a total installed power Installed power capacity (MW)
generation capacity of 24,803.00 MW. Out of the total, private utilities
contributed 15,749.75 MW, state utilities contributed 6975.18 MW 30,000
and central utilities contributed 2,078.08 MW. With a contribution of
14,688.21 MW, thermal power accounted for the highest share of the
overall installed power generation capacity of the state, followed by 25,000
24,803.00
24,184.29
renewable energy with a contribution of 8,313.92 MW.
22,933.77
22,298.30
In Budget 2019-20, the state government announced plans to invest 20,000
Rs 6,861.03 crore (US$ 981.69 million) for the development of the
energy sector in the state.
15,000
15,301.07
The government had approved setting up of 6 light-water nuclear
reactors in the state in 2016. The nuclear reactors will be set up in
10,000
11,255.54
Kovvada and will have a capacity of 1,208 MW each. As of August
2018, project proposal for setting up the reactors in cooperation with
USA are in progress. 5,000
Government of Andhra Pradesh has been saving upto 2,000 million
units (MU) of power and about Rs 1,000 crore (US$ 136.08 million)
0
annually for last three years by promoting energy efficiency initiatives
2014-15
2015-16
2016-17
2017-18
2018-19
2019-20*
with an aim to conserve 15,000 MU of power by 2023.
In January 2019, the Government of Andhra Pradesh launched Wind
Power Policy 2018 for the period of five years and the incentives are
declared for the period of 10 years. It aims to expand the base of
wind projects.
Note: ^Under Vision 2029, *-till February 2020
Source: Central Electricity Authority, News Articles
22 Andhra Pradesh For updated information, please visit www.ibef.orgPHYSICAL INFRASTRUCTURE – TELECOM
Performance status of Bharat Net project (as of December 2018) Telecom Infrastructure (Up to December 2019)
No. of GPs in Phase-I 3,860 Wireless subscribers 87,022,888
Pipe laid (kms.)(July 2017) 2,627 Wireline subscribers 1,355,676
Internet subscribers (till
Optical Fiber Cable laid (kms) 4,268 53.80
September 2019)
Service ready GPs (November
1,573 Tele density (in %) 97.28
2019)
According to the Telecom Regulatory Authority of India (TRAI), Andhra Pradesh* had nearly 87.02 million wireless subscribers and 1.35 million
wireline subscribers, up to December 2019.
As of December 2019, the overall tele-density in the state stood at 97.28 per cent.
By the end of December 2019, 39.58 million subscribers had submitted requests for mobile number portability in the state*.
Note: *Including Telangana
Source: Telecom Regulatory Authority of India, India Post BSNL: Bharat Sanchar Nigam Limited
23 Andhra Pradesh For updated information, please visit www.ibef.orgPHYSICAL INFRASTRUCTURE – URBAN
Classification of AMRUT Cities in Andhra Pradesh on the basis
Smart City indicators (Census 2011)
of population (Census 2011)
Number of AMRUT cities with population City Population Literacy rate Area (sq. km)
30
less than 1 million
Visakhapatnam 1,728,128 81.79 % 544
Number of AMRUT cities with population
3
in the range of 1 – 10 million
Kakinada 312,538 80.62 % 30.51
Number of AMRUT cities with population
0
greater than 10 million Tirupati 287,482 86.97 % 27.44
Total number of AMRUT cities 33 Amaravati 5,180,000 88.23 % 217.23
The State Government is expediting work for the development of Amaravati, the state’s future capital. Tenders worth Rs 22,000 crore (US$ 3.4
billion) have been floated, 95 per cent of land pooling has been completed and the trunk infrastructure is expected to be completed by January
2019.
As per the State Budget 2019-20, government has allocated Rs 2,105 crore (US$ 30.11 million) to PM Awas Yojana, Rs 1,356 crore (US$ 19.40
million) to weaker section housing programmes and and Rs 1,000 crore (US$ 14.30 million) to YSR Urban Housing programme
As of January 2018, the State Government has launched four Smart City projects and identified 210 infrastructure projects entailing an investment
of Rs8,814.18 crore (US$ 1.36 billion). Out of the total, 71 projects are in Kakinada, 39 projects in Tirupati, 47 projects have been identified in
Vishakhapatnam.
Government of India has identified 33 cities in the state for coverage under AMRUT Mission. To support the mission, the state government
allocated Rs 490.94 crore (US$ 76.17 million) in budget 2018-19. Over the past four and half years, the Government of Andhra Pradesh has spent
Rs 77,000 crore (US$ 10.67 billion) in urban infrastructure.
24 Andhra Pradesh For updated information, please visit www.ibef.orgANDHRA PRADESH
SOCIAL INFRASTRUCTURE – EDUCATION
Classes Number of schools (2018-19) Enrolment of students in government schools,
Classes
2017-18 (in million)
Primary 39,605 Class I 683,022
(I-VII/VIII) 9,549 I to II 708,049
II to III 701,997
(I-XII) 214
III to IV 706,027
(VI-XII) 204 IV to V 702,254
V to VI 681,669
(I-X) 2205
VI to VII 679,825
(VI-X) 10,247
VII to VIII 690,929
Andhra Pradesh has a literacy rate of 67.4%, as per Census 2011.
The “Sarva Siksha Abhiyaan” and “Rashtriya Madhyamik Siksha Abhiyaan” are two schemes which are focusing towards fulfilling the aim of reinforcing
the education in the schools in accordance to the enrolment, quality, access as well as retention.
Under the State Budget 2019-20, government has allocated Rs 6,456 crore (US$ 92.3 million) to the Jagananna Ammavodi programme, Rs 1,500 crore
(US$ 21.46 million) for modernisation of infrastructure in schools and for Samagra Shiksha scheme Rs 1,158 crore (US$ 16.56 million) has been
allocated.
Funds allocated under Sarva Shiksha Abhiyan for Andhra Pradesh increased stood at Rs 2,882.48 crore (US$ 447.24 million).
In Budget 2018-19, US$ 33.38 billion is allocated for secondary education and US$ 437.91 million for higher education.
Source: Directorate of Intermediate Education Andhra Pradesh Socio Economic Survey 2017-18, State Annual Budget, 2018-19
26 Andhra Pradesh For updated information, please visit www.ibef.orgSOCIAL INFRASTRUCTURE – HEALTH
Medical Facilities (March 2020) Health indicators (SRS Bulletin 2017)
1
Sub-centres 7,459 Birth rate 16.4
2
Infant mortality rate 34
Primary health centres 1,533
1
Death Rate 6.8
Community health centres 215
Major hospitals
Sub District hospitals 47 Apollo Hospital
Care Hospital
District hospitals 26
Manipal Hospital
Krishna Institute of Medical Sciences
Total 9,280
As of March 2020, the state had 1,533 primary health centres, 7,459 sub centres, 47 sub-district hospitals and 26 district hospitals.
The state government has come up with new programmes which include 102 Talli Bidda Express for Maternal & Child Health, Tele Radiology, e-
Aushadi, etc. to provide ensured health care services to the people of the state.
Under the State Budget, government has allocated Rs 1,732 crore (US$ 24.78 million) to National Health Mission and Rs 1,500 crore (US$ 21.46
million) for infrastructure facilities at hospital.
An allocation of Rs 10,032 crore (US$ 1.44 billion) has been proposed by the state government for health care sector in the state, as per the
Budget 2019-20.
Note: 1Per thousand persons, 2Per thousand live births
Source: Andhra Pradesh State Budget 2019-20, Andhra Pradesh state portal, SRS Bulletin 1Per thousand persons, 2Per thousand live births
27 Andhra Pradesh For updated information, please visit www.ibef.orgANDHRA PRADESH
INDUSTRIAL INFRASTRUCTURE…(1/2)
Government of India is setting up a National Investment &
Manufacturing Zone (NIMZ) in Prakasam district, which would be set
Logistics Infrastructure in Andhra Pradesh
up in an area of 14,231 acres and help in generating 5 lakh jobs over
next 10 years. Land acquisition for the project is currently underway.
Also, development of Visakhapatnam-Chennai industrial corridor is
ongoing. The project once completed is expected to attract investments
of worth US$ 16.7 billion and generate more than 50,000 jobs.
The MoU is signed between JSW Group and Andhra Pradesh
Economic Development Board. The company expected to investment
of Rs 4,500 crore (US$ 623.70 million) to build a jetty at
Ramayapatnam Port and plans to expand their logistic footprint.
In February 2020, Isuzu Motors India, Japanese utility vehicle
manufacturer, commenced its Phase-II operations of its manufacturing
facility located in Sri City in Andhra Pradesh.
Source: APIIC
29 Andhra Pradesh For updated information, please visit www.ibef.orgINDUSTRIAL INFRASTRUCTURE…(2/2)
Andhra Pradesh was home to 20 operational SEZs, 32 SEZs with formal approvals, four SEZs with in-principle approval and 27 notified SEZs, as
of February 2020. These SEZs were spread across diversified sectors which include textiles & apparel, food processing, footwear & leather
products, multi-product, pharma, IT SEZs, etc.
Some of the operational SEZs in Andhra Pradesh
Name/Developer Location Primary industry
Visakhapatnam SEZ Vishakhapatnam, Multi-product
Divi’s Laboratories Limited Chippada Village, Visakhapatnam, Pharmaceuticals
Apache SEZ Development India Private Limited Mandal Tada, Nellore District Footwear
E-Bonangi Villages, Parawada
Ramky Pharma City (India) Pvt. Ltd. Pharmaceuticals
Mandal, Visakhapatnam District
Andhra Pradesh Industrial Infrastructural Corporation
Madhurawada Village, Visakhapatnam IT/ITES
Ltd.(APIIC)
Andhra Pradesh Industrial Infrastructure Corporation Atchutapuram and Rambilli Mandals,
Multi-product
Limited (APIIC) Visakhapatnam
Ace Urban Hitech City Limited (Formerly L&T Hitech City Keesarapalli Village, Gannavaram
IT/ITES
Limited) Mandal, Krishna District,
Hetero Infrastructure Pvt. Ltd. Nakkapalli Mandal, Visakhapatnam Pharmaceuticals
Mas Fabric Park (India) Pvt. Ltd Chillakru Mandal, Nellore District Textile and apparel
Duppituru, Doturupalem Maruture and
Brandix India Apparel City Private Limited Textile
Gurujaplen Villages in Visakhapatnam
Source: Department of Industries, Government of Andhra Pradesh
30 Andhra Pradesh For updated information, please visit www.ibef.orgANDHRA PRADESH KEY SECTORS Drugs and Pharmaceuticals Agriculture and Allied Industries Petroleum, Chemicals and Petrochemicals Tourism
KEY INDUSTRIES – DRUGS AND PHARMACEUTICALS
Andhra Pradesh drugs and pharmaceutical exports
Andhra Pradesh is home to many global & national pharma players;
(US$ billion)
various companies have set up their manufacturing hubs in
3
Visakhapatnam & Srikakulam districts.
Exports of pharmaceuticals* from the state stood at US$ 1.15 billion
in FY19 and reached US$ 1.42 billion in FY20 (up to December 3
2.50
2019).
In December 2018, the first phase of Andhra Pradesh Medtech Zone 2
(AMTZ) was inaugurated at Pedagantyada in Visakhapatnam. It will
have around 240 companies manufacturing medical equipments and
2
will generate 25,000 jobs.
1.40 1.41 1.42
In February 2020, Novartis has launched Biome India, a digital
1 1.15
innovation hub, in Hyderabad. This is the company’s first such centre
in Asia and the fourth globally.
1 0.65
0
FY15 FY16 FY17 FY18 FY19 FY20#
Note: * includes drug formulations, biologicals, bulk drugs and drug intermediates, #- till December 2019
Source: Andhra Pradesh IT department, News articles
32 Andhra Pradesh For updated information, please visit www.ibef.orgKEY INDUSTRIES – AGRICULTURE AND ALLIED
INDUSTRIES … (1/2)
The presence of rich climatic and soil conditions make Andhra Area under production Crop production
Pradesh a major agricultural belt. The state ranks first in area and Crop ‘000 Ha ‘000 tonnes
(2018-19)* (2018-19)*
production of fruits and spices in the country.
Paddy 2,209 12,370
Few of the leading crops produced in the state include rice, chilly,
Jowar 156 354
oilseeds, cotton, pulses and gram.
Bajra 22 22
The overall production of food grains in the state, during 2018-19 is Maize 267 1,565
expected to have reached 15.11 million tonnes with pulses
Ragi 34 43
production reaching 752 thousand tonnes.
Other millets
12 6
including wheat
The production of fruits and vegetables is estimated to have reached
Pulses 1,326 752
7.09 million tonnes and 17.61 million tonnes in 2018-19P,
Total food grains 4,026 15,112
respectively.
Groundnut 759 477
Castor 35 15
Sesamum 48 15
Total Oilseeds 963 2,493
Vegetables 718.91 17,614.67
Fruits 259.83 7,091.37
Note: P – Provisional, * - As per 4th Advance Estimates
Source: MPEDA, APEDA, Andhra Pradesh Economic Survey 2018-19
33 Andhra Pradesh For updated information, please visit www.ibef.orgKEY INDUSTRIES – AGRICULTURE AND ALLIED
INDUSTRIES … (2/2)
Andhra Pradesh fish and prawn production (million tonnes) Andhra Pradesh marine products exports (US$ million)
5 3,000
4
3.99 2,500 2,680.14
4
3.44
3 2,000 2,193.25
1,932.43
3 2.77
1,500
2 2.35 1559.49
1.98 1,379.17
2 1,000 1,114.39
1
500
1
0 0
2014-15 2015-16 2016-17 2017-18 2018-19 2014-15 2015-16 2016-17 2017-18 2018-19 2019-20*
Andhra Pradesh is also home to a thriving fisheries industry. The state ranks first in the production of fish and shrimp in India and contributes more
than 65 per cent of the country’s cultures shrimp production.
Fish and prawns production contributed around 7.4 per cent of the state’s GSDP and supported livelihood of 1.45 million persons, as of 2018-19.
The state’s exports of marine products have increased from US$ 1,559.49 million in 2014-15 to 1,932.43 million in 2018-19 and reached US$
2,193.25 million in 2019-20 (up to December 2019).
Note: * - till December 2019
Source: Andhra Pradesh Economic Survey 2018-19
34 Andhra Pradesh For updated information, please visit www.ibef.orgKEY INDUSTRIES – PETROLEUM, CHEMICALS AND
PETROCHEMICALS
According to the Director General of Hydrocarbons (DGH), Andhra Production of Crude Oil and natural gas
Pradesh has huge oil & natural gas reserves. The state’s Krishna-
1,200
Godavari basin, spread over an area of nearly 52,000 sq km, has a
total hydrocarbon resource base of 1,130 million metric tones.
1,000
Production of crude oil and natural gas in the state was recorded at
961.00
943.00
273 thousand metric tonnes and 961 mcm during 2018-19*,
800
834.00
respectively.
To promote investments in the industry, Andhra Pradesh Petroleum, 600
619.00
Chemicals & Petrochemicals Investment Region (PCPIR) is being
541.00
273.00
set up. The projects is coming up over an investment area of 603 400
square km and will boost refining, petrochemicals, chemical and
322.00
295.00
manufacturing sectors in the state.
276.00
254.00
200
The production of major chemical and petrochemicals stood at
659,200 tonnes in 2017-18^^. 0
2014-15
2015-16
2016-17
2017-18
2018-19 (Upto
Feb'19)
Crude Oil Production ('000 MT) Natural Gas Production (MCM)
Note: MCM – Million Cubic Metres, *-up to February 2019
Source: Ministry of Petroleum and Natural Gas, News articles, Andhra Pradesh Petroleum, Chemicals and Petrochemicals Investment Region, India Bureau of Mines
35 Andhra Pradesh For updated information, please visit www.ibef.orgKEY INDUSTRIES – TOURISM
Andhra Pradesh is known for its pristine beaches, sacred places of Domestic tourist arrival in Andhra Pradesh (in million)
worship, lush green forests, spicy cuisine & hospitable people. The
state continued to witness increase in domestic tourist arrivals over 250
the last few years.
In 2019, domestic tourist arrivals in the state stood at 195.8 million, 200
while foreign tourist arrivals stood at 0.23 million.
195.88
194.77
As per budget 2018-19, the Government of Andhra Pradesh
165.43
150
153.16
announced plans to spend Rs 290 crore (US$ 45.00 million) for the
development of tourism and Culture department in the state.
121.59
100
98.02
93.31
50
0
2013
2014
2015
2016
2017
2018
2019
Note: P – Provisional
Source: Ministry of Tourism, Government of India; News articles AP State Portal, Budget 2019-20
36 Andhra Pradesh For updated information, please visit www.ibef.orgANDHRA PRADESH
SINGLE-WINDOW APPROVAL MECHANISM
Andhra Pradesh is the first state in the country to have enacted the Industrial Single Window Clearance Act No 17 of 2002. The Act made it
compulsory for new industries to register with the single-window to obtain clearances quickly. It also simplified procedures for getting industrial
clearances.
Committees were constituted at district and state levels to communicate to the applicant the status of their clearances. It has set time slots for
issuing clearances and incorporated a provision for deemed approval after the expiry of the time limit.
District level committees can clear investments not exceeding US$ 219,442. State level committees can clear those exceeding US$ 219,442. .
Above the district and state level committees is an empowered committee headed by the Chief Secretary of the state government, who reviews
and monitors disposal of applications. Overall, a State Board under the chairmanship of the Chief Minister oversees the progress of the scheme.
Post effectiveness of The Andhra Pradesh Single Desk Policy 2015, the number of days required for clearance of application has been reduced to
21 days. The applications would be cleared at single information technology platform to enhance ease in doing business in the state.
Andhra Pradesh has become the top ranking state as per the ease of doing business ranking in India.
Violation of the provisions of the Act made either through self-assessment or otherwise would invite a penalty of US$ 109 in the first instance and
US$ 219 in the second instance.
38 Andhra Pradesh For updated information, please visit www.ibef.orgKEY INVESTMENT PROMOTION OFFICES
Corporations under Industries and Commerce Department
Andhra Pradesh Industrial Development Corporation (APIDC)
Andhra Pradesh Industrial Infrastructure Corporation (APIIC)
Andhra Pradesh Mineral Development Corporation (APMDC)
Andhra Pradesh State Finance Corporation (APSFC)
Andhra Pradesh State Trading Corporation (APSTC)
Andhra Pradesh State Handloom Weavers Co-operative Society Limited (APCO)
Leather Industries Development Corporation of Andhra Pradesh (LIDCAP)
Andhra Pradesh Handicrafts Development Corporation (APHDC)
Andhra Pradesh Khadi & Village Industries Board (KVIB)
Andhra Pradesh Urban Financial Infrastructure Development Corporation
Directorate of Sugar and Commissionerate of Cane
Directorate of Mines and Geology
Commissionerate of Industries
39 Andhra Pradesh For updated information, please visit www.ibef.orgCONTACT LIST
Agency Contact information
4th Floor, Parisrama Bhavan
Fateh Maidan Road, Basheerbagh
Hyderabad - 500 004
Andhra Pradesh Industrial Infrastructure Corporation Phone: 91-40-2323 7622, 2323 7623
Fax: 91-40-2323 3251, 2323 1459
E-mail: hyd@apiic.in
Website: www.andhra.apiic.in
Industries and Commerce Department
2nd Floor, D Block, Room No-348A
Secretariat
Hyderabad - 500022
Department of Industries and Commerce
Phone: 91-040-23454449
Fax: 91-040-23452985
E-mail: secy_inds@ap.gov.in
Website: http://industriesportal.apcgg.gov.in/
40 Andhra Pradesh For updated information, please visit www.ibef.orgKEY APPROVALS REQUIRED … (1/3)
S No Approvals and clearances required Respective departments of state Estimated time
Registration, Industrial Entrepreneurs
1 Registrar of Firms 7 days
Memorandum (IEM), Industrial Licenses
Allotment of Land/Shed in Industrial Estates or Andhra Pradesh Industrial Development 7 days for up to 1,000 sq m
2
Industrial Areas Corporation 21 days for above 1,000 sq m
3 Acquisition and alienation of Government lands Chief Commissioner of Land Administration (CCLA) 45 days
Building/Site Permission / Approval/License from
Department of Municipal
4 Municipality/ UDA (Urban Development Authority) 7 days
Administration & Urban Development
DT & CP (Directorate of Town & Country Planning)
Department of Panchayati Raj &
5 Building /Site Permission from Gram Panchayat 15 days / Deemed
Rural Development
If in Master Plan - 10 days
Approval of change of land use for Land Administration Department of
6
Industrial purpose Revenue
If not in Master Plan – 21 days
Green 7 days
Consent for establishment
7 Orange AP Pollution Control Board 15 days
under Pollution Control
Red 21 days
Green 7 days
Orange 15 days
Consent for operation under Red 21 days
8 AP Pollution Control Board
Pollution Control
Authorization of
Processed along with
units handling
CFO
hazardous wastes
Source: Commissionerate of Industries, Government of Andhra Pradesh
41 Andhra Pradesh For updated information, please visit www.ibef.orgKEY APPROVALS REQUIRED … (2/3)
S No Approvals and clearances required Respective departments of state Estimated time
9 No-Objection Certificate for Fire Safety Directorate of Fire Services Department of Home 15 days
10 Permission for Establishment of Distillery 30 days
11 Licence for possession and use of Rectified Spirit Prohibition & Excise Department of 21 days
Revenue
12 Licence for possession and use of Denatured Spirit 21 days
Commercial Tax Department of
13 VAT/CST registration 3 days
Revenue
14 Power feasibility 7 days
DISCOM-Department of Energy To be based on the
15 Power connection
length of the HT line
Directorate of Factories Department of Labor
16 Approval of factory plans 7 days
Employment Training and Factories
Directorate of Factories-Department 7 days / Deemed for
17 Factory license
of Labor Employment Training and Factories Registration only
Approval for water supply from
18 Department of Municipal Administration & Urban 7 days
ULB s-MA & UD Department
Department
19 Water connection 21 days
Permission to draw water from
river/public tanks, Irrigation & CAD
20 Irrigation & CAD Department 15 days
Department Permission to dig new wells from
Ground Water Department
Source: Commissionerate of Industries, Government of Andhra Pradesh
42 Andhra Pradesh For updated information, please visit www.ibef.orgKEY APPROVALS REQUIRED … (3/3)
S No Approvals and clearances required Respective departments of state Estimated time
License for manufacture of AYUSH-Department of Health, Medical & Family
21 15 days
ayurvedic, homeo, siddha, unani Welfare
License for manufacture of bulk Drug Control Administration Department of Health,
22 15 days
drugs / formulations / cosmetics Medical & Family Welfare
23 Registration of partnership firms Registration & Stamps Department of Revenue 3 days
24 Registration under professional tax Commercial Tax Department of Revenue Spot approval
Commissionerate of Labor -Department of Labor
25 Registration of shops & establishments Spot approval
Employment Training and Factories
Directorate of Boilers Department of Labor
26 Boiler registration 15 days
Employment Training and Factories
27 Registration of plastic manufacturers / recyclers AP Pollution Control Board 15 days
License for storage of petroleum, diesel and
28 District Collector/ Civil Supplies Department 15 days
Naptha
Source: Commissionerate of Industries, Government of Andhra Pradesh
43 Andhra Pradesh For updated information, please visit www.ibef.orgCOST OF DOING BUSINESS IN ANDHRA PRADESH
Parameter Cost estimate
Land price (US$ per hectare) 373,416
Labour cost (US$ / man year) 1,573
Occupation costs (US$ / sq ft / year) 18.4
Metropolitan Area: 9.1
Electricity (US cents per kWh)
Non Metro Area: 9.4
Cost of capital (Prime lending rate,%) 10.57
Employee cost (US$ / man year)
Software developers 6,383
Team leads 14,893
Architects 21,276.5
Project managers 31,915
Andhra Pradesh topped the 2017 Ease of Doing Business Index, prepared by the World Bank and DPIIT.
Source: Vijayawada Municipal Corporation, Visakhapatnam Industrial Water Supply Company, Property Sites, News articles, Travel sites, PwC report, Andhra Pradesh State Electricity
Board
44 Andhra Pradesh For updated information, please visit www.ibef.orgSTATE ACTS AND POLICIES … (1/4)
Objectives
To develop Andhra Pradesh as an IoT hub and accomplish a considerable share in the country’s IoT market by
Andhra Pradesh Internet 2020.
of Things (IoT) Policy
In IoT verticals, direct employment for at least 50,000 people
2016-2020
Read more
To create opportunities related to employment in IoT space for educated youth of the state.
To ensure sustainable & inclusive industrial growth.
Industrial Development To be among the Top 3 states in terms of industrial investments by 2022 and be the most preferred logistics hub
Policy 2015-2020 and India’s gateway to East and Southeast Asia by 2029. Read more
To enhance the quantum and quality of skilled manpower and create significant employment opportunities.
Textile, Apparel and To attract new investments in value added textile activities worth Rs 15,000 crore (US$ 2.24 billion) by 2023.
Garments Policy 2018-
23 To convert the major portion of yarn produced in the state into fabric and garment’s within the state. Read more
To aid the development of solar power projects in the state and attract new investments for capacity addition of
Andhra Pradesh Solar 5,000 MW over next five years
Power Policy 2018
NREDCAP would act as the nodal agency and responsible for capacity allotment. Read more
The new policy would replace the existing policy in order to attract new investments and achieve 4,000 MW
Andhra Pradesh Wind capacity addition through wind power projects in the state
Power Policy 2015
NREDCAP would act as the nodal agency and would be responsible for capacity allotment of up to 40 MW
Read more
45 Andhra Pradesh For updated information, please visit www.ibef.orgSTATE ACTS AND POLICIES … (2/4)
Objectives
To provide a special focus on Automobile Industry by the provision of subsidies and reimbursements on CST,
Automobile and Auto- VAT/SGST. The development of Industrial Corridors(VCIC/CBIC) by providing excellent port logistics and
Components Policy infrastructure has been highlighted in the policy.
2015-20
To attract high investments in the state and improving the employment status. Read more
To attract investments worth ~US$ 757 million by the end of 2020 in order to make the state as one of the most
Food Processing Policy preferred destinations for food processing industries
2015-2020
Create 50,000 job opportunities in the state by 2020. Read more
To create a conducive ecosystem to provide all clearances required to setup industry within 21 working days.
Andhra Pradesh Single
Desk Policy 2015-20 To provide spot and deemed approvals based on self-certification and to provide parallel processing of streamlined
Read more
processes.
To attract investments worth ~US$ 1.5 billion by the end of 2020 through projects under the public-private
New Tourism Policy- participation (PPP) mode
2015-20 Read more
Create 500,000 job opportunities in the state by 2020.
To attract investments worth ~US$ 908 million by the end of 2020 and support the state to emerge as most
Biotechnology Policy - preferred destination for biotech investments
2015-20 Read more
Create 5,000 job opportunities in the state by 2020.
46 Andhra Pradesh For updated information, please visit www.ibef.orgSTATE ACTS AND POLICIES … (3/4)
Objectives
To provide special incentives and facilities for the electronic hardware sector in line with the present ICT policy.
Innovation & Start-up
The policy would cover areas such as industrial electronics, communication & broadcast equipment, computers &
Policy 2014-2020
peripherals, and strategic electronics & components (semiconductors, solar & displays). Read more
Andhra Pradesh Cyber To create a robust cyber ecosystem in Andhra Pradesh
Security Policy 2017 Establishment of a Cyber Security framework and strengthening law enforcement agencies Read more
Andhra Pradesh To develop Electronics Industry as an important growth engine for Andhra
Electronics Policy 2014- The Policy aims to attract investments to the tune of US$ 5 billion in ESDM sector and create an employment of
2020 0.4 Million by 2020. Read more
To make minor ports of the state as the favoured ports for container cargos from North and Central regions of the
Andhra Pradesh Port country.
Policy 2015 Read more
To allow commercial feasibility of various projects related to the ports.
Andhra Pradesh
To double the production and export of shrimp and fish to 4.2 million metric tons and US$ 2.4 Billion respectively.
Fisheries Policy 2015-20 Read more
47 Andhra Pradesh For updated information, please visit www.ibef.orgSTATE ACTS AND POLICIES … (4/4)
Objectives
To make Andhra Pradesh one of the most preferred destinations for seed industry.
Andhra Pradesh State
Mega Seed Park Policy, To attract new Investments in seed industry worth Rs 3,000 crore (US$ 0.45 billion) by 2023.
2018
To create additional employment opportunity for 40,000 personnel by 2023. Read more
Designated Technology To incentivise real estate developers to build larger world class Information Technology (IT) office spaces.
Parks (DTP) Policy,
2017-2020 To reduce the approval time for office spaces for IT companies from 50 days to 21 days.
To attract investments worth Rs 30,000 crore (US$ 4.47 billion) in manufacturing of electric vehicles (EVs) in the
Electric Mobility Policy- next five years and create 60,000 jobs
2018-2023
To replace public transport buses in four cities to electric buses by 2024 and across the state by 2030.
Animation, Visual To attract investments worth Rs 6,400 crore (US$ 954.65 million) in the sector by 2020.
Effects, Gaming and
Comics (AVGC) Policy To bridge the demand and supply gap of human resources and capture a larger share of outsourced work in
2018-2020 gaming, animation, media and entertainment sector.
48 Andhra Pradesh For updated information, please visit www.ibef.orgANDHRA PRADESH
ANNEXURE…(1/2) - SOURCES

                          Data                                                                 Sources

     GSDP (state)                                                            Economic Survey 2018-19 (Andhra Pradesh)

     Per capita GSDP figures                                                 Economic Survey 2018-19 (Andhra Pradesh)

     GSDP (India)                                  Second Advance Estimate of National Income – Ministry of Statistics and Programme Implementation

     Installed power capacity (MW)                                         Central Electricity Authority, as of November 2019

     Wireless subscribers (No)                                        Telecom Regulatory Authority of India, as of September 2019

     Internet subscribers (Mn)                                           Telecom Regulatory Authority of India, as of June 2019

     National highway length (km)                             NHAI, Roads and Building Department-Government of India, as of March 2018

     Major and minor ports (No)                                                         Indian Ports Association

     Airports (No)                                                                     Airports Authority of India

     Literacy rate (%)                                                                       Census 2011

     Birth rate (per 1,000 population)                                                    SRS Bulletin 2017
     Cumulative FDI equity inflows (US$ billion)                        Department for Promotion of Industry and Internal Trade
     Operational PPP projects (No)                                          DEA , Ministry of Finance, Government of India

     Operational SEZs (No)                         Notified as of November 2019, Ministry of Commerce & Industry, Department of Commerce, November
                                                                                                 2019

50       Andhra Pradesh                                                                        For updated information, please visit www.ibef.org
ANNEXURE…(2/2) - EXCHANGE RATES
Exchange Rates (Fiscal Year) Exchange Rates (Calendar Year)
Year INR INR Equivalent of one US$ Year INR Equivalent of one US$
2004–05 44.95 2005 44.11
2005–06 44.28 2006 45.33
2006–07 45.29 2007 41.29
2007–08 40.24 2008 43.42
2008–09 45.91
2009 48.35
2009–10 47.42
2010 45.74
2010–11 45.58
2011 46.67
2011–12 47.95
2012 53.49
2012–13 54.45
2013 58.63
2013–14 60.50
2014 61.03
2014-15 61.15
2015 64.15
2015-16 65.46
2016-17 67.09 2016 67.21
2017-18 64.45 2017 65.12
2018-19 69.89 2018 68.36
2019-20 70.49 2019 69.89
Source: Reserve Bank of India, Average for the year
51 Andhra Pradesh For updated information, please visit www.ibef.orgDISCLAIMER
India Brand Equity Foundation (IBEF) engaged TechSci Research to prepare this presentation and the same has been prepared by TechSci
Research in consultation with IBEF.
All rights reserved. All copyright in this presentation and related works is solely and exclusively owned by IBEF. The same may not be reproduced,
wholly or in part in any material form (including photocopying or storing it in any medium by electronic means and whether or not transiently or
incidentally to some other use of this presentation), modified or in any manner communicated to any third party except with the written approval of
IBEF.
This presentation is for information purposes only. While due care has been taken during the compilation of this presentation to ensure that the
information is accurate to the best of TechSci Research and IBEF’s knowledge and belief, the content is not to be construed in any manner
whatsoever as a substitute for professional advice.
TechSci Research and IBEF neither recommend nor endorse any specific products or services that may have been mentioned in this presentation
and nor do they assume any liability or responsibility for the outcome of decisions taken as a result of any reliance placed on this presentation.
Neither TechSci Research nor IBEF shall be liable for any direct or indirect damages that may arise due to any act or omission on the part of the user
due to any reliance placed or guidance taken from any portion of this presentation.
52 Andhra Pradesh For updated information, please visit www.ibef.orgYou can also read