Myeloarchitectonic Asymmetries of Language Regions in the Human Brain - Oxford Academic Journals
←
→
Page content transcription
If your browser does not render page correctly, please read the page content below
Cerebral Cortex, September 2021;31: 4169–4179

                                                                              https://doi.org/10.1093/cercor/bhab076
                                                                              Advance Access Publication Date: 7 April 2021
                                                                              Original Article

ORIGINAL ARTICLE

Myeloarchitectonic Asymmetries of Language Regions

                                                                                                                                                         Downloaded from https://academic.oup.com/cercor/article/31/9/4169/6213946 by guest on 25 December 2021
in the Human Brain
Di Yuan1,2 , Daiyi Luo1,2 , Veronica P. Y. Kwok2 , Yulong Zhou1,2 ,
Haoyue Tian1,2 , Qianqian Yu2 , Jie An3 , Jia-Hong Gao4,5 , Shijun Qiu3 and
Li Hai Tan1,2
1 Guangdong-Hongkong-Macau        Institute of CNS Regeneration and Ministry of Education CNS Regeneration
Collaborative Joint Laboratory, Jinan University, Guangzhou 510632, China, 2 Center for Language and Brain,
Shenzhen Institute of Neuroscience, Shenzhen 518060, China, 3 Department of Radiology, First Affiliated
Hospital of Guangzhou University of Chinese Medicine, Guangzhou 510400, China, 4 McGovern Institute for
Brain Research, Peking University, Beijing, China and 5 Center for MRI Research, Peking University, Beijing
100871, China

Address correspondence to Dr. Li Hai Tan. Email: tanlh@sions.cn, Dr. Shijun Qiu. Email: qiu-sj@163.com, or Dr. Jia-Hong Gao. Email: jgao@pku.edu.cn

Abstract
One prominent theory in neuroscience and psychology assumes that cortical regions for language are left hemisphere
lateralized in the human brain. In the current study, we used a novel technique, quantitative magnetic resonance imaging
(qMRI), to examine interhemispheric asymmetries in language regions in terms of macromolecular tissue volume (MTV)
and quantitative longitudinal relaxation time (T1) maps in the living human brain. These two measures are known to
ref lect cortical myeloarchitecture from the microstructural perspective. One hundred and fifteen adults (55 male, 60 female)
were examined for their myeloarchitectonic asymmetries of language regions. We found that the cortical myeloarchitecture
of inferior frontal areas including the pars opercularis, pars triangularis, and pars orbitalis is left lateralized, while that of
the middle temporal gyrus, Heschl’s gyrus, and planum temporale is right lateralized. Moreover, the leftward lateralization
of myelination structure is significantly correlated with language skills measured by phonemic and speech tone awareness.
This study reveals for the first time a mixed pattern of myeloarchitectonic asymmetries, which calls for a general theory to
accommodate the full complexity of principles underlying human hemispheric specialization.

Key words: asymmetry, language, microstructure, myelination, qMRI

Introduction                                                                  respect to both brain structure and brain function (Hugdahl and
Research on Broca’s and Wernicke’s aphasia resulting from cere-               Westerhausen 2010; Bishop 2013).
bral damage indicates that language processing is predomi-                       The structure indices of brain asymmetry include microstruc-
nantly accomplished by the left hemisphere of the human brain                 tural features and macroscopic dimensions. The microstructural
(Broca 1861; Wernicke 1969). This observation has been cor-                   studies focus on the number and density of cells, number of
roborated by various kinds of brain asymmetry studies with                    spines, degree of arborization of dendrites, and axons, which

© The Author(s) 2021. Published by Oxford University Press. All rights reserved. For permissions, please e-mail: journals.permission@oup.com.
This is an Open Access article distributed under the terms of the Creative Commons Attribution Non-Commercial License (http://creativecommons.org/
licenses/by-nc/4.0/), which permits non-commercial re-use, distribution, and reproduction in any medium, provided the original work is properly cited.
For commercial re-use, please contact journals.permissions@oup.com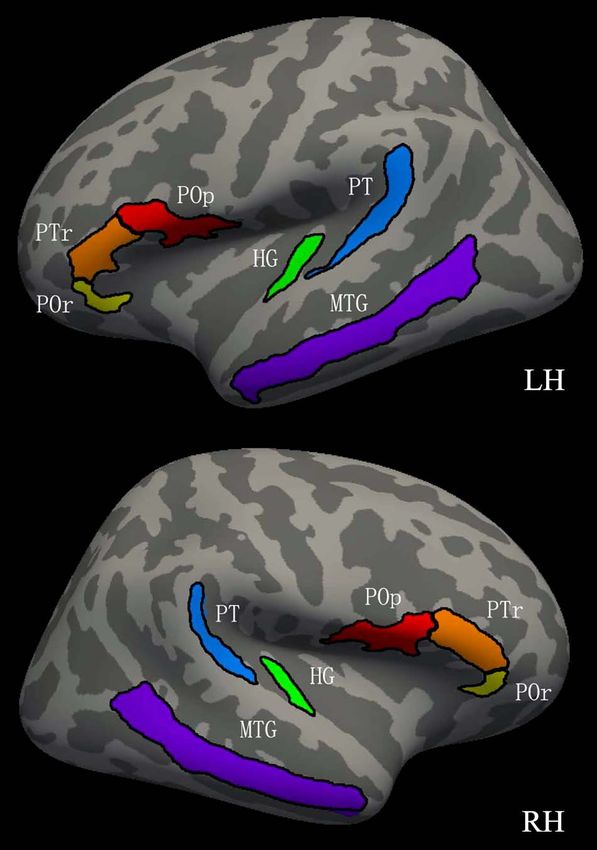
4170      Cerebral Cortex, 2021, Vol. 31, No. 9

usually require postmortem analysis and histological sections          task. They found that the overall distribution of language later-
(Amunts 2010). For example, Amunts et al. (1999) measured              alization was 7.5% being the right hemisphere and 92.5% being
the cell densities of 10 human brains in serial histological           the left hemisphere.
sections stained for cell body. They found that area 44, which             Despite a large number of studies demonstrating the left
belongs to Broca’s area, was left lateralized in all brains.           lateralization in language-related regions, there is evidence indi-
Uylings et al. (2006) reported a left-lateralized neuron density       cating otherwise. Wada et al. (1975) found that the surface
in Nissl-stained sections of area 44 from 10 adult brains and          of pars opercularis and the posterior portion of the pars tri-
that the lateralization value of five male brains reached a            angularis together was significantly larger on the right side
significant level. Using DiI tract-tracing, a tracing method with      than on the left side in 100 adult postmortem brains, though a
a fluorescent lipophilic cationic indocarbocyanine dye, Galuske        reanalysis of these data by Witelson and Kigar (1988) revealed
et al. (2000) demonstrated the inter-hemisphere asymmetry              a non-significant (P = 0.1) left-lateralized intrasulcal anatomy of
of interconnectivity within area 22, a site known to play an           this region. Moreover, a significant rightward asymmetry of the
important role during auditory signal processing. They found           white matter was found below the planum temporale (Barrick

                                                                                                                                               Downloaded from https://academic.oup.com/cercor/article/31/9/4169/6213946 by guest on 25 December 2021
that although the cluster diameter of area 22 was similar in           et al. 2004). The temporoparietal pathway connecting the supe-
both hemispheres, their spacing was about 20 percent larger in         rior temporal gyrus to the superior parietal lobule was also right-
the left hemisphere implying more neuropil could be included           lateralized (Barrick et al. 2007). People with different dominant
in the left than in the right to support language functions.           hands, ages, or genders showed different patterns of language
Subsequent research replicated the stronger connectivity in the        lateralization (Foundas et al. 1998; Knecht et al. 2000; Uylings
left hemisphere by indicating that the size of pyramidal cells in      et al. 2005; Uylings et al. 2006). In some language tasks, strong
large layer III is larger in regions of the primary and secondary      neural activities were also found on the right hemisphere, such
auditory cortex, as larger cell bodies might be needed to support      as superior temporal cortex (Lattner et al. 2005), dorsolateral cor-
longer axons (Hutsler 2003; Hutsler and Galuske 2003).                 tex and orbitobasal (Wildgruber et al. 2005), and fusiform gyrus
    The macroscopic studies focus on the shape, volume, size           (Tan et al. 2001; Mei et al. 2015; Yang et al. 2019; Cao et al. 2019)
of sulci, gyri, and lobe of brain, which are conducted in vivo or      on the right side. Especially, since lexical tone is used to convey
in vitro. For example, Geschwind and Levitsky’s autopsy study          grammatical or word meanings in more than half of the world’s
suggested that the size of planum temporale was larger on the          languages (Yip 2002), the functional anatomy and lateralization
left hemisphere than on the right (Geschwind and Levitsky 1968;        of lexical tone processing in speech has been intensively inves-
Geschwind and Galaburda 1985). Compared to autopsy studies,            tigated. A bi-lateralized cortical network is shown to mediate
MRI techniques are well suited to measure the entire morphol-          speech tone, which involves superior temporal regions, inferior
ogy of surface and intrasulcal anatomy (Keller et al. 2009), and       prefrontal regions, and the insula (Gandour et al. 2000; Hsieh
the left lateralization of language-related brain structure seems      et al. 2001; Klein et al. 2001; Wong 2002; Liu et al. 2006; Luo
to emerge in white as well as gray matter. In an MRI study with 12     et al. 2006; Ren et al. 2009; Li et al. 2010; Xi et al. 2010; Nan and
participants, the extent of extrasulcal and intrasulcal portions       Friederici 2013; Chang et al. 2014; Yu et al. 2014; Ge et al. 2015;
of cortex in anterior speech region (pars opercularis and pars         Kwok et al. 2016, 2017; Liang and Du 2018).
triangularis) and planum temporale were found to be signifi-               In this study, we examined the asymmetry of language
cantly larger in the left hemisphere than in the right (Falzi et al.   regions from a microstructural perspective in living human
1982). Penhune et al. (1996) used a probabilistic mapping method       brains. We used a novel technique—quantitative MRI (qMRI)—to
to calculate the volumes of white and gray matter. They found          quantitatively estimate the brain macromolecular tissue volume
that the white matter volumes of the primary auditory cortex           (MTV) and quantitative longitudinal relaxation time (T1) maps
were larger on the left hemisphere than on the right. A VBM-DTI        (Lutti et al. 2014; Gomez et al. 2017). MTV quantifies myelin vol-
study with 109 participants demonstrated leftward gray matter          ume on the basis that the brain macromolecules are principally
asymmetry of the planum temporale and Heschl’s gyri as well            cell membranes and proteins, and T1 suggests a mechanism
as leftward white matter fractional anisotropy asymmetries of          of microstructural variation such as dendrite development,
the arcuate fasciculus (Takao et al. 2011).                            myelination, and oligodendrocytes (Mezer et al. 2013; Lutti et al.
    The language-related brain areas are also suggested to be          2014; Stüber et al. 2014; Gomez et al. 2017; Luo et al. 2019).
functionally left lateralized. Most neural activities are localized    Therefore, MTV and T1 quantify cortical myeloarchitecture
in the left, rather than right, hemisphere during language tasks.      mapping from the microstructural perspective (Lutti et al.
These neural activities emerged at the regions including but not       2014; Gomez et al. 2017). The interhemispheric asymmetries
limited to left anterior temporal lobe, medial prefrontal cortex       of language regions including pars opercularis (POp), pars
(Pylkkänen 2019), left inferior frontal gyrus (Xue et al. 2005;        triangularis (PTr), pars orbitalis (POr), anterior transverse
Xue et al. 2006; Rodd et al. 2015), and left middle fusiform (Liu      temporal gyrus (Heschl’s gyrus, HG), planum temporale (PT),
et al. 2008; Tan et al. 2011). Such lateralization could be estab-     and middle temporal gyrus (MTG) were examined. Two cohorts
lished even in childhood (Berl et al. 2014; Olulade et al. 2020).      of participants from Beijing and Guangzhou were recruited and
More straightforward evidence comes from inter-hemisphere              examined with different MRI scanners to test the reproducibility
lateralization studies. For example, brain regions including lat-      of any observed lateralization effect(s). To examine the
eral orbital gyrus, prefrontal dorsolateral region, inferior frontal   specific functions of those language regions, we tested Beijing
gyrus, superior and middle temporal gyrus, lateral extrastriate        participants’ language skills to elucidating the myelination-
region showed significantly more activation voxels in the left         behavior relationship. Based on the literature, we hypothesized
hemisphere than in the right hemisphere during a semantic              that language regions may show a mixed-pattern of laterality
task (Frost et al. 1999). Moreover, by conducting functional tran-     from the microstructural perspective and the laterality index
scranial Doppler-ultrasonography (fTCD), Knecht et al. (2000)          of myelination structure is related to language skills. Moreover,
compared perfusion changes of the two middle cerebral arteries         since previous studies showed a gender effect on functional
within the potential language areas during a word generation           and structural asymmetries (Shaywitz et al. 1995; Amunts et al.
Myeloarchitectonic Asymmetries of Human Brain Yuan et al. 4171
Table 1 Demographic information and behavioral performance of participants
Guangzhou Beijing
Number of participants 65 50
Mean age 24.0 22
Age range 18 ∼ 35 19 ∼ 28
Gender 36 M; 29F 19 M; 31F
Phoneme counting task (max = 30) / 10.6 (4.5)
Phoneme deletion task (max = 30) / 24.7 (3.7)
Monosyllable task (max = 50) / 45.1 (5.9)
Bisyllabic words task (max = 50) / 43.3 (6.1)
Quadrisyllabic Chinese phrases task (max = 50) / 49.2 (2.0)
Downloaded from https://academic.oup.com/cercor/article/31/9/4169/6213946 by guest on 25 December 2021
1999; Uylings et al. 2006; Bogolepova and Malofeeva 2000, 2001), Freesurfer 6.0 recon-all procedure (Reuter et al. 2012). They were
we also examined whether sex influences lateralization from spatially matched with MTV maps and had excellent gray/white
the microstructural perspective in the current study. matter contrast.
Destrieux atlas in FreeSurfer was used to automatically label
the cortex (Destrieux et al. 2010). The boundaries of the labels
Guangzhou Data are customized to each participant based on curvature statistics
Materials and Methods stored in the ROI atlas. Such a method to parcellate the cortex
has been validated using a jackknifing procedure (Fischl et al.
Participants 2004). Destrieux atlas has 74 ROIs on each hemisphere. In the
Sixty-five Chinese native speakers were recruited from the current study, twelve regions of interest (ROIs) were selected
colleges in Guangzhou (36 male; 29 female; age 24.0 ± 4.5 y, with six ROIs at each hemisphere: pars opercularis (POp), pars
Table 1). All the participants were strongly right handed as triangularis (PTr), pars orbitalis (POr), anterior transverse tem-
measured by the Handedness Inventory (Snyder and Harris poral gyrus (Heschl’s gyrus, HG), planum temporale (PT), and
1993), with normal or correct-to-normal vision, and with no middle temporal gyrus (MTG), as shown in Figure 1. Among
history of psychiatric or neurological disorders. They gave them, POp and PTr constitute the conventional Broca’s area,
informed consent before the experiment and were each paid which, along with MTG, are essential sites of language func-
after the experiment. The study was approved by the ethics tions (Bishop 2013; Tremblay and Dick 2016). HG and PT were
committee at the Shenzhen Institute of Neuroscience and in chosen as widely known anatomically asymmetric language-
accordance with the Declaration of Helsinki. relevant regions (Dorsaint-Pierre et al. 2006; Greve et al. 2013).
The planum temporale in the Destrieux atlas includes both the
Quantitative MRI Data Acquisition posterior horizontal segment and the posterior ascending ramus
QMRI measurements were guided by the protocols in Mezer et al. (i.e. PP). Researchers have demonstrated that these areas are
(2013, 2016) and Oishi et al. (2018). MRI data were measured by 3 T cytoarchitectonically or functionally homogeneous (Steinmetz
Siemens Magnetom Prisma scanner (Siemens Healthcare, Erlan- et al. 1989; Witelson et al. 1995; Binder et al. 1996). For each
gen, Germany) with a 64-channel head coil. The quantitative participant, ‘mri_convert’ command was used to convert the
MTV and T1 values were measured from spoiled gradient echo individual labeled template into the native MTV space. Then,
(SPGE) images with flip angles of 4◦ , 10◦ , 20◦ , and 30◦ (TR = 12 ms, mean MTV and T1 values across voxels within ROI for each
TE = 2.41 ms) at an in-plane resolution of 1 × 1 mm2 with a slice participant were computed.
thickness of 1 mm. Four spin-echo inversion recovery (SEIR)
images were also scanned, with an echo-planar imaging (EPI) Statistical Analysis
read-out, a slab inversion pulse, and spectral fat suppression, to The Laterality Index (LI) was used to quantify the standardized
remove field inhomogeneities. The images were collected with difference of MTV or T1 between left and right hemispheres. The
inversion times of 50, 200, 400, 1200, and 2400 ms (TE = 49 ms, formula is as follows:
TR = 3000 ms) at an in-plane resolution of 2.2 × 2.2 mm2 with a
slice thickness of 4 mm. (LH − RH)
LI = (1)
(LH + RH)
QMRI Data Analysis
Both SPGE images and SEIR images were processed by using Where LH is the MTV or T1 from the left hemisphere and RH
the mrQ software package (https://github.com/mezera/mrQ) to is the MTV or T1 from the right hemisphere. LI ranges from −1
generate maps of macromolecular tissue volume (MTV) and (completely right lateralized) to +1 (completely left lateralized).
quantitative T1 for each participant. SPGE images and low- A Wilcoxon signed-rank test with false discovery rate (FDR)
resolution unbiased T1 maps derived from SEIR images were correction (Benjamini–Hochberg procedure, Benjamini and
combined (Barral et al. 2010) to estimate the unbiased T1 maps Hochberg 1995) was used at each ROI to examine the difference
and proton density maps (Fram et al. 1987). MTV maps were between LI and zero. We also measured the percentage of
calculated from proton density maps. MTV quantifies the non- (LH-RH)/RH which refers to the magnitude of the difference
water volume in each voxel, and the complementary volume between the left side and the right side (Galuske et al. 2000).
is water (cerebrospinal fluid was approximated to water). T1- A Wilcoxon signed-rank test with FDR correction was used at
weighted images were transformed into cortical surface using each ROI to examine the difference percentage and zero. The4172 Cerebral Cortex, 2021, Vol. 31, No. 9
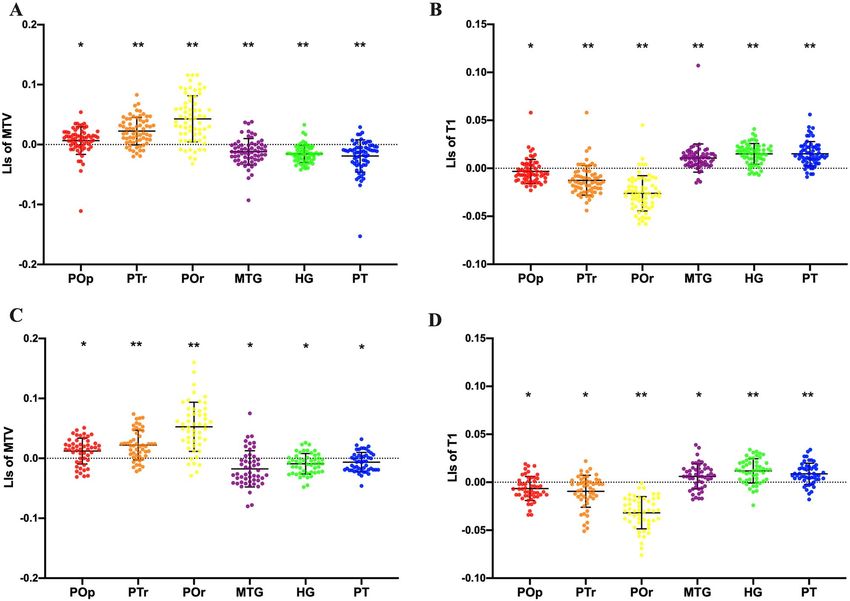
We then calculated LIs of T1 to examine whether this
cortical myeloarchitectonic mapping would show a simi-
lar lateralization pattern as MTV. LIs of T1 were signifi-
cantly smaller than zero in inferior frontal areas including
the POp [Z = −3.081, pcorr = 0.0021, M = −0.0033, SD = 0.0125,
95%CI = [−0.0064, −0.0002], effect size = 0.38], PTr [Z = −5.586,
pcorr < 0.0001, M = −0.0126, SD = 0.0153, 95%CI = [−0.0164, −0.0088],
effect size = 0.69], and POr [Z = −6.543, pcorr < 0.0001, M = −0.0262,
SD = 0.0184, 95%CI = [−0.0307, −0.0216], effect size = 0.81], but
were significantly larger than zero in temporal areas includ-
ing the MTG [Z = 5.965, pcorr < 0.0001, M = 0.0107, SD = 0.0147,
95%CI = [0.0070, 0.0143], effect size = 0.74], HG [Z = 6.582, pcorr <
0.0001, M = 0.0151, SD = 0.0108, 95%CI = [0.0124, 0.0177], effect
Downloaded from https://academic.oup.com/cercor/article/31/9/4169/6213946 by guest on 25 December 2021
size = 0.82], and PT [Z = 6.571, pcorr < 0.0001, M = 0.0152, SD = 0.0128,
95%CI = [0.0120, 0.0183], effect size = 0.82] (see Fig. 2B).
The difference percentage of MTV and T1 showed the
same lateralization patterns as LI of MTV and T1 (Fig. S1A&B).
Specifically, MTV in Pop, PTr, and POr was 1.4%, 4.7%, and
9.3% larger in left than right hemisphere, respectively [POp:
Z = 3.568, pcorr = 0.0004; PTr: Z = 5.852, pcorr < 0.0001; POr: Z = 6.205,
pcorr < 0.0001], while MTV in MTG, HG, and PT was 2.3%, 3%,
and 3.6% smaller in left than right hemisphere, respectively
[MTG: Z = −4.101, pcorr < 0.0001; HG: Z = −5.957, pcorr < 0.0001; PT:
Z = −5.466, pcorr < 0.0001]. In addition, T1 in Pop, PTr, and POr
was 0.6%, 2.5%, and 5% smaller in left than right hemisphere,
respectively [POp: Z = −3.120, pcorr = 0.0018; PTr: Z = −5.555,
pcorr < 0.0001; POr: Z = −6.532, pcorr < 0.0001], while T1 in MTG,
HG, and PT was 2.2%, 3.1%, and 3.1% larger in left than right
hemisphere, respectively [MTG: Z = 6.022, pcorr < 0.0001; HG:
Z = 6.604, pcorr < 0.0001; PT: Z = 6.630, pcorr < 0.0001].
Taken together, both MTV and T1 data converge to indicate
that the cortical myelination of the POp, PTr, and POr is leftward
Figure 1. The location of selected ROIs on an inf lated cortical surface. The yellow and that of the MTG, PT, and HG is rightward. Percentages of
area represents pars orbitalis; the orange area represents pars triangularis; the the individuals in Guangzhou showing the same lateralization
red area represents pars opercularis; the green area represents Heschl’s gyrus;
pattern ranged from 62% to 90% (Table 3). We also examined
the blue area represents planum temporale; the purple area represents middle
gender effects in terms of LI and difference percentage within
temporal gyrus. LH, left hemisphere; RH, right hemisphere.
each ROI by using Mann–Whitney U tests. The results revealed
that none of the ROIs showed a significant gender difference
(ps > 0.05).
95% confidence interval (95% CI) and effect size were calculated.
The gender effect of lateralization measurements (i.e. LI and
difference percentage) was examined by the Mann–Whitney U
Beijing Data
test.
Materials and Methods
Participants
Results
Fifty Chinese were recruited from the colleges in Beijing (19
Mean MTV and T1 values across voxels within each ROI are male; 31 female; age 22 ± 2.1 y, Table 1). They were bilingual in
shown in Table 2. We begin with the one sample Wilcoxon Chinese and English. All the participants were strongly right
signed-rank test with false discovery rate (FDR) correction at handed as measured by the Handedness Inventory (Snyder and
each ROI to examine the difference between LI of MTV and zero. Harris 1993), with normal or correct-to-normal vision, and with
LIs of MTV were significantly larger than zero in inferior frontal no history of psychiatric or neurological disorders. They gave
areas including the POp [Z = 3.510, pcorr = 0.0004, M = 0.0066, informed consent before the experiment and were each paid
SD = 0.0230, 95%CI = [0.0009, 0.0123], effect size = 0.44], PTr after the experiment.
[Z = 5.846, pcorr < 0.0001, M = 0.0224, SD = 0.0228, 95%CI = [0.0167,
0.0280], effect size = 0.73], and POr [Z = 6.192, pcorr < 0.0001,
M = 0.0428, SD = 0.0385, 95%CI = [0.0333, 0.0524], effect size = 0.77], Quantitative MRI Data Acquisition
while they were significantly smaller than zero in tem- QMRI parameters were from the protocols in Mezer et al. (2013,
poral areas including the MTG [Z = −4.129, pcorr < 0.0001, 2016). MRI data were measured by 3 T Discovery MR750 system
M = −0.0120, SD = 0.0219, 95%CI = [−0.0174, −0.0066], effect (General Electric Healthcare Milwaukee, WI, USA) with an 8-
size = 0.51], HG [Z = −5.947, pcorr < 0.0001, M = −0.0156, SD = 0.0144, channel head coil. The quantitative MTV and T1 values were
95%CI = [−0.0192, −0.0120], effect size = 0.74], and PT [Z = −5.494, measured from spoiled gradient echo (SPGE) images with flip
pcorr < 0.0001, M = −0.0192, SD = 0.0269, 95%CI = [−0.0258, −0.0125], angles of 4◦ , 10◦ , 20◦ , and 30◦ (TR = 14 ms, TE = 2 ms) at an in-
effect size = 0.68] (see Fig. 2A). plane resolution of 1 × 1 mm2 with a slice thickness of 1 mm. ToMyeloarchitectonic Asymmetries of Human Brain Yuan et al. 4173
Table 2 Mean MTV and T1 values across voxels within each ROI
Left hemisphere Right hemisphere
MTV T1 MTV T1
mean (SD) mean (SD) mean (SD) mean (SD)
Male Female Male Female Male Female Male Female
Guangzhou (N = 65, male = 36, female = 29)
POp 0.197 (0.011) 0.195 (0.016) 1.461 (0.034) 1.465 (0.061) 0.194 (0.010) 0.194 (0.018) 1.473 (0.027) 1.470 (0.036)
PTr 0.194 (0.012) 0.199 (0.035) 1.455 (0.049) 1.453 (0.080) 0.186 (0.011) 0.190 (0.038) 1.490 (0.050) 1.493 (0.049)
POr 0.196 (0.013) 0.203 (0.034) 1.428 (0.052) 1.420 (0.044) 0.182 (0.012) 0.185 (0.032) 1.504 (0.049) 1.497 (0.054)
MTG 0.179 (0.013) 0.192 (0.050) 1.499 (0.030) 1.458 (0.038) 0.184 (0.012) 0.197 (0.066) 1.467 (0.033) 1.428 (0.077)
Downloaded from https://academic.oup.com/cercor/article/31/9/4169/6213946 by guest on 25 December 2021
HG 0.195 (0.010) 0.199 (0.018) 1.499 (0.034) 1.466 (0.040) 0.202(0.011) 0.204 (0.015) 1.452 (0.032) 1.426 (0.042)
PT 0.198 (0.013) 0.201 (0.020) 1.477 (0.043) 1.454 (0.037) 0.206 (0.012) 0.210 (0.034) 1.430 (0.032) 1.413 (0.036)
Beijing (N = 50, male = 19, female = 31)
POp 0.187 (0.014) 0.181 (0.014) 1.444 (0.059) 1.452 (0.049) 0.183 (0.010) 0.177 (0.013) 1.462 (0.044) 1.471 (0.039)
PTr 0.190 (0.012) 0.184 (0.015) 1.406 (0.060) 1.415 (0.045) 0.181 (0.011) 0.177 (0.014) 1.433 (0.062) 1.442 (0.049)
POr 0.196 (0.014) 0.196 (0.018) 1.378 (0.053) 1.376 (0.049) 0.177 (0.017) 0.177 (0.017) 1.467 (0.071) 1.467 (0.051)
MTG 0.187 (0.012) 0.185 (0.017) 1.439 (0.039) 1.431 (0.028) 0.194 (0.010) 0.191 (0.013) 1.415 (0.043) 1.418 (0.034)
HG 0.201 (0.012) 0.191 (0.013) 1.346 (0.050) 1.361 (0.030) 0.205 (0.013) 0.199 (0.013) 1.312 (0.046) 1.331 (0.040)
PT 0.197 (0.010) 0.185 (0.012) 1.394 (0.034) 1.408 (0.029) 0.194 (0.010) 0.193 (0.012) 1.371 (0.032) 1.383 (0.040)
Figure 2. LI of qMRI measures in each ROI. (A) LIs of MTV within each ROI in Guangzhou. (B) LIs of T1 within each ROI in Guangzhou. (C) LIs of MTV within each ROI in
Beijing. (D) LIs of T1 within each ROI in Beijing. The error bars indicate standard deviations. POp, pars opercularis; PTr, pars triangularis; POr, pars orbitalis; HG, Heschl’s
gyrus; PT, planum temporale; MTG, middle temporal gyrus. ∗ P < 0.05, ∗∗ P < 0.0001.4174 Cerebral Cortex, 2021, Vol. 31, No. 9
Table 3 The percentage of individuals who showed leftward/rightward lateralization in each ROI
ROI Guangzhou (N = 65) Beijing (N = 50)
MTV T1 MTV T1
Left-lateralized POp 62% 62% 72% 72%
PTr 76% 78% 80% 68%
POr 82% 90% 88% 100%
Right-lateralized MTG 68% 90% 76% 72%
HG 86% 86% 70% 82%
PT 76% 90% 60% 80%
Downloaded from https://academic.oup.com/cercor/article/31/9/4169/6213946 by guest on 25 December 2021
remove field inhomogeneities, four spin-echo inversion recov- at a normal speaking rate. All stimuli were typed in Chinese
ery (SEIR) images were scanned, with an echo-planar imaging characters and pinyin orthography. Recordings were made in
(EPI) read-out, a slab inversion pulse, and spectral fat suppres- a soundproof booth using a Neumann M149 microphone and a
sion. The images were collected with inversion times of 50, 200, Cubase 9.5 pro software. The announcer sat and the microphone
400, 1200, and 2400 ms (TE = 43 ms, TR = 3000 ms) at an in-plane was maintained at a distance of 12 cm from his lip. The stimuli
resolution of 2 × 2 mm2 with a slice thickness of 4 mm. were then edited using Adobe Audition software 7.0 (Adobe
Systems, Inc.) to achieve a constant duration for each type of
stimuli: 500 ms for monosyllable; 1000 mm for bisyllabic words,
Data Analysis
and 1900 ms for quadrisyllabic Chinese phrases. These edited
To investigate whether the aforementioned pattern of lateral-
stimuli were used in the following three tasks.
ization would be replicable, the same qMRI data analysis and
statistical analysis were conducted on Beijing data. (1) Monosyllable task
To examine the myelination-behavior relationship, we used
the Spearman correlation to compute the correlation between In each trial, participants heard a sequence of three mono-
language task performance (phoneme awareness tasks and tone syllables and were asked which of the three monosyllables differ
awareness tasks described below) and microstructural measure- from the others in terms of their tones. The onset and rhyme of
ments (i.e. MTV and T1) within each ROI on both hemispheres. three items in each trial were entirely distinct from one another.
We also examine the correlation between language task perfor- There were 50 trials in this task. The accurate rate of each
mance and lateralization measurements (i.e. LI and difference participant was recorded.
percentage) within each ROI. Three participants failed to com- (2) Bisyllabic words task
plete the phoneme awareness tasks. The tone awareness tasks
were performed a few months after the brain scan and then only In each trial, participants were asked whether the tones of
12 participants helped complete the task. the two syllables were the same (e.g. /sheng1/ /yin1/, sound)
or different (e.g. /jie2/ /gou4/, structure). The bisyllabic words
included highly used verbs, adjectives, and nouns with the
Behavioral Tasks
frequency of occurrence not fewer than 90 per million according
Phonological awareness task. Two phonological awareness
to the Modem Chinese Frequency Dictionary. To avoid sandhi
tasks were used in experiment 1: phoneme counting task and
effect, tone 3 was excluded for the same-tone trials. All four
phoneme deletion task. These tasks were presented in English.
tones were included in different-tone trials. There were 50 trials
(1) Phoneme counting task in total, 25 for same tone and 25 for different tone. The accurate
rate of each participant was recorded.
Participants were instructed to answer the number of
phonemes a word contains after they heard an English word (3) Quadrisyllabic Chinese phrases task
read out by the experimenter (e.g. the word ‘cake’ contains 3
In each trial, participants were asked whether the ending of
phonemes, /k/, / eI/, and / k/). Thirty words were administered to
a quadrisyllabic Chinese phrase is in an incongruous tone. In
the participants individually. Response accuracy was recorded
incongruous-trials, the ending of quadrisyllabic Chinese phrase
by the experimenter.
had the same onset and rhyme as the conventional one. The
(2) Phoneme deletion task quadrisyllabic Chinese phrases were also highly used. Thirty-
three participants who were native to the purpose of the experi-
Participants were instructed to delete a specific phoneme ment were asked to give the phonetic notation of each character
from a word they heard and then pronounced the rest of the in each quadrisyllabic Chinese phrase and the average accuracy
word (e.g. the phoneme /p/ was required to be deleted from the was 94.85%. There were 50 trials in total, 25 for congruous-
word ‘pear’, the right answer is / e∂/). Each participant completed tone and 25 for incongruous-tone. The accurate rate of each
30 words, and the accurate rate of the 30 answers was recorded. participant was recorded.
Tone awareness task. Three tone awareness tasks were used
in experiment 1: monosyllable task, bisyllabic words task, and
Results
quadrisyllabic Chinese phrases task. Three types of auditory
stimuli were prepared: monosyllable, bisyllabic words, and LIs of MTV were significantly larger than zero in inferior frontal
quadrisyllabic Chinese phrases. All stimuli were orally produced areas including the POp [Z = 3.375, pcorr = 0.0011, M = 0.0121,
by a professional male announcer (27 years old) in Mandarin SD = 0.0216, 95%CI = [0.0060, 0.0183], effect size = 0.48], PTrMyeloarchitectonic Asymmetries of Human Brain Yuan et al. 4175
[Z = 4.939, pcorr < 0.0001, M = 0.0220, SD = 0.0249, 95%CI = [0.0151, MTV in POr [r = 0.747, pcorr = 0.030]. Additionally, the correlation
0.0292], effect size = 0.70], and POr [Z = 5.797, pcorr < 0.0001, between difference percentage of MTV/T1 and language task
M = 0.0526, SD = 0.0410, 95%CI = [0.0409, 0.0642], effect size = 0.82], performance showed similar results (see Table S8–S9). These
indicating a reliable left lateralization. LIs of MTV were results indicated that the degree of leftward lateralization is pos-
significantly smaller than zero in temporal areas including itively related to language skills including phoneme awareness
the MTG [Z = −3.842, pcorr = 0.0002, M = −0.0176, SD = 0.0301, and tone awareness.
95%CI = [−0.0262, −0.0090], effect size = 0.54], HG [Z = −3.348,
pcorr = 0.0010, M = −0.0091, SD = 0.0170, 95%CI = [−0.0139, −0.0042],
effect size = 0.47], and PT [Z = −2.643, pcorr = 0.0008, M = −0.0063,
Discussion
SD = 0.0162, 95%CI = [−0.0109, −0.0017], effect size = 0.37], show- In the current study, we used the qMRI technique to investigate
ing a reliable rightward lateralization (see Fig. 2C). the myeloarchitectonic asymmetries of language regions as well
In addition, LIs of T1 were significantly smaller than zero in as the myelination-behavior relationship. A mixed pattern of
inferior frontal areas including the POp [Z = −3.264, pcorr = 0.0013, myeloarchitectonic asymmetries in the living human brain was
M = −0.0066, SD =0.0126, 95%CI = [−0.0101, −0.0030], effect
Downloaded from https://academic.oup.com/cercor/article/31/9/4169/6213946 by guest on 25 December 2021
found. While the lateralization of inferior frontal areas includ-
size = 0.46], PTr [Z = −3.464, pcorr = 0.0008, M = −0.0095, SD = 0.0166, ing the pars opercularis, pars triangularis, and pars orbitalis
95%CI = [−0.0142, −0.0047], effect size = 0.49], and POr [Z = −6.155, is leftward, that of the middle and superior temporal gyrus
pcorr < 0.0001, M = −0.0318, SD = 0.0168, 95%CI = [−0.0366, −0.0271], (Heschl’s gyrus and planum temporale) is rightward. There was
effect size = 0.87], but were significantly larger than zero in tem- no gender difference in lateralization. Moreover, the leftward
poral areas including the MTG [Z = 2.931, pcorr = 0.0034, M = 0.0061, lateralization of myelination structure is positively related to
SD = 0.0131, 95%CI = [0.0024, 0.0099], effect size = 0.41], HG language skills. In our study, the observed lateralization pattern
[Z = 4.965, pcorr < 0.0001, M = 0.0118, SD = 0.0126, 95%CI = [0.0083, was reproducible in two cohorts. Our results provided strong
0.0154], effect size = 0.70] and PT [Z = 4.558, pcorr < 0.0001, evidence that MR data from different instruments can be quite
M = 0.0088, SD = 0.0110, 95%CI = [0.0056, 0.0119], effect size = 0.64] comparable.
(see Fig. 2D). Our results of left-lateralized inferior frontal area are con-
The difference percentage of MTV and T1 showed the sistent with previous findings of area 44 and area 45 at the
same lateralization patterns as LI of MTV and T1 (Fig. S1C&D). microstructural level (Bogolepova and Malofeeva 2000, 2001;
Specifically, MTV in Pop, PTr, and POr was 2.6%, 4.6%, and Uylings et al. 2006). Previous studies showed gender differences
11.5% larger in left than right hemisphere, respectively [POp: in terms of neuronal density and volume based on small sample
Z = 3.499, pcorr = 0.0007; PTr: Z = 4.947, pcorr < 0.0001; POr: Z = 5.816, size (N < 20) (Amunts et al. 1999; Bogolepova and Malofeeva
pcorr < 0.0001], while MTV in MTG, HG, and PT was 3.3%, 1.7%, 2000, 2001; Uylings et al. 2006). However, in our study, gender
and 1.2% smaller in left than right hemisphere, respectively difference of microstructural lateralization was not observed in
[MTG: Z = −3.721, pcorr = 0.0004; HG: Z = −3.277, pcorr = 0.0013; PT: larger subject pools (N = 65 and 50).
Z = −2.582, pcorr = 0.0098]. In addition, T1 in Pop, PTr, and POr The right-lateralized myelination structure observed in the
was 1.3%, 1.8%, and 6.1% smaller in left than right hemisphere, temporal areas in our study appears to be inconsistent with
respectively [POp: Z = −3.263, pcorr = 0.0013; PTr: Z = −3.456, much of the prior data. Anderson et al. (1999) found that
pcorr = 0.0008; POr: Z = −6.154, pcorr < 0.0001], while T1 in MTG, axons of posterior superior temporal lobe had thicker myelin
HG, and PT was 1.3%, 2.4%, and 1.8% larger in left than right sheaths on the left side than on the right side. However, the
hemisphere, respectively [MTG: Z = 2.973, pcorr = 0.0029; HG: results came from eight subjects whose axons were observed
Z = 4.971, pcorr < 0.0001; PT: Z = 4.600, pcorr < 0.0001]. by electron microscopy. Other studies that measured clusters
Percentages of the individuals in Beijing showing the same spacing (Galuske et al. 2000) and pyramidal cell size (Hutsler and
lateralization pattern ranged from 60% to 100% (Table 3). No Galuske 2003; Hutsler 2003) only provide fractional features of
ROI showed a significant gender difference in LI and difference microstructure, which cannot reflect the myelination structure
percentage (ps > 0.05). as in our study. They are also severely limited by the sample
We also collapsed data from Beijing and Guangzhou and composition, sample size, and location of cells that can be
conducted the same data analysis on the lateralization mea- stained. The myeloarchitectonic asymmetries measured quanti-
surements (i.e. LI and difference percentage). The results can be tatively in our study reflected a general asymmetry of language
found in Table S7. processing. Although the lateralization measurements (i.e. LI
The demographic information and behavioral performance and difference percentage) indicated a rightward myelination
of participants are illustrated in Table 1. Spearman correlation structure within temporal area, we found a relationship between
was performed to examine the relationship between the leftward lateralization of temporal area and language skills.
microstructural measurements (i.e. MTV and T1) and language It has been suggested that the processing of phonemes in
task performance. The results were shown in Tables S5 and S6. one’s native language is left lateralized, whereas detection of
None of the P values in the Spearman correlation was survived prosody is right lateralized (Minagawa-Kawai et al. 2011). How-
from FDR corrections. ever, in our study, participants’ performance of tone awareness
Then, we conducted Spearman correlations on LIs of MTV/T1 task, as well as phoneme awareness task, were both related to
and language task performance to examine the myelination- leftward asymmetry values. We should note that the correla-
behavior relationship from the perspective of laterality index. tions between lateralization measurements and language skills
The results were shown in Tables 4 and 5. Phoneme deletion found in our study do not ensure a causal relationship, and it
accuracy showed a significant negative correlation with LI of should be cautious to interpret our data as being predictive of
T1 in POr [r = −0.327, pcorr = 0.050, Fig. 3A]. Phoneme counting participants’ reading and language test scores. Future research
accuracy showed significant negative correlations with LI of T1 should investigate the possibility of different cortical myeloar-
in POr [r = −0.420, pcorr = 0.018, Fig. 3B]. The bisyllabic words task chitectonic asymmetry patterns across cultures, and how these
accuracy showed a significant positive correlation with LI of asymmetries may be associated with brain activations in4176 Cerebral Cortex, 2021, Vol. 31, No. 9
Table 4 Correlation between LI of MTV/T1 in each ROI and phoneme awareness task performance (N = 47)
Phoneme deletion task Phoneme counting task
r Corrected P r Corrected P
LI of MTV POp 0.316 0.093 0.105 0.483
PTr 0.283 0.065 0.181 0.448
POr 0.284 0.080 0.221 0.816
MTG 0.125 0.403 0.218 0.426
HG 0.289 0.098 0.144 0.403
PT 0.326 0.150 0.171 0.377
LI of T1 POp −0.226 0.127 −0.138 0.426
PTr −0.363 0.072 −0.234 0.228
POr −0.327∗ 0.050 −0.420∗ 0.018
Downloaded from https://academic.oup.com/cercor/article/31/9/4169/6213946 by guest on 25 December 2021
MTG −0.346 0.051 −0.301 0.120
HG −0.305 0.056 −0.181 0.333
PT −0.294 0.054 −0.088 0.557
Note: ∗ corrected P < 0.05
Table 5 Correlation between LI of MTV/T1 in each ROI and tone awareness task performance (N = 12)
Monosyllable task Bisyllabic words task Quadrisyllabic Chinese phrases task
r corrected P r corrected P r corrected P
LI of MTV POp −0.213 0.761 0.007 0.983 −0.189 0.834
PTr 0.071 0.827 0.209 0.773 −0.315 0.954
POr 0.454 0.828 0.747∗ 0.030 0.000 1.000
MTG −0.184 0.679 −0.042 1.075 −0.101 0.906
HG 0.340 0.837 0.432 0.483 −0.454 0.828
PT 0.277 0.768 0.375 0.458 −0.202 1.060
LI of T1 POp 0.310 1.962 0.014 0.965 0.291 0.539
PTr −0.075 0.818 −0.232 1.404 0.404 0.579
POr −0.099 1.518 −0.450 0.858 0.046 0.887
MTG 0.203 1.584 0.069 0.997 0.309 0.656
HG 0.078 0.972 −0.209 1.030 0.593 0.252
PT 0.085 1.188 −0.124 1.052 0.255 0.509
Note: ∗ corrected P < 0.05
Figure 3. Myeloarchitectonic asymmetry and language task performance. (A) The correlation between the phoneme deletion task performance and LIs of T1 in POr. (B)
The correlation between the phoneme counting task performance and LIs of T1 in POr.Myeloarchitectonic Asymmetries of Human Brain Yuan et al. 4177
language tasks and with language impairments such as right hemispheres of the human brain in early post-natal
stuttering and dyslexia. ontogenesis. Neurosci Behav Physiol. 31:349–354.
Broca P. 1861. Remarques sur le siège de la faculté du langage
articulé, suivies d’une observation d’aphémie (perte de la
Supplementary Material parole). Bulletin et Memoires de la Societe anatomique de Paris.
Supplementary material can be found at Cerebral Cortex online. 6:330–357.
Cao F, Wang Z, Sussman BL, Yan X, Spray GJ, Rios V. 2019. L1
Reading experience influences L2 lexical learning: Spanish
Notes learning in Chinese speakers and English speakers. Neuro-
science. 416:255–267.
We thank Joey Tang and Chunqi Chang for their constructive
Chang HC, Lee HJ, Tzeng OJ, Kuo WJ. 2014. Implicit target substi-
comments. Please send correspondence to: Dr. Li Hai Tan at
tution and sequencing for lexical tone production in Chinese:
tanlh@sions.cn, Dr. Shijun Qiu at qiu-sj@163.com, or Dr. Jia-Hong
an fMRI study. PloS One. 9:e83126.
Gao at jgao@pku.edu.cn. Conflict of Interest: The authors declare
Downloaded from https://academic.oup.com/cercor/article/31/9/4169/6213946 by guest on 25 December 2021
Destrieux C, Fischl B, Dale A, Halgren E. 2010. Automatic par-
no competing financial interests.
cellation of human cortical gyri and sulci using standard
anatomical nomenclature. Neuroimage. 53:1–15.
Dorsaint-Pierre R, Penhune VB, Watkins KE, Neelin P, Lerch JP,
Funding
Bouffard M, Zatorre RJ. 2006. Asymmetries of the planum
This work was supported by Guangdong Key Basic Research temporale and Heschl’s gyrus: relationship to language lat-
Grant (2018B030332001), Guangdong Pearl River Talents Plan eralization. Brain. 129:1164–1176.
(2016ZT06S220), Shenzhen Peacock Plan (KQTD2015033016104926), Falzi G, Perrone P, Vignolo LA. 1982. Right-left asymmetry in
and Shenzhen Basic Research Scheme (JCYJ20170818110103216, anterior speech region. Arch Neurol. 39:239–240.
JCYJ20170412164259361, JCYJ20170818110022721, JCYJ20170412- Fischl B, Van Der Kouwe A, Destrieux C, Halgren E, Ségonne F,
164413575). Salat DH, Busa E, Seidman LJ, Goldstein J, Kennedy D. 2004.
Automatically parcellating the human cerebral cortex. Cereb
Cortex. 14:11–22.
References Foundas AL, Eure KF, Luevano LF, Weinberger DR. 1998. MRI
Amunts K. 2010. Structural indices of asymmetry. In: The two asymmetries of Broca’s area: the pars triangularis and pars
halves of the brain. Cambridge: MIT Press, pp. 145–176. opercularis. Brain Lang. 64:282–296.
Amunts K, Schleicher A, Bürgel U, Mohlberg H, Uylings HB, Fram EK, Herfkens RJ, Johnson GA, Glover GH, Karis JP, Shi-
Zilles K. 1999. Broca’s region revisited: cytoarchitecture and makawa A, Perkins TG, Pelc NJ. 1987. Rapid calculation of T1
intersubject variability. J Comp Neurol. 412:319–341. using variable flip angle gradient refocused imaging. Magn
Anderson B, Southern BD, Powers RE. 1999. Anatomic asymme- Reson Imaging. 5:201–208.
tries of the posterior superior temporal lobes: a postmortem Frost JA, Binder JR, Springer JA, Hammeke TA, Bellgowan PS,
study. Neuropsychiatry Neuropsychol Behav Neurol. 12:247. Rao SM, Cox RW. 1999. Language processing is strongly left
Barral JK, Gudmundson E, Stikov N, Etezadi-Amoli M, Stoica P, lateralized in both sexes: evidence from functional MRI. Brain.
Nishimura DG. 2010. A robust methodology for in vivo T1 122:199–208.
mapping. Magn Reson Med. 64:1057–1067. Galuske RA, Schlote W, Bratzke H, Singer W. 2000. Interhemi-
Barrick T, Lawes I, Clark C, editors. 2004. White matter pathway spheric asymmetries of the modular structure in human
asymmetry corresponds to auditory-spatial and language temporal cortex. Science. 289:1946–1949.
lateralisation. J Anat. 204:230–231. Gandour J, Wong D, Hsieh L, Weinzapfel B, Van Lancker D,
Barrick TR, Lawes IN, Mackay CE, Clark CA. 2007. White mat- Hutchins GD. 2000. A crosslinguistic PET study of tone per-
ter pathway asymmetry underlies functional lateralization. ception. J Cogn Neurosci. 12:207–222.
Cereb Cortex. 17:591–598. Ge J, Peng G, Lyu B, Wang Y, Zhuo Y, Niu Z, Tan LH, Leff AP,
Benjamini Y, Hochberg Y. 1995. Controlling the false discovery Gao JH. 2015. Cross-language differences in the brain net-
rate: a practical and powerful approach to multiple testing. work subserving intelligible speech. Proc Natl Acad Sci USA.
Journal of the Royal Statistical Society: Series B (Methodological). 112:2972–2977.
57:289–300. Geschwind N, Galaburda AM. 1985. Cerebral lateralization: bio-
Berl MM, Mayo J, Parks EN, Rosenberger LR, VanMeter J, Ratner logical mechanisms, associations, and pathology: I. a hypoth-
NB, Vaidya CJ, Gaillard WD. 2014. Regional differences in the esis and a program for research. Arch Neurol. 42:428–459.
developmental trajectory of lateralization of the language Geschwind N, Levitsky W. 1968. Human brain: left-right asym-
network. Hum Brain Mapp. 35:270–284. metries in temporal speech region. Science. 161:186–187.
Binder JR, Frost JA, Hammeke TA, Rao SM, Cox RW. 1996. Func- Gomez J, Barnett MA, Natu V, Mezer A, Palomero-Gallagher
tion of the left planum temporale in auditory and linguistic N, Weiner KS, Amunts K, Zilles K, Grill-Spector K. 2017.
processing. Brain. 119:1239–1247. Microstructural proliferation in human cortex is coupled
Bishop DVM. 2013. Cerebral asymmetry and language develop- with the development of face processing. Science. 355:68–71.
ment: cause, correlate, or consequence? Science. 340:1230531. Greve DN, Lise VDH, Qing C, Steven S, Sabuncu MR, Bruce F,
Bogolepova I, Malofeeva L. 2000. The developmental charac- Marc B. 2013. A surface-based analysis of language later-
teristics of speech-motor areas 44 and 45 in the left and alization and cortical asymmetry. J Cognitive Neurosci. 25:
right hemispheres of the human brain in early postnatal 1477–1492.
development. Morfologiia (Saint Petersburg, Russia). 117:13–18. Hsieh L, Gandour J, Wong D, Hutchins GD. 2001. Functional
Bogolepova I, Malofeeva L. 2001. Characteristics of the devel- heterogeneity of inferior frontal gyrus is shaped by linguistic
opment of speech motor areas 44 and 45 in the left and experience. Brain Lang. 76:227–252.4178 Cerebral Cortex, 2021, Vol. 31, No. 9
Hugdahl K, Westerhausen R. 2010. The two halves of the brain: Nan Y, Friederici AD. 2013. Differential roles of right temporal
Information processing in the cerebral hemispheres. Cambridge: cortex and Broca’s area in pitch processing: evidence from
MIT Press. music and Mandarin. Hum Brain Mapp. 34:2045–2054.
Hutsler J, Galuske RAW. 2003. Hemispheric asymmetries in Oishi H, Takemura H, Aoki SC, Fujita I, Amano K. 2018.
cerebral cortical networks. Trends Neurosci. 26:429–435. Microstructural properties of the vertical occipital fasciculus
Hutsler JJ. 2003. The specialized structure of human language explain the variability in human stereoacuity. Proc Natl Acad
cortex: pyramidal cell size asymmetries within auditory and Sci USA. 115:12289–12294.
language-associated regions of the temporal lobes. Brain Olulade OA, Seydell-Greenwald A, Chambers CE, Turkeltaub PE,
Lang. 86:226–242. Dromerick AW, Berl MM, Gaillard WD, Newport EL. 2020. The
Keller SS, Crow T, Foundas A, Amunts K, Roberts N. 2009. Broca’s neural basis of language development: changes in lateraliza-
area: nomenclature, anatomy, typology and asymmetry. Brain tion over age. Proc Natl Acad Sci USA. 117:23477–23483.
Lang. 109:29–48. Penhune V, Zatorre R, MacDonald J, Evans A. 1996. Interhemi-
Klein D, Zatorre RJ, Milner B, Zhao V. 2001. A cross-linguistic PET spheric anatomical differences in human primary audi-
Downloaded from https://academic.oup.com/cercor/article/31/9/4169/6213946 by guest on 25 December 2021
study of tone perception in Mandarin Chinese and English tory cortex: probabilistic mapping and volume measurement
speakers. Neuroimage. 13:646–653. from magnetic resonance scans. Cereb Cortex. 6:661–672.
Knecht S, Deppe M, Dräger B, Bobe L, Lohmann H, Ringelstein Pylkkänen L. 2019. The neural basis of combinatory syntax and
E-B, Henningsen H. 2000. Language lateralization in healthy semantics. Science. 366:62–66.
right-handers. Brain. 123:74–81. Ren GQ, Yang Y, Li X. 2009. Early cortical processing of linguis-
Kwok VPY, Dan G, Yakpo K, Matthews S, Tan LH. 2016. Neural tic pitch patterns as revealed by the mismatch negativity.
systems for auditory perception of lexical tones. J. Neurolin- Neuroscience. 162:87–95.
guistics. 37:34–40. Reuter M, Schmansky NJ, Rosas HD, Fischl B. 2012. Within-
Kwok VPY, Dan G, Yakpo K, Matthews S, Fox PT, Li P, Tan LH. 2017. subject template estimation for unbiased longitudinal image
A meta-analytic study of the neural systems for auditory analysis. Neuroimage. 61:1402–1418.
processing of lexical tones. Front Hum Neurosci. 11:375. Rodd JM, Vitello S, Woollams AM, Adank P. 2015. Localising
Lattner S, Meyer ME, Friederici AD. 2005. Voice perception: sex, semantic and syntactic processing in spoken and written
pitch, and the right hemisphere. Hum Brain Mapp. 24:11–20. language comprehension: an activation likelihood estima-
Li X, Gandour JT, Talavage T, Wong D, Hoffa A, Lowe M, Dzemidzic tion meta-analysis. Brain Lang. 141:89–102.
M. 2010. Hemispheric asymmetries in phonological process- Shaywitz BA, Shaywitz SE, Pugh KR, Constable RT, Skudlarski P,
ing of tones vs. segmental units. Neuroreport. 21:690. Fulbright RK, Bronen RA, Fletcher JM, Shankweller DP, Katz L,
Liang B, Du Y. 2018. The functional neuroanatomy of lexical et al. 1995. Sex differences in the functional organization of
tone perception: an activation likelihood estimation meta- the brain for language. Nature. 373:607–609.
analysis. Front Neurosci. 12:495. Snyder PJ, Harris LJ. 1993. Handedness, sex, and familial sinis-
Liu L, Peng D, Ding G, Jin Z, Zhang L, Li K, Chen C. 2006. Dissoci- trality effects on spatial tasks. Cortex. 29:115–134.
ation in the neural basis underlying Chinese tone and vowel Steinmetz H, Rademacher J, Huang Y, Hefter H, Zilles K, Thron
production. Neuroimage. 29:515–523. A, Freund H-J. 1989. Cerebral asymmetry: MR planimetry
Liu C, Zhang WT, Tang YY, Mai XQ, Chen HC, Tardif T, Luo YJ. of the human planum temporale. J Comput Assist Tomogr.
2008. The visual word form area: evidence from an fMRI study 13:996–1005.
of implicit processing of Chinese characters. Neuroimage. Stüber C, Morawski M, Schäfer A, Labadie C, Wähnert M, Leuze
40:1350–1361. C, Streicher M, Barapatre N, Reimann K, Geyer S. 2014. Myelin
Luo D, Kwok VPY, Liu Q, Li W, Yang Y, Zhou K, Xu M, Gao JH, and iron concentration in the human brain: a quantitative
Tan LH. 2019. Microstructural plasticity in the bilingual brain. study of MRI contrast. Neuroimage. 93:95–106.
Brain Lang. 196:104654. Takao H, Abe O, Yamasue H, Aoki S, Sasaki H, Kasai K, Yoshioka
Luo H, Ni JT, Li ZH, Li XO, Zhang DR, Zeng FG, Chen L. 2006. Oppo- N, Ohtomo K. 2011. Gray and white matter asymmetries in
site patterns of hemisphere dominance for early auditory healthy individuals aged 21–29 years: a voxel-based mor-
processing of lexical tones and consonants. Proc Natl Acad Sci phometry and diffusion tensor imaging study. Hum Brain
USA. 103:19558–19563. Mapp. 32:1762–1773.
Lutti A, Dick F, Sereno MI, Weiskopf N. 2014. Using high- Tan LH, Chen L, Yip V, Chan AH, Yang J, Gao JH, Siok WT.
resolution quantitative mapping of R1 as an index of cortical 2011. Activity levels in the left hemisphere caudate–fusiform
myelination. Neuroimage. 93:176–188. circuit predict how well a second language will be learned.
Mei L, Xue G, Lu ZL, Chen C, Wei M, He Q, Dong Q. 2015. Long- Proc Natl Acad Sci USA. 108:2540–2544.
term experience with Chinese language shapes the fusiform Tan LH, Liu H-L, Perfetti CA, Spinks JA, Fox PT, Gao J-H. 2001.
asymmetry of English reading. Neuroimage. 110:3–10. The neural system underlying Chinese logograph reading.
Mezer A, Rokem A, Berman S, Hastie T, Wandell BA. 2016. Eval- Neuroimage. 13:836–846.
uating quantitative proton-density-mapping methods. Hum Tremblay P, Dick AS. 2016. Broca and Wernicke are dead, or
Brain Mapp. 37:3623–3635. moving past the classic model of language neurobiology.
Mezer A, Yeatman JD, Stikov N, Kay KN, Cho NJ, Dougherty Brain Lang. 162:60–71.
RF, Perry ML, Parvizi J, Hua LH, Butts-Pauly K, et al. 2013. Uylings H, Malofeeva L, Bogolepova I, Jacobsen A, Amunts K,
Quantifying the local tissue volume and composition in indi- Zilles K. 2005. No postnatal doubling of number of neurons
vidual brains with magnetic resonance imaging. Nat Med. in human Broca’s areas (Brodmann areas 44 and 45)? A
19:1667–1672. stereological study. Neuroscience. 136:715–728.
Minagawa-Kawai Y, Cristià A, Dupoux E. 2011. Cerebral lat- Uylings HB, Jacobsen AM, Zilles K, Amunts K. 2006. Left-right
eralization and early speech acquisition: a developmental asymmetry in volume and number of neurons in adult
scenario. Dev Cogn Neuros. 1:217–232. Broca’s area. Cortex. 42:652–658.Myeloarchitectonic Asymmetries of Human Brain Yuan et al. 4179
Wada JA, Clarke R, Hamm A. 1975. Cerebral hemispheric asym- Xi J, Zhang LJ, Shu H, Zhang Y, Li P. 2010. Categorical perception
metry in humans: cortical speech zones in 100 adult and 100 of lexical tones in Chinese revealed by mismatch negativity.
infant brains. Arch Neurol. 32:239–246. Neuroscience. 170:223–231.
Wernicke C, editor. 1969. The symptom complex of aphasia, Xue G, Chen C, Jin Z, Dong Q. 2006. Cerebral asymmetry in the
Proceedings of the Boston Colloquium for the Philosophy of Science fusiform areas predicted the efficiency of learning a new
1966/1968; Dordrecht: Springer. p. 34–97. writing system. J Cog Neurosci. 18:923–931.
Wildgruber D, Riecker A, Hertrich I, Erb M, Grodd W, Ethofer T, Xue G, Dong Q, Chen K, Jin Z, Chen C, Zeng Y, Reiman EM.
Ackermann H. 2005. Identification of emotional intonation 2005. Cerebral asymmetry in children when reading Chinese
evaluated by fMRI. Neuroimage. 24:1233–1241. characters. Cognitive Brain Research. 24:206–214.
Witelson SF, Glezer II, Kigar DL. 1995. Women have greater Yang Y, Zuo Z, Tam F, Graham SJ, Tao R, Wang N, Bi H-Y. 2019.
density of neurons in posterior temporal cortex. J Neurosci. Brain activation and functional connectivity during Chinese
15:3418–3428. writing: an fMRI study. J Neurolinguist. 51:199–211.
Witelson SF, Kigar DL. 1988. Asymmetry in Brain Function Follows Yip M. 2002. Tone. Cambridge: CUP.
Downloaded from https://academic.oup.com/cercor/article/31/9/4169/6213946 by guest on 25 December 2021
Asymmetry in Anatomical Form: Gross, Microscopic, Postmortem Yu K, Wang R, Li L, Li P. 2014. Processing of acoustic and
and Imaging Studies. Amsterdam: Elsevier Science phonological information of lexical tones in mandarin Chi-
Wong PCM. 2002. Hemispheric specialization of linguistic pitch nese revealed by mismatch negativity. Front Hum Neurosci.
patterns. Brain Res Bull. 59:83–95. 8:729.You can also read