Executive function and its relation to anatomical connectome in homosexual and heterosexual men
←
→
Page content transcription
If your browser does not render page correctly, please read the page content below
Original Article

Executive function and its relation to anatomical connectome in
homosexual and heterosexual men
Zheng Wang 1,2 , Jian Bo Hu 1,2 , Gong Jun Ji 3 , Dong Rong Xu 4 , Dan Dan Wang 1,2 , Cai Xi Xi 1,2 ,
Chan Chan Hu 1,2 , Jing Lu 1,2 , Yan Li Du 5 , Qiao Qiao Lu 5 , Ting Ting Huang 5 , Jian Bo Lai 1,2 ,
Jing Kai Chen1,2, Wei Hua Zhou1,2, Ning Wei1,2, Yi Xu1,2, Kai Wang3, Shao Hua Hu1,2
1
    Department of Psychiatry, First Affiliated Hospital, Zhejiang University School of Medicine, Hangzhou, China; 2The Key Laboratory of Mental
Disorder’s Management of Zhejiang Province, Hangzhou, China; 3Laboratory of Cognitive Neuropsychology, Department of Medical Psychology,
Anhui Medical University, Hefei, China; 4Epidemiology Division & MRI Unit, Department of Psychiatry, Columbia University & New York State
Psychiatric Institute, New York, NY, USA; 5Zhejiang University School of Medicine, Hangzhou, China

Correspondence to: Shao Hua Hu, MD. Department of Psychiatry, First Affiliated Hospital, Zhejiang University School of Medicine,
Hangzhou 310000, China; The Key Laboratory of Mental Disorder’s Management of Zhejiang Province, Hangzhou 310000, China.
Email: dorhushaohua@zju.edu.cn.

                   Background: Sexual orientation has been suggested to affect executive function, of which the
                   neurobiological basis is still largely unknown. In this study, we explored the interrelationship between
                   neuropsychological characteristics in homosexual and heterosexual men and their anatomical connectome by
                   graph theoretical analysis.
                   Methods: Fifty-three homosexual and 47 heterosexual males underwent diffusion tensor magnetic
                   resonance imaging (MRI) and neuropsychological assessments. Whole-brain anatomical networks
                   were constructed using white matter tractography, performed on the diffusion tensor imaging data.
                   Neuropsychological tests included the Wisconsin Card Sorting Test (WCST), the Continuous Performance
                   Test (CPT) and the Trail-Making Test (TMT).
                   Results: The cognitive performance of homosexual men was significantly poorer than their heterosexual
                   counterparts in terms of WCST total correct responses. Anatomical connectome analysis revealed a lower
                   (P=0.001) anatomical connectivity between left PoCG and left SMG (P=0.003) in homosexual men as
                   compared to heterosexual men. Linear regression analyses showed that the WCST total correct responses
                   score was significantly linked with sexual orientation (P=0.001). The anatomical connectivity strength
                   between left PoCG and left SMG was also shown to be significantly correlated with sexual orientation
                   (P=0.039) and education (P=0.047).
                   Conclusions: Our study demonstrated the differences in the performance of WCST and anatomical
                   connectome of large-scale brain networks between homosexual and heterosexual men, extending our
                   understanding of the brain’s circuitry and the characteristics of executive function in men of different sexual
                   orientation.

                   Keywords: Homosexual man; neuropsychological characteristic; executive function; magnetic resonance imaging
                   (MRI); anatomical connectome

                   Submitted Oct 01, 2019. Accepted for publication Jul 14, 2020.
                   doi: 10.21037/qims-19-821b
                   View this article at: http://dx.doi.org/10.21037/qims-19-821b

© Quantitative Imaging in Medicine and Surgery. All rights reserved.   Quant Imaging Med Surg 2020;10(10):1973-1983 | http://dx.doi.org/10.21037/qims-19-821b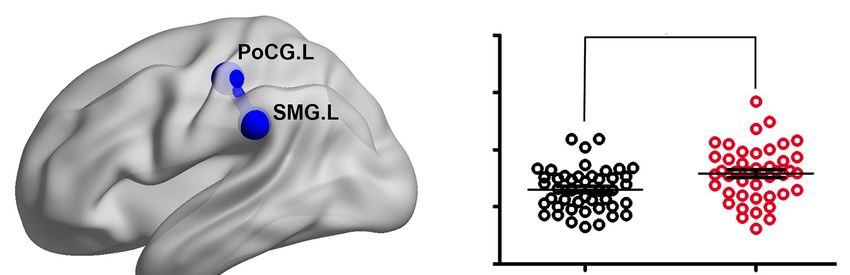
1974                                                                   Wang et al. Executive function and neuroconnectome in sexual orientation

Introduction                                                                       scans of cerebral blood flow, more widespread connections
                                                                                   from the left amygdala to the right amygdala and the
Executive function is one of the most advanced cognitive
                                                                                   anterior cingulate cortex (15), differences in hypothalamic
functions in humans, involved in handling novel situations
                                                                                   PET activity in response to antidepressant treatment
outside the domain of some automatic psychological
                                                                                   (fluoxetine) (16), and an altered pattern of brain
processes that are not explained by the reproduction
                                                                                   activity during visually evoked sexual arousal (17-20).
of learned schemas or set behaviors (1). Smith and
                                                                                   These findings, coupled with the anatomical findings
Jonides (2) suggested that executive function is comprised
                                                                                   aforementioned, may provide substantial evidence for
of five executive components: attention and inhibition,
                                                                                   differing anatomical and functional brain phenotypes
coding, monitoring, planning, task management. People
                                                                                   associated with distinct sexual orientations. However,
with normal executive functions can distinguish essential
                                                                                   exploratory investigations into neuroanatomical
information, implement plans, reason, and solve problems
                                                                                   characteristics with diffusion tensor imaging in homosexual
when they deal with novelty. Various factors, such as
                                                                                   men, to date, has been rarely documented.
gender, age and mental disorders, have also been reported
                                                                                      Overall, the neurons of the brain constitute a formidably
as influencing factors of executive function. Additional
                                                                                   complicated circuitry that supports the segregation and
evidence also suggested that sexual orientation may be
                                                                                   integration of information processing (21). In recent
related to differences in executive function.
                                                                                   years, the development of graph theory has facilitated
   Furthermore, neurocognitive studies have reported the
                                                                                   a quantitative characterization of various aspects of the
association of specific cognitive profiles with variations
                                                                                   brain’s topological organization of connectivity (22),
in sexual orientation. Earlier studies have shown that
                                                                                   including modularity (23), hierarchy, centrality, and the
heterosexual men, on average, have better visuospatial
                                                                                   distribution of network hubs (22). This study explored
abilities than homosexual men, whereas profiles for
                                                                                   the neuropsychological characteristics of homosexual and
heterosexual women did not differ significantly from
                                                                                   heterosexual males. Diffusion tensor imaging data were
homosexual men (3-5). Heterosexual men tended to
                                                                                   subsequently collected, and the correlation between brain
display superior performance on mental rotation tasks
                                                                                   anatomical connectome and cognitive measures were
compared to homosexual men. These tasks were typically
                                                                                   obtained, based on graph theoretical analysis.
performed better by heterosexual males compared to
heterosexual women (3). Homosexual men, in contrast,
had better memory for spatial location and landmarks                               Methods
during navigation, along with superior phonological and
                                                                                   Participants
semantic fluency, which heterosexual women were known
to perform better in, compared to heterosexual men (5,6).                          A group composed of 53 self-reported homosexual men
However, other studies indicated that no specific cognitive                        (age 23.96±4.28 years, range from 18 to 35 years) was
ability differed between heterosexual and homosexual                               recruited from a local underground club of homosexuality
individuals (7). Therefore, the impact of sexual orientation                       in Hangzhou, China. Forty-seven healthy heterosexual age-
on cognitive abilities is still poorly defined.                                    and education level-matched controls (age 24.34±2.88 years,
   The biological basis of human sexual orientation has                            range from 20 to 34 years) were recruited from local
been hypothesized over the past several decades to include                         communities.
genetic factors (8-10), prenatal androgens (11), maternal                             The inclusion criteria included: (I) physical health with
immunity (12-14), and neurophysiological factors (14)                              no earlier history of physical disease; (II) male adults aged
that determine same-sex attractions over attractions of the                        between 18 to 35 years; (III) right-handedness identified by
opposite sex. Additionally, executive functional differences                       the Edinburgh Handedness Inventory (EHI). The exclusion
may be linked to cerebral structural and functional                                criteria included: (I) history of psychiatric or neurological
differences associated with sexual orientation. In recent                          disorders, such as depression, bipolar disorder, head trauma,
years, increasing neuroimaging studies have emerged to                             and epilepsy; (II) history of long-term medications or
reveal the neural correlates of homosexuality. Functional                          psychoactive substance abuse, including alcohol use and
brain differences have also been reported in homosexual                            smoking; (III) history of sexual dysfunction, gender identity
individuals. They include altered functional connectivity                          disorder, or paraphilia which were excluded by the Utrecht
of the amygdala in positron emission tomography (PET)                              Gender Dysphoria Scale (UGS) and the Multiphasic Sex

© Quantitative Imaging in Medicine and Surgery. All rights reserved.     Quant Imaging Med Surg 2020;10(10):1973-1983 | http://dx.doi.org/10.21037/qims-19-821b
Quantitative Imaging in Medicine and Surgery, Vol 10, No 10 October 2020 1975
Table 1 Demographic data and sexual preference characteristics of 53 homosexual and 47 heterosexual participants
Characteristic Homosexual men Heterosexual men P
Age (years), mean (SD) 23.96 (4.28) 24.34 (2.88) 0.61
Educational level (years), mean (SD) 15.04 (2.31) 15.21 (2.29) 0.71
Kinsey Scale, n (%) –
Score 0 0 (0) 47 (100.00)
Score 1 0 (0) 0 (0)
Score 2 0 (0) 0 (0)
Score 3 0 (0) 0 (0)
Score 4 8 (15.09) 0 (0)
Score 5 12 (22.64) 0 (0)
Score 6 33 (62.26) 0 (0)
SD, standard deviation.
Inventory (MSI). The sexual preference of each participant errors, random errors, and categories were recorded.
was assessed by the Kinsey Heterosexual-Homosexual The Conners’ CPT measures sustained and selective
Rating Scale, which provides an overall index of sexual attention (26). Scores reflect the total number of stimuli,
orientation ranging from 0 (exclusively heterosexual) to the number of correct targets, omission errors (the
6 (exclusively homosexual). Subjects whose scores ranged number of targets to which the person did not respond),
from 4 to 6 were recruited as the homosexual group. and commission errors (the number of times the person
Participants who scored 0 were assigned as heterosexual responded to a non-target).
(Table 1). All participants were HIV-negative. The TMT is a test of visual attention and task
The study complied with the Declaration of Helsinki (as switching (27). It consists of two parts where participants
revised in 2013) and approved by the ethics committee of are instructed to rapidly and accurately connect a set of
the First Affiliated Hospital, Zhejiang University School of 25 dots. In part A, participants were required to quickly
Medicine. All participants provided their written informed connect consecutively numbered circles with lines. In
consent for study participation after the risks and benefits part B, they were asked to alternately combine numbers
were discussed in full. with assorted colors in ascending order. The time to task
completion was measured in seconds.
Neuropsychological assessments
Data acquisition
The Wisconsin Card Sorting Test (WCST), Continuous
Performance Test (CPT), and the Trail-Making Test MRI data
(TMT) were used to evaluate executive functioning in all All participants underwent structural and diffusion tensor
participants. imaging scanning using a 3.0-Tesla General Electric
The modified WCST (24) is a widely used psychological (GE) Sigma Scanner (Hangzhou, China), with a standard
assessment instrument for evaluating higher-order cognitive GE quadrature head coil. Participants wore earplugs,
functions related to the frontal lobes (25). Participants were and padding (foam cushions) under the head was used to
required to assign 48 cards based on color, number, and restrict head movement. High-resolution axial T1- and
shape. After six consecutive correct responses, participants T2-weighted images were obtained from every participant
were asked to change the sorting principle to another for the detection of silent lesions. Diffusion tensor images
category. The test was finished when participants completed covering the whole brain were obtained using a spin-echo
all six categories correctly or assigned all 48 cards. The total echo planar imaging sequence, including 26 volumes with
trial, correct trials, total number of errors, perseverative diffusion gradients applied along 25 non-collinear directions
© Quantitative Imaging in Medicine and Surgery. All rights reserved. Quant Imaging Med Surg 2020;10(10):1973-1983 | http://dx.doi.org/10.21037/qims-19-821b1976 Wang et al. Executive function and neuroconnectome in sexual orientation
(b =1,000 s/mm2) and 1 volume without diffusion weighting Connectivity matrix and graph-theoretic measures
(b =0 s/mm 2). Each volume consisted of 46 contiguous The anatomical connectivity between ROIs i and j was
axial slices (repetition time =12,000 ms; echo time = 90 ms; defined as the mean FA of fibers connecting i and j. For
field of view =120×120 mm2. matrix size =128×128; flip each participant, the anatomical connectivity matrix “M”
angle =90°; slice thickness =3 mm; no gap). Subsequently, had 90×90 entries, with Aij corresponding to the weighted
high-resolution 3D T1-weighted anatomical images were connectivity between ROI i and j, also referred to as the
acquired in the sagittal orientation using a magnetization- link between nodes i and j.
prepared rapid gradient-echo sequence (repetition time =7 Graph theory enables the quantification of network
ms; echo time =2.9 ms; field of view =240×240 mm2, matrix topological pr oper ties. Gr aph measur es f o r ea c h
size =256×256; 170 slices; flip angle =8°; slice thickness =1.0 connectivity matrix were calculated using the Brain
mm; no gap). Connectivity Toolbox (https://sites.google.com/a/
brain-connectivity-toolbox.net/bct/). Small-worldness
is an optimal architecture balancing the segregation
Brain network construction
and integration of information, with similar path
Data preprocessing g t h ( λ Lwnet / Lwrandom ≈ 1) b u t h i g h e r c l u s t e r i n g
l e n=
Diffusion-weighted images (DWIs) were preprocessed and (γ =Cnetw / Crandom
w
> 1) than a random network (32). We
analyzed using the Pipeline for Analyzing Brain Diffusion evaluated the typical properties of a small-worldness
Images toolkit (PANDA; http://www.nitrc.org/projects/ (σ = γ / λ ) , which is usually a value larger than one.
panda) (28), which synthesizes procedures in FSL (http://fsl. Among several nodal measures in graph theory, we selected
fmrib.ox.ac.uk/fsl) and the Diffusion Toolkit (DTK, http:// connectivity strength to estimate the topological feature of
www.trackvis.org/dtk/). Head motion and eddy current- each node due to its high test-retest reliability (33) and clear
induced distortion were corrected via the eddy function. neurophysiological relevance (34). Nodal strength (Si) was
The diffusion tensor was subsequently estimated by solving computed as the sum of the weights of all connections of
the Stejskal and Tanner equation (29), and the fractional node i, that is as Si = ∑ wij . This value quantifies the extent
w
anisotropy (FA) value of each voxel was also calculated using j∈N
to which a node is relevant to the graph.
the reconstructed tensor matrix. Finally, whole-brain white
matter fiber tracking was performed in the native diffusion
space for each participant using the “fiber assignment from
Statistical analysis
the continuous tracking algorithm” embedded in DTK.
All tracts were computed by seeding each voxel with an FA Sparsity was usually defined as the fraction of the total
greater than 0.2 (30). Path tracking proceeded until either number of edges remaining in a network. For global and
the FA was less than 0.15, or the angle between the current nodal topological characteristics statistics, a single sparsity
and the previous path segment was greater than 35º (31). threshold for connectivity network was preferred by some
Fibers of less than 10 mm or displaying obvious false paths research groups (35), while a range of sparsity thresholds
were discarded. As a result, all the fiber pathways in the was used by other investigators (31,36). The latter strategy
brain were constructed using the deterministic tractography was adopted in this study for consistency across our previous
method. studies (36) (0.10≤ sparsity ≤0.18, step =0.01). The minimum
sparsity was set so that the average node strength of the
Anatomical parcellation threshold network was 2*log(N), where N is the number of
We defined 90 regions of interest (ROIs) according to the nodes, and its maximum was set so that the small-worldness
Anatomical Automatic Labeling (AAL; http://www.gin.cnrs. of the threshold network was >1.1. Further, the area-under-
fr/AAL) template. The ROIs were transformed into each curve was calculated (37) for the global and nodal network
participant’s native diffusion space. Specifically, individual metrics, providing an overall estimate for the topological
3D T1 images were coregistered to B0 images and the characterization of brain networks, independent of cost
Montreal Neurologic Institute (MNI) space by unified threshold. The AUC (i.e., global and nodal properties)
segmentation in SPM8. These transformation parameters and anatomical connectivity (i.e., FA) difference between-
were inverted and applied to the AAL template (31). These groups were tested using a two-sample t-test with a false-
ROIs were used as seed and target for fiber tracking. positive adjustment (34). Pearson’s correlation was used to
© Quantitative Imaging in Medicine and Surgery. All rights reserved. Quant Imaging Med Surg 2020;10(10):1973-1983 | http://dx.doi.org/10.21037/qims-19-821bQuantitative Imaging in Medicine and Surgery, Vol 10, No 10 October 2020 1977
2.1 1.062
Homosexual men
2.0 1.060 N.S.
Heterosexual men
1.9 0.086
1.058
1.8 N.S. 0.084
1.056
Gamma
Lambda
1.7 0.18 0.082
1.054
1.6
0.14
1.5 1.052
0.10 1.050
1.4
1.3 1.048
0.10 0.11 0.12 0.13 0.14 0.15 0.16 0.17 0.18 0.10 0.11 0.12 0.13 0.14 0.15 0.16 0.17 0.18
Sparsity
Sparsity
2.0 7.5
1.9 7.0
1.8
6.5
1.7
Sigma
Snet
N.S. 6.0 N.S.
1.6 0.18
5.5 0.50
1.5
0.14
0.45
1.4 5.0
0.10 0.40
1.3 4.5
0.10 0.11 0.12 0.13 0.14 0.15 0.16 0.17 0.18 0.10 0.11 0.12 0.13 0.14 0.15 0.16 0.17 0.18
Sparsity Sparsity
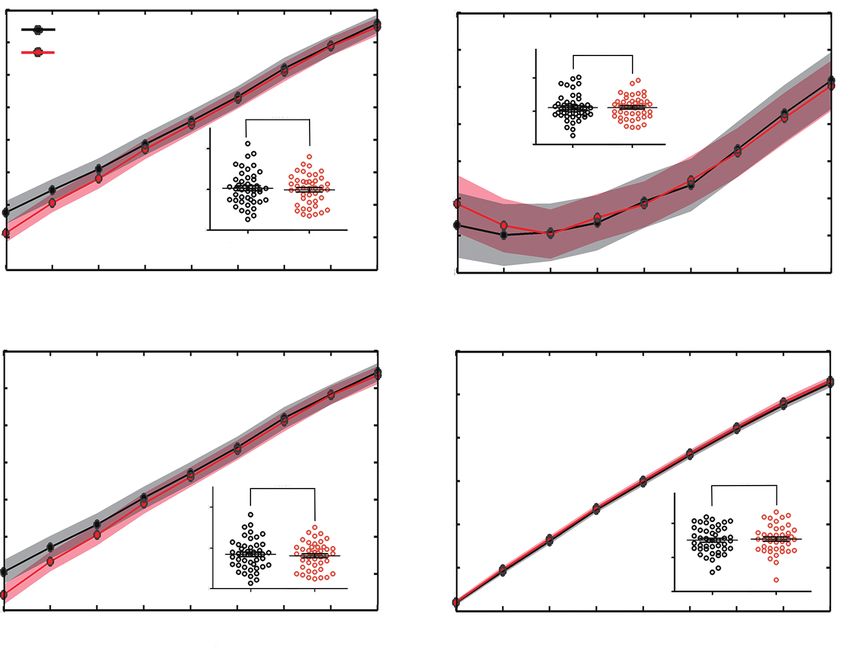
Figure 1 Differences in the topological properties of structural networks between homosexual and heterosexual men. Global metrics of WM
structural networks were quantified in two groups with different network sparsity. Shaded bands in black and red denote SEM in homosexual
and heterosexual men, respectively. Inset line graphs indicated the between-group analysis of area-under-curve values. N.S., no significance.
analyze the relationship between the topological features level (P>0.05). Additionally, 8, 12, and 33 participants from
(i.e., nodal strength, anatomical connectivity strength) and the homosexual group, respectively, scored 4, 5, and 6 on
neuropsychological assessments (i.e., WSCT and CPT the Kinsey Scale.
scores) in homosexual men. Kolmogorov-Smirnov test was
applied to assess the distribution of all neuropsychological
Network global features
test data. The two-sample t-test was used if variables were
acceptable with a normal distribution. Alternatively, the A comparison in the anatomical network properties
Mann-Whitney U test was used if the normal distribution between homosexual and heterosexual men was performed
was not achieved. Linear regression was used to estimate using a data-specific small-world regime within a specified
the association between neuropsychological assessments, sparsity range (0.10≤ sparsity ≤0.18). Both groups exhibited
topological features, and sexual orientation, and other higher clustering coefficients (i.e., γ >1) but almost identical
clinical characteristics (age and education) separately. The characteristic path length (i.e., λ ≈1), compared with
Bonferroni correction was applied to correct for multiple comparable random networks, which are typical features
comparisons. A two-sided P value of less than 0.05 was of small-worldness (Figure 1). No significant difference
considered statistically significant. Statistical analyses were between groups was observed for global features.
performed using SPSS 17.0 software.
Network nodal and connectivity features
Results
Anatomical connectivity between the left postcentral gyrus
No significant differences were noted between homosexual (PoCG) and left supramarginal gyrus (SMG) was lower in
and heterosexual participants in mean age and education homosexual men compared to heterosexual men (t=−3.12,
© Quantitative Imaging in Medicine and Surgery. All rights reserved. Quant Imaging Med Surg 2020;10(10):1973-1983 | http://dx.doi.org/10.21037/qims-19-821b1978 Wang et al. Executive function and neuroconnectome in sexual orientation
L
t=–3.12, P=0.003
0.6
Fractional anisortropy
0.5
0.4
0.3
0.2
Homosexual men Heterosexual men
Figure 2 Between-group difference in anatomical connectivity. Decreased connectivity was found between left postcentral gyrus and left
supramarginal gyrus in homosexual men compared to heterosexual men. PoCG.L, left postcentral gyrus; SMG.L, left supramarginal gyrus.
uncorrected P=0.003; can survive false-positive adjustment) with graph theoretical-based measures of their anatomical
(Figure 2). There was no significant difference noted on any connectome. Anatomical connectome analysis indicated
nodal strength between groups. that homosexual men shared similar global architecture
with heterosexual men, suggesting that overall brain
structure may not be powerfully influenced by sexual
Neurocognitive features
orientation. Additionally, sexual orientation and experiences
Analysis of data obtained from WCST total correct did not reshape the overall brain organization concerning
responses revealed significantly poorer performance by topological efficiency and robustness. However, homosexual
homosexual men compared to heterosexual men (Z=−3.36, men displayed reduced connectivity between left PoCG
uncorrected P=0.001, can survive Bonferroni-corrected). and left SMG. Further linear regression analysis suggested
However, both groups did not differ significantly on any of that education was also a significant contributor to the
the CPT or TMT performance (Table 2). connectivity strength between these two regions of the
brain. While homosexual men also performed less well
on the WCST. However, these cognitive measures in the
Correlation of network characteristics and neurocognitive
homosexual men did not correlate significantly with their
measures in the homosexual men
measures of connectivity.
We found no significant correlation between nodal strength Human cognitive functioning is generated by integrating
or anatomical connectivity and any of the neurocognitive information processes in functionally specialized areas.
measures. Graph theory posits that the brain is divided into
Linear regression analysis indicated a highly significant several functionally independent nodes, and previous
and negative correlation in WCST total correct responses neuroimaging studies in healthy participants have shown
score and sexual orientation (t=−3.554, P=0.001, adjusted that the connectivity among these nodes exhibits a small-
R2=0.127). The anatomical connectivity strength between world property. This global feature is vital for supporting
left PoCG and left SMG was significant and positively cognition and behavior and may alter in different biological
related to sexual orientation (t=−2.096, P=0.039, adjusted conditions. In this study, the cognitive profiles associated
R2=0.072). However, this connection was also shown to be with sexual orientation were similar to those reported in
negatively related to education (t=0.223, P=0.047, adjusted prior studies (3-5). The WCST is a neuropsychological
R2=0.072) (Table 3). test of “set-shifting”, or flexibility in the face of changing
schedules of reinforcement (38,39). Performance on
executive function tests such as WCST requires inhibiting
Discussion
responses to unnecessary information (40). Our findings
To our knowledge, this is the first study to associate revealed that homosexual men performed less well on the
measures of cognitive performance in homosexual men WCST compared to heterosexual men. This test is also
© Quantitative Imaging in Medicine and Surgery. All rights reserved. Quant Imaging Med Surg 2020;10(10):1973-1983 | http://dx.doi.org/10.21037/qims-19-821bQuantitative Imaging in Medicine and Surgery, Vol 10, No 10 October 2020 1979 Table 2 Comparison of neuropsychological test performance between homosexual and heterosexual men Neuropsychological assessments Homosexual men Heterosexual men t Z P WCST total errors, mean ± SD 15.71±8.65 11.53±5.74 2.65 – 0.010a WCST perseverative errors, mean ± SD 10.20±7.09 7.45±4.16 2.22 – 0.029a WCST random errors, mean ± SD 5.59±3.12 4.38±2.41 1.98 – 0.051a TMT-part A, mean ± SD 44.25±15.83 48.15±30.85 −0.68 – 0.498a TMT-part B, mean ± SD 79.86±21.51 81.55±51.56 −0.19 – 0.085a WCST total numbers, median (p25–p75) 48.00 (47.50–48.00) 48.00 (46.25–48.00) – −0.37 0.710b WCST total correct responses, median 33.00 (26.00–36.00) 36.00 (34.00–37.75) – −3.36 0.001b* (p25–p75) WCST completed categories, median 4.50 (2.25–6.00) 5.00 (5.00–6.00) – −2.28 0.023b (p25–p75) CPT correct numbers in the first 11.00 (11.00–12.00) 11.00 (11.00–12.00) – −1.09 0.274b condition, median (p25–p75) CPT correct numbers in the second 12.00 (12.00–13.00) 13.00 (12.00–14.00) – −2.61 0.009b condition, median (p25–p75) CPT correct numbers in the third 12.00 (12.00–13.00) 12.00 (12.00–13.00) – −2.63 0.793b condition, median (p25–p75) p25: 25th percentile; p75: 75th percentile. a, two-sample t-test; b, Mann-Whitney U test; *, significant for P
1980                                                                   Wang et al. Executive function and neuroconnectome in sexual orientation

with previous findings that the TPJ and VLPFC tend to co-                          this limitation. Further validation in an independent
activate in attention-reorienting studies (48,49). Another                         sample is needed. Secondly, the variation in characteristics
study demonstrated the importance of SMG in the top-                               of homosexual participants, including their intelligence
down control of selective attention (50). Transcranial                             quotient, social extraversion, and differing Kinsey Scale
magnetic stimulation (TMS) of the SMG impairs spatial                              scores, could influence the interpretation of findings in the
attention only, whereas TMS of the anterior intraparietal                          correlation analyses. Lastly, heterosexual women were not
sulcus disrupts spatial and feature-based attention (50). These                    included in this study, precluding the possibility of assessing
effects are likely to derive from distinct mechanisms of top-                      whether brain and cognitive features in homosexual men
down control between parietal and occipital regions (51).                          were similar in pattern to those in heterosexual women.
   The PoCG is also a vital part of the parietal lobe                              Above all, we have shown the differences in cognitive
and is believed to play a significant role in visuomotor                           capacities and the anatomical connectome of large-scale
coordination. It has also been linked to a wide variety of                         brain networks between homosexual and heterosexual men,
high-level processing tasks (45,52). For example, as the                           suggesting new perspectives to understanding this biological
somatosensory association cortex, it plays a critical role                         basis of male sexual orientation.
in visuomotor attention and working memory, as well as
visuospatial processing (52). Furthermore, the role of the
                                                                                   Acknowledgments
SMG is consistent with the role of the superior longitudinal
fasciculus in executive function, as this fiber tract connects                     Funding: This work was supported by the National Natural
frontal and parietal regions (53). The pioneering work of                          Science Foundation of China (81101013 and 81671357 to
Catani (54) identified intrinsic connections between PoCG                          SHH, 81171273 to KW, 81401400 to GJJ and 81471734 to
and SMG as the second prominent intraparietal tract.                               DRX); Zhejiang Provincial Natural Science Foundation of
This is part of the arcuate fasciculus, a lateral associative                      China (LY14H180002 to SHH); National Clinical Research
bundle composed of long and short fibers connecting the                            Center for Mental Health Disorders (2015BAI13B02);
perisylvian cortex of the frontal, parietal, and temporal                          the Key Project of National Natural Science Foundation
lobes. Altered white matter hyperintensities related                               of China (91432301 and 91232717 to KW); National
structural connectivity in left PoCG and SMG was found                             Basic Research Program of China (2015CB856405,
to be associated with poor attention set-shifting (55).                            2012CB720704, and 2011CB707805 to KW); and Anhui
Interestingly, a study reported that cortical thickness of left                    Collaborative Innovation Center of Neuropsychiatric
PoCG and SMG were increased after an arts education                                Disorder and Mental Health.
program, and the changes of the cortical thickness were
associated with the performance of WCST (56). In line
                                                                                   Footnote
with the previous findings, our results also indicate that
education significantly contributed to the connectivity                            Conflicts of Interest: All authors have completed the ICMJE
strength between left PoCG and SMG besides sexual                                  uniform disclosure form (available at http://dx.doi.
orientation.                                                                       org/10.21037/qims-19-821b). The authors have no conflicts
   The present study has shown that executive function                             of interest to declare.
differed between homosexual and heterosexual men,
suggesting a link with sexual orientation. However, the                            Ethical Statement: The study was approved by the Ethics
overall similarity in global brain architecture was observed                       Committee of the First Affiliated Hospital, Zhejiang
between homosexual and heterosexual men, with only                                 University School of Medicine, and was carried out
reduced connectivity between left PoCG and left SMG,                               following the approved guidelines. Each participant was
which was also influenced by education. These results                              informed of the details about the study and provided written
indicate new perspectives in understanding the neural basis                        consent. The patient also consented to the publication of
of male sexual orientation.                                                        this study and any accompanying images. A copy of the
   Some limitations of our study should be noted. Firstly, as                      written consent is available for review by the Editor-in-
an exploratory study, most of our findings of the anatomical                       Chief of this journal.
connectome would not survive strict correction for multiple
comparisons, although most connectomic studies share                               Open Access Statement: This is an Open Access article

© Quantitative Imaging in Medicine and Surgery. All rights reserved.     Quant Imaging Med Surg 2020;10(10):1973-1983 | http://dx.doi.org/10.21037/qims-19-821b
Quantitative Imaging in Medicine and Surgery, Vol 10, No 10 October 2020 1981
distributed in accordance with the Creative Commons 14. McFadden D, Pasanen EG. Comparison of the auditory
Attribution-NonCommercial-NoDerivs 4.0 International systems of heterosexuals and homosexuals: click-
License (CC BY-NC-ND 4.0), which permits the non- evoked otoacoustic emissions. Proc Natl Acad Sci U S A
commercial replication and distribution of the article with 1998;95:2709-13.
the strict proviso that no changes or edits are made and the 15. Savic I, Lindstrom P. PET and MRI show differences in
original work is properly cited (including links to both the cerebral asymmetry and functional connectivity between
formal publication through the relevant DOI and the license). homo- and heterosexual subjects. Proc Natl Acad Sci U S
See: https://creativecommons.org/licenses/by-nc-nd/4.0/. A 2008;105:9403-8.
16. Kinnunen LH, Moltz H, Metz J, Cooper M. Differential
brain activation in exclusively homosexual and heterosexual
References
men produced by the selective serotonin reuptake
1. Marazziti D, Consoli G, Picchetti M, Carlini M, Faravelli inhibitor, fluoxetine. Brain Res 2004;1024:251-4.
L. Cognitive impairment in major depression. Eur J 17. Hu SH, Wei N, Wang QD, Yan LQ, Wei EQ, Zhang
Pharmacol 2010;626:83-6. MM, Hu JB, Huang ML, Zhou WH, Xu Y. Patterns of
2. Smith EE, Jonides J. Storage and executive processes in brain activation during visually evoked sexual arousal differ
the frontal lobes. Science 1999;283:1657-61. between homosexual and heterosexual men. AJNR Am J
3. McCormick CM, Witelson SF. A cognitive profile of Neuroradiol 2008;29:1890-6.
homosexual men compared to heterosexual men and 18. Kagerer S, Klucken T, Wehrum S, Zimmermann M,
women. Psychoneuroendocrinology 1991;16:459-73. Schienle A, Walter B, Vaitl D, Stark R. Neural activation
4. Sanders G, Ross-Field L. Sexual orientation and visuo- toward erotic stimuli in homosexual and heterosexual
spatial ability. Brain Cogn 1986;5:280-90. males. J Sex Med 2011;8:3132-43.
5. Rahman Q, Abrahams S, Wilson GD. Sexual-orientation- 19. Paul T, Schiffer B, Zwarg T, Kruger TH, Karama S,
related differences in verbal fluency. Neuropsychology Schedlowski M, Forsting M, Gizewski ER. Brain response
2003;17:240-6. to visual sexual stimuli in heterosexual and homosexual
6. Rahman Q, Andersson D, Govier E. A specific sexual males. Hum Brain Mapp 2008;29:726-35.
orientation-related difference in navigation strategy. Behav 20. Ponseti J, Bosinski HA, Wolff S, Peller M, Jansen O,
Neurosci 2005;119:311-6. Mehdorn HM, Buchel C, Siebner HR. A functional
7. Tuttle GE, Pillard RC. Sexual orientation and cognitive endophenotype for sexual orientation in humans.
abilities. Arch Sex Behav 1991;20:307-18. Neuroimage 2006;33:825-33.
8. Hamer DH, Hu S, Magnuson VL, Hu N, Pattatucci AM. 21. He Y, Evans A. Graph theoretical modeling of brain
A linkage between DNA markers on the X chromosome connectivity. Curr Opin Neurol 2010;23:341-50.
and male sexual orientation. Science 1993;261:321-7. 22. Bullmore E, Sporns O. Complex brain networks: graph
9. Hu S, Pattatucci AM, Patterson C, Li L, Fulker DW, theoretical analysis of structural and functional systems.
Cherny SS, Kruglyak L, Hamer DH. Linkage between Nat Rev Neurosci 2009;10:186-98.
sexual orientation and chromosome Xq28 in males but not 23. Girvan M, Newman ME. Community structure in social
in females. Nat Genet 1995;11:248-56. and biological networks. Proc Natl Acad Sci U S A
10. Mustanski BS, Dupree MG, Nievergelt CM, Bocklandt 2002;99:7821-6.
S, Schork NJ, Hamer DH. A genomewide scan of male 24. Nelson HE. A modified card sorting test sensitive to
sexual orientation. Hum Genet 2005;116:272-8. frontal lobe defects. Cortex 1976;12:313-24.
11. Ellis L, Ames MA. Neurohormonal functioning and sexual 25. Dehaene S, Changeux JP. The Wisconsin Card Sorting
orientation: a theory of homosexuality-heterosexuality. Test: theoretical analysis and modeling in a neuronal
Psychol Bull 1987;101:233-58. network. Cereb Cortex 1991;1:62-79.
12. Blanchard R. Quantitative and theoretical analyses of the 26. Homack S, Riccio CA. Conners' Continuous Performance
relation between older brothers and homosexuality in men. Test (2nd ed.; CCPT-II). J Atten Disord 2006;9:556-8.
J Theor Biol 2004;230:173-87. 27. Reitan RM. The relation of the trail making test to organic
13. Bullmore ET, Bassett DS. Brain graphs: graphical models brain damage. J Consult Psychol 1955;19:393-4.
of the human brain connectome. Annu Rev Clin Psychol 28. Cui Z, Zhong S, Xu P, He Y, Gong G. PANDA: a pipeline
2011;7:113-40. toolbox for analyzing brain diffusion images. Front Hum
© Quantitative Imaging in Medicine and Surgery. All rights reserved. Quant Imaging Med Surg 2020;10(10):1973-1983 | http://dx.doi.org/10.21037/qims-19-821b1982 Wang et al. Executive function and neuroconnectome in sexual orientation
Neurosci 2013;7:42. LJ, Mesholam-Gately RI, Goldstein JM, McCarley RW,
29. Basser PJ, Mattiello J, LeBihan D. MR diffusion tensor Shenton ME, Levitt JJ. White matter tract abnormalities
spectroscopy and imaging. Biophys J 1994;66:259-67. between rostral middle frontal gyrus, inferior frontal gyrus
30. Mori S, Crain BJ, Chacko VP, van Zijl PC. Three- and striatum in first-episode schizophrenia. Schizophr Res
dimensional tracking of axonal projections in the brain by 2013;145:1-10.
magnetic resonance imaging. Ann Neurol 1999;45:265-9. 43. Chen YC, Zhang H, Kong Y, Lv H, Cai Y, Chen H, Feng
31. Zhang Z, Liao W, Chen H, Mantini D, Ding JR, Xu Y, Yin X. Alterations of the default mode network and
Q, Wang Z, Yuan C, Chen G, Jiao Q, Lu G. Altered cognitive impairment in patients with unilateral chronic
functional-structural coupling of large-scale brain tinnitus. Quant Imaging Med Surg 2018;8:1020-9.
networks in idiopathic generalized epilepsy. Brain 44. Zhang L, Zhang L, Xue F, Yue K, Peng H, Wu Y, Sha
2011;134:2912-28. O, Yang L, Ding Y. Brain morphological alteration and
32. Watts DJ, Strogatz SH. Collective dynamics of 'small- cognitive dysfunction in multiple system atrophy. Quant
world' networks. Nature 1998;393:440-2. Imaging Med Surg 2018;8:1030-8.
33. Wang JH, Zuo XN, Gohel S, Milham MP, Biswal BB, He 45. Alvarez JA, Emory E. Executive function and the
Y. Graph theoretical analysis of functional brain networks: frontal lobes: a meta-analytic review. Neuropsychol Rev
test-retest evaluation on short- and long-term resting-state 2006;16:17-42.
functional MRI data. PLoS One 2011;6:e21976. 46. Mesulam MM. A cortical network for directed attention
34. Liang X, Zou Q, He Y, Yang Y. Coupling of functional and unilateral neglect. Ann Neurol 1981;10:309-25.
connectivity and regional cerebral blood flow reveals a 47. Daselaar SM, Fleck MS, Cabeza R. Triple dissociation in
physiological basis for network hubs of the human brain. the medial temporal lobes: recollection, familiarity, and
Proc Natl Acad Sci U S A 2013;110:1929-34. novelty. J Neurophysiol 2006;96:1902-11.
35. Zhong S, He Y, Gong G. Convergence and divergence 48. Corbetta M, Shulman GL. Control of goal-directed and
across construction methods for human brain white matter stimulus-driven attention in the brain. Nat Rev Neurosci
networks: an assessment based on individual differences. 2002;3:201-15.
Hum Brain Mapp 2015;36:1995-2013. 49. Corbetta M, Patel G, Shulman GL. The reorienting
36. Ji GJ, Zhang Z, Xu Q, Wei W, Wang J, Wang Z, Yang F, system of the human brain: from environment to theory of
Sun K, Jiao Q, Liao W, Lu G. Connectome Reorganization mind. Neuron 2008;58:306-24.
Associated With Surgical Outcome in Temporal Lobe 50. Schenkluhn B, Ruff CC, Heinen K, Chambers CD.
Epilepsy. Medicine (Baltimore) 2015;94:e1737. Parietal stimulation decouples spatial and feature-based
37. Stuhrmann A, Dohm K, Kugel H, Zwanzger P, Redlich R, attention. J Neurosci 2008;28:11106-10.
Grotegerd D, Rauch AV, Arolt V, Heindel W, Suslow T, 51. Saalmann YB, Pigarev IN, Vidyasagar TR. Neural
Zwitserlood P, Dannlowski U. Mood-congruent amygdala mechanisms of visual attention: how top-down feedback
responses to subliminally presented facial expressions in highlights relevant locations. Science 2007;316:1612-5.
major depression: associations with anhedonia. J Psychiatry 52. Wanchai. Cortical Functions: Reference. Hong Kong:
Neurosci 2013;38:249-58. Trans Cranial Technologis Ltd., 2012.
38. Berg EA. A simple objective technique for measuring 53. Sheline YI, Price JL, Vaishnavi SN, Mintun MA, Barch
flexibility in thinking. J Gen Psychol 1948;39:15-22. DM, Epstein AA, Wilkins CH, Snyder AZ, Couture L,
39. Monchi O, Petrides M, Petre V, Worsley K, Dagher A. Schechtman K, McKinstry RC. Regional white matter
Wisconsin Card Sorting revisited: distinct neural circuits hyperintensity burden in automated segmentation
participating in different stages of the task identified by distinguishes late-life depressed subjects from comparison
event-related functional magnetic resonance imaging. J subjects matched for vascular risk factors. Am J Psychiatry
Neurosci 2001;21:7733-41. 2008;165:524-32.
40. Potter LM, Grealy MA. Aging and inhibitory errors on a 54. Catani M, Robertsson N, Beyh A, Huynh V, de Santiago
motor shift of set task. Exp Brain Res 2006;171:56-66. Requejo F, Howells H, Barrett RLC, Aiello M, Cavaliere
41. Goldberg E, Bougakov D. Neuropsychologic assessment C, Dyrby TB, Krug K, Ptito M, D'Arceuil H, Forkel
of frontal lobe dysfunction. Psychiatr Clin North Am SJ, Dell'Acqua F. Short parietal lobe connections of the
2005;28:567-80, 78-9. human and monkey brain. Cortex 2017;97:339-57.
42. Quan M, Lee SH, Kubicki M, Kikinis Z, Rathi Y, Seidman 55. Respino M, Jaywant A, Kuceyeski A, Victoria LW,
© Quantitative Imaging in Medicine and Surgery. All rights reserved. Quant Imaging Med Surg 2020;10(10):1973-1983 | http://dx.doi.org/10.21037/qims-19-821bQuantitative Imaging in Medicine and Surgery, Vol 10, No 10 October 2020 1983
Hoptman MJ, Scult MA, Sankin L, Pimontel M, Liston C, 56. Park S, Lee JM, Baik Y, Kim K, Yun HJ, Kwon H, Jung
Belvederi Murri M, Alexopoulos GS, Gunning FM. The YK, Kim BN. A Preliminary Study of the Effects of an
impact of white matter hyperintensities on the structural Arts Education Program on Executive Function, Behavior,
connectome in late-life depression: Relationship to and Brain Structure in a Sample of Nonclinical School-
executive functions. Neuroimage Clin 2019;23:101852. Aged Children. J Child Neurol 2015;30:1757-66.
Cite this article as: Wang Z, Hu JB, Ji GJ, Xu DR,
Wang DD, Xi CX, Hu CC, Lu J, Du YL, Lu QQ, Huang TT,
Lai JB, Chen JK, Zhou WH, Wei N, Xu Y, Wang K, Hu SH.
Executive function and its relation to anatomical connectome in
homosexual and heterosexual men. Quant Imaging Med Surg
2020;10(10):1973-1983. doi: 10.21037/qims-19-821b
© Quantitative Imaging in Medicine and Surgery. All rights reserved. Quant Imaging Med Surg 2020;10(10):1973-1983 | http://dx.doi.org/10.21037/qims-19-821bYou can also read