Influence of Forest Disturbance on La Crosse Virus Risk in Southwestern Virginia - MDPI
←
→
Page content transcription
If your browser does not render page correctly, please read the page content below
insects
Article
Influence of Forest Disturbance on La Crosse Virus
Risk in Southwestern Virginia
M. Camille Hopkins 1 , Steven D. Zink 2 , Sally L. Paulson 3 and Dana M. Hawley 1, *
 1    Department of Biological Sciences, Virginia Tech, Blacksburg, VA 24061, USA; mchopkins@usgs.gov
 2    New York State Department of Health, Slingerlands, NY 12159, USA; Steven.Zink@health.ny.gov
 3    Department of Entomology, Virginia Tech, Blacksburg, VA 24061, USA; spaulson@vt.edu
 *    Correspondence: hawleyd@vt.edu; Tel.: +1-540-231-8946

 Received: 13 December 2019; Accepted: 24 December 2019; Published: 30 December 2019

 Abstract: Forest disturbance effects on La Crosse virus (LACV) are currently unknown. We determined
 the abundance of three LACV accessory vectors (Aedes albopictus, Ae. canadensis, and Ae. vexans) and
 the primary amplifying host (Eastern chipmunk; Tamias striatus), and tested for LACV prevalence
 in both vectors and chipmunks, across a gradient of experimental forest disturbance treatments in
 southwest Virginia. Forest disturbance significantly affected the abundance of LACV accessory vectors,
 with a higher abundance on disturbed sites for Ae. canadensis and Ae. vexans. However, there was
 no significant disturbance effect on chipmunk abundance. Forest disturbance significantly affected
 LACV prevalence in mosquito vectors, with most (80%) detections on unlogged control sites, which
 past work showed harbor the highest abundance of the two most common LACV vectors (the primary
 vector Aedes triseriatus, and Ae. japonicus). Interestingly, LACV nucleic acid was only detected in
 Ae. japonicus and Culex pipiens/restuans, with no detections in the primary vector, Ae. triseriatus.
 In contrast to the vector results, antibodies were only found in chipmunks on logged sites, but this
 result was not statistically significant. Overall, our results suggest that human LACV risk should
 generally decline with logging, and reveal the potential importance of accessory vectors in LACV
 maintenance in Appalachian forests.

 Keywords: La Crosse virus; mosquito; chipmunk; invasive species; accessory vectors

1. Introduction
     Environmental landscape changes can impact vector-borne disease dynamics by affecting insect
vectors, vertebrate hosts, or their interaction [1]. Forest vector-borne diseases may be impacted by
fragmentation, logging, and deforestation [2]. A well-researched example of the influence of forest
fragmentation on vector-borne disease risk is the tick-borne Lyme disease. Forest fragments less
than two hectares in size have been associated with an increased density of infected nymphs [3]
due to a higher relative abundance of competent vertebrate reservoir hosts in small patches [4,5].
Deforestation, which alters microclimatic conditions, has also been shown to impact mosquito-borne
human malaria. In heavily logged landscapes, Anopheles mosquitoes and the Plasmodium protozoan
develop rapidly [6]. This shortened mosquito gonotrophic cycle is associated with increased human
biting rates and risk of malaria [7,8]. In contrast to work on human malaria, deforestation is generally
associated with a decreased prevalence of avian malaria [9–11], though vector abundance was not
measured in these studies. Overall, research suggests that the influence of forest disturbance on
vector-borne diseases is likely complex and may depend on the ecology of the vectors and vertebrate
hosts involved. The impact of forest disturbance on La Crosse virus (LACV) is unknown.
     Southwestern Virginia is part of an emerging Appalachian focus of LACV [12,13]. While most
cases are subclinical, LACV can cause pediatric encephalitis [14]. This zoonotic mosquito-borne virus is

Insects 2020, 11, 28; doi:10.3390/insects11010028                               www.mdpi.com/journal/insects
Insects 2020, 11, 28 2 of 16
maintained in hardwood forests through the primary LACV vector, Aedes triseriatus (Say), by transovarial
vertical or intergenerational transmission [15,16], as well as a horizontal (i.e., intragenerational)
transmission cycle between mosquitoes and sciurid rodents (especially chipmunks) [17,18]. Aedes
triseriatus can overwinter the virus in tree holes [19]. While the tree-hole mosquito is the primary
vector, two invasive mosquitoes are also contributing to the spread of this disease: Ae. albopictus
(Skuse) [20] and Ae. japonicus (Theobald) [21,22]. In fact, the 2009 LACV detection in Ae. albopictus in
Texas represented a possible expansion of the LACV range by an invasive mosquito species [20]. There
is also evidence that other species, such as Ae. canadensis (Theobald) [23], Ae. vexans (Meigen) [24]
and Culex mosquitoes [25,26], may play a role in LACV dynamics. Thus, several Culicidae vectors
have been implicated in LACV dynamics. We recently showed that mosquito species diversity in
the temperate forest mosquito community in southwest Virginia is largely unaffected by logging
and associated forest fragmentation [27]. However, we found that there was an effect of logging on
overall mosquito abundance and the abundance of the two most common Aedes vectors at our sites,
Ae. triseriatus and Ae. japonicus [27], suggesting population-level effects on vector species that may be
critical for resulting LACV risk [28,29].
In addition to effects on LACV vector abundance, logging can also impact the abundance of
chipmunks, which serve as amplifying hosts of LACV. There has been some prior work on how
forest fragmentation affects Eastern chipmunks (Tamias striatus; Linnaeus, 1758), with mixed results.
In oak forest in Indiana, chipmunks increased in relative abundance on clearcut sites [30]. In contrast,
in West Virginia, T. striatus declined in response to clearcutting [31]. Finally, studies in New York
and Pennsylvania found no differences in chipmunk abundance between clearcut and mature forest
stands [32,33]. Because chipmunks can contribute to the dynamics of several vector-borne diseases,
including Lyme disease [34], babesiosis [35], anaplasmosis [36], West Nile virus [37], and La Crosse
virus [38], it is particularly important to understand how temperate forest logging influences their
abundance and exposure to pathogens.
Here, we seek to understand how logging and associated forest disturbance impact the abundance
of accessory LACV vectors and chipmunks, the primary vertebrate amplifying host of LACV [38,39],
as well as the prevalence of LACV in mosquitoes and antibodies in chipmunks.
2. Materials and Methods
2.1. Study Site
Our study sites in Jefferson National Forest in southwestern Virginia are part of a long-term
investigation of silvicultural oak regeneration methods on biodiversity, the Southern Appalachian
Silviculture and Biodiversity Project (SASAB) [40–42]. These oak-dominant (Quercus spp.) sites had
similar overstory composition, age, and topographic position [40]. Two sites used for this study
(Blacksburg 1 and 2; BB1 and BB2, respectively) were located in Montgomery County, VA (37◦ 170 35.73”
N, 80◦ 270 24.63” W (BB1); 37◦ 180 20.35” N, 80◦ 260 24.95” W (BB2)), while a third site (Newcastle (NC))
was located in Craig County, VA (37◦ 270 20.78” N, 80◦ 230 0.37” W).
2.2. Disturbance Treatments
At each of the three SASAB study sites, seven two-hectare experimental units (EUs) were
established with no buffer between the units. Silvicultural treatments were randomly assigned to EUs
within sites using a fully randomized complete block design (Figure 1). For this study, three two-hectare
silvicultural treatments were the focus of mosquito surveillance: repeated-entry high-leave shelterwood
(SW) at 0–2 years post-disturbance; single-entry clearcut (CCUT) at 12–14 years post-disturbance; and
unlogged control plots embedded in a matrix of surrounding fragmentation created by silviculture
treatments, and thus termed “embedded controls” (ECON) at 80–100 years old (Figure 1).area removed. Just prior to the initiation of this study, SW sites were logged again, with all residual
overstory removed [42]. Thus, at the time of this study, SW plots had experienced the most recent
disturbance, at 0–2 years post-logging, while CCUT plots were 12–14 years post-disturbance. Thus,
we considered our disturbance gradient to be: SW > CCUT > ECON. Accordingly, at the time of the
study, the density of overstory trees was highest on ECON sites, intermediate on CCUT sites, and
Insects 2020, 11, 28 3 of 16
lowest on SW sites [42].
Figure
Figure 1. 1.The
Thespatial
spatial arrangement
arrangement of of study sites where
study sites where mosquito
mosquitoabundance
abundanceand andcommunity
community
composition
composition were
werecharacterized
characterizedusing
usinggravid
gravid traps. The righthand
traps. The righthandmap mapshows
showsthethedistribution
distribution of of
thethe
four study sites (BB1 = Blacksburg 1, BB2 = Blacksburg 2, BB3 = Blacksburg
four study sites (BB1 = Blacksburg 1, BB2 = Blacksburg 2, BB3 = Blacksburg 3, and NC = Newcastle)3, and NC = Newcastle)
across two
across twocounties
counties(Montgomery
(Montgomeryand and Craig),
Craig), and the inset
and the inset shows
showsthe thelocation
locationofofstudy
study sites
sites within
within
southwest Virginia. The left-hand figure shows an example layout of the
southwest Virginia. The left-hand figure shows an example layout of the three experimental unitsthree experimental units
sampled
sampled at the BB1 study site. Due to experimental randomization, the spatial arrangement of of
at the BB1 study site. Due to experimental randomization, the spatial arrangement
silviculture
silviculturetreatment
treatmentassignments
assignments differed
differed across
across the three
three Southern
Southern Appalachian
AppalachianBiodiversity
Biodiversity
Silviculture
Silviculture and Biodiversity
and Biodiversity(SASAB)
(SASAB)study
studysites
sites (BB1,
(BB1, BB2, and
and NC;
NC;stars).
stars).AtAteach
eachSASAB
SASAB site,
site, three
three
of of
thethe
seven
seven two-hectare
two-hectaresilvicultural
silviculturaltreatments
treatments (SW (SW = repeat-entryshelterwood,
= repeat-entry shelterwood,CCUT CCUT = clearcut,
= clearcut,
andandECON
ECON = =embedded
embeddedcontrol)
control) were
were used
used for this study,
study, but
but other
othertreatments
treatments(LWS (LWS= =low-leave
low-leave
shelterwood; LT = leave tree cut; GS = group selection; UH = understory herbicide) were shown
shelterwood; LT = leave tree cut; GS = group selection; UH = understory herbicide) were shown to to
illustrate the matrix of habitat within which each experimental unit was embedded.
illustrate the matrix of habitat within which each experimental unit was embedded. After a minimum After a minimum
30 30
mm buffer
buffer zone
zone wasestablished
was establishedon oneach
eachtreatment,
treatment, five infusion-baited
infusion-baitedgravid
gravidtraps
traps were
were placed
placed onon
each
each experimental
experimental unit,asasshown.
unit, shown.Gravid
Gravid traps
traps are
are not
not shown
shownto tosize.
size.Reprinted
Reprintedfrom from [27].
[27].
2.3.Logging
Contiguous Control Sites
disturbance was examined on a gradient defined by the frequency of harvest and the time
elapsedBecause
since the last logging event. Embedded
of the forest fragmentation created control plots had
by the SASAB never experienced
experimental direct1)logging
design (Figure and
butassociated
were adjacent to plots
disturbance to that
ECON were logged.
sites Clearcut
(e.g., skid trails, (CCUT) sitesfrom
diffuse light wereadjacent
harvested once between
treatments), an
1995 and 1996 [43], and this harvest removed 95% of the basal overstory
additional non-SASAB study site (BB3) containing two contiguous controls (CCON) equivalent in area. Shelterwood (SW)
sites
sizewere also
to the logged
SASAB EUsinwas1995–1996,
establishedbutforwere only thinned
the purposes of thisatstudy.
that time, with 56% ofN,the
BB3 (37°18′48.59″ basal area
80°2′15.82″
removed.
W) wasJust alsoprior to theininitiation
located JeffersonofNational
this study, SW sites
Forest were loggedCounty)
(Montgomery again, with all residual overstory
for comparison to the
removed
embedded [42].control
Thus, (ECON)
at the time of this BB1
at nearby study,
andSW plots
BB2. BB3hadwasexperienced
approximately the1.8
most recent
miles fromdisturbance,
BB2 (Figure at
0–21).years
These uncut sites while
post-logging, were CCUTembedded
plotswithin large years
were 12–14 areaspost-disturbance.
of contiguous forest Thus,that
wehad not beenour
considered
recently disturbed
disturbance gradient by be: SW > CCUT
to harvesting. These>stands
ECON. were dominatedatbythe
Accordingly, oak (Quercus
time of the alba,
study, Q. the
velutina, Q. of
density
prinus), trees
overstory alongwas
withhighest
yellowon poplar
ECON (Liriodendron tulipifera).onRed
sites, intermediate CCUTmaple (Acer
sites, andrubrum)
lowest andon SW sourwood
sites [42].
2.3. Contiguous Control Sites
Because of the forest fragmentation created by the SASAB experimental design (Figure 1)
and associated disturbance to ECON sites (e.g., skid trails, diffuse light from adjacent treatments),
an additional non-SASAB study site (BB3) containing two contiguous controls (CCON) equivalent in size
to the SASAB EUs was established for the purposes of this study. BB3 (37◦ 180 48.59” N, 80◦ 20 15.82” W)
was also located in Jefferson National Forest (Montgomery County) for comparison to the embedded
control (ECON) at nearby BB1 and BB2. BB3 was approximately 1.8 miles from BB2 (Figure 1).
These uncut sites were embedded within large areas of contiguous forest that had not been recentlyInsects 2020, 11, 28 4 of 16
disturbed by harvesting. These stands were dominated by oak (Quercus alba, Q. velutina, Q. prinus),
along with yellow poplar (Liriodendron tulipifera). Red maple (Acer rubrum) and sourwood (Oxydendrum
arboretum) were common in the midstory. The ages of the dominant and co-dominant trees in these
stands were 100–130 years. Similar to the SASAB sites, the stands were on a south aspect with a
moderate slope (J. Overcash, US Forest Service, pers. comm.).
2.4. Mosquito Sampling
From late May to September 2008–2010, adult mosquitoes were collected twice a week from
infusion-baited gravid traps [44]. Five gravid traps were placed on each EU for mosquito collection
(Figure 1). A minimum 30 m buffer zone was applied to each EU to minimize edge effects. After a
minimum of 24 h storage in a −80 ◦ C freezer, mosquitoes were identified using morphological keys and
pooled into groups with a maximum of 50 females by species, collection site, and date. Male mosquitoes
were not counted for this study. Female mosquitoes, which feed on plant sugars and vertebrate blood to
obtain nutrients for oviposition, can transmit pathogens to animals and humans [45]. Because important
adult taxonomic characters may be damaged or missing after field-collection [46,47], which makes
identification difficult, Cx. restuans (Theobald) and Cx. pipiens (Linnaeus, 1758) mosquitoes were pooled.
Such pools will hereafter be referred to as Cx. pipiens/restuans.
2.5. Quantitative LACV Real-Time RT-PCR of 2008 Mosquito Pools
Mosquito pools from the 2008 field season were submitted to the Virginia Division of Consolidated
Laboratory Services (DCLS) for virus detection. Reverse transcription-PCR was used to determine if
this bunyavirus was present on our study sites. One milliliter of bovine albumin diluent (BA-1) [48]
was added to each mosquito pool. Mechanical homogenization was performed with a 4.5 mm steel
bead; the resultant homogenate was centrifuged for 5 min at 13,500 rpm. Viral RNA was extracted from
the supernatant of the homogenized mosquito pools with the QIAamp Viral RNA Mini Kit (Qiagen,
Valencia, CA, USA) according to the manufacturer’s instructions. RT-PCR targeting the M segment of
LACV was conducted with the QuantiTect probe RT-PCR Kit (Qiagen). We present the threshold cycle
(CT ), defined as the amplification cycle at which the fluorescence increased above the threshold value
(i.e., crossing point value).
Samples were tested with the more sensitive primer set (LAC2364, LAC2448; Table 1) for two
runs on an ABI PRISM 7000 system (Applied Biosystems, Inc., Foster City, CA, USA). To prevent false
positives, samples with a crossing point value were then run on a different machine (the LightCycler 2.0,
Roche Diagnostics, Indianapolis, IN, USA), re-extracted twice, and run twice with both LAC2364/2448
and a less sensitive primer set (LAC812, LAC881; Table 1). For each run, 45 amplification cycles were
performed. Although no cut-off value was used in 2008, false positives were minimized by running
any positive samples for a total of six independent RT-PCRs on two separate machines and using
templates from four independent DNA extractions.
Two positive samples from Cx. pipiens/restuans (Table 2) collected in 2008 were previously
published [26] as part of a study evaluating the vector competence of both Culex species for LACV.
Similarly, one positive Ae. japonicus pool from 2008 (Table 2) and two positive pools from 2009
(see below methods) were previously published as part of a study on emerging field detections of
Ae. japonicus in the Appalachian region [22]. However, neither study examined these samples in the
context of forest disturbance treatment, as we do here. Similarly, those studies did not include the
hundreds of negative samples from other vector species, including Ae. triseratius, collected as part of
this study.
2.6. Quantitative LACV Real-Time RT-PCR of 2009–2010 Mosquito Pools
The 2008 results led us to perform viral isolation and quantitative RT-PCR testing of isolates in
2009 and 2010. Mosquito pools were homogenized using previously described methods for LACV
isolation [49]. Homogenate supernatant (150 µL) was inoculated onto African green monkey kidneyInsects 2020, 11, 28 5 of 16
cells (Vero cells, ATCC# CCL-81), incubated at 37 ◦ C and monitored daily for cytopathic effect (CPE).
Isolates with marked CPE were harvested and submitted to the Centers for Disease Control and
Prevention in Fort Collins, Colorado [20,22,50] or the Wadsworth Arbovirus Laboratories in Albany,
New York for molecular testing (see Tables 1 and 3 for primers). For both laboratories, a sample was
considered positive if the CT value was ≤38.
Table 1. Primers used for the amplification of La Crosse virus (LACV).
Year Laboratory Primer/Probe Name LACV M Segment Primer/Probe Sequence (5’→3’) Source
LAC836 LP1 CATCCATTCACAGAGTGTGGCACGC
LAC812 LF1 TGCAAGCTATGCGGCCTAGT
LAC881 LR1 AGCGAGCACCACAGACACAA R. Lanciotti, CDC,
2008 VA DCLS
LAC2387 LP2 AATGGGCCAAGTGTGTATAGGAAACCATCA pers. comm.
LAC2364 LF2 CAATAATTCCGTGTGGTGAACC
LAC2448 LR2 GACCGATCAGTGCTAGATTGGAA
AGTAGTGTACTACC
2009 CDC [50]
TTRAARCADGCATGGAA
Table 2. La Crosse virus nucleic acid detection results from mosquitoes collected in southwestern
Virginia (2008–2010). Detections were from pools or groups of up to 50 female mosquitoes of the same
species caught on the same day and collection site. Mont. = Montgomery; ECON = Embedded control;
SW = High-leave shelterwood. * One Ae. vexans pool amplified in one run but because this positive
was not reproducible and had a very high CT value (CT = 44), it was assumed to be a false positive and
was conservatively excluded from statistical analysis.
LACV +
Species Year Mean CT Value Pool Size Treatment County Month
Pools/Total Pools
2008 0/59
Ae. triseriatus 2009 0/12
2010 0/11
2008 1/53 Mont.
38 a 22 ECON July
Ae. japonicus 2009 2/27 Mont.,
14, 23 a 3, 50 SW, ECON July
2010 0/16 Craig
2008 0/10
Ae. albopictus
2009 0/1
2008 2/64
ECON, July
Cx. pipiens/restuans 2009 0/1 42, 42 b 3, 7 Mont.
(both) August
2010 0/3
Ae. vexans 2008 0/18 *
a Previously published as part of [22]. b Previously published as part of [26].
Table 3. Primers designed for La Crosse virus M segment amplification.
Location in M Segment
Primer/Probe LACV M Segment Primer/Probe Sequence (5’→3’) Primer Size (bp)
(GU206142)
F Primer 817 CTATGCGGCCTAGTGTATC 19
R Primer 872 GGAAGTATCATAGCGAGCACC 21
Probe 844 CY5-CACAGAGTGTGGCACGCATTGTGTC-3BHQ_2 25
2.7. Quantitative LACV Real-Time RT-PCR with Novel Primers
Using the MagMaxTM viral RNA isolation kit (Applied Biosystems, Life Technologies, Grand Island,
NY, USA) and the Freedom EVO® 150 liquid handling robotic arm (Tecan, Morrisville, NC, USA),
RNA was extracted from 100 µL of the submitted cell culture isolate and eluted into 50 µL of elution
buffer. The 25 µL reaction mix contained 0.3 µL of 100 µM primer and 0.3 µL of 25 µM probe (Integrated
DNA Technologies, Coralville, IA, USA). The thermal cycling consisted of reverse transcription at 50 ◦ C
for 2 min, one cycle at 95 ◦ C for 10 min to activate Taq and inactivate the reverse-transcriptase, 45 cycles
at 95 ◦ C for 10 s for amplification, and 60 ◦ C for 1 min to read the plate. Amplification and fluorescentInsects 2020, 11, 28 6 of 16
detection were performed on the ABI 7500 real-time PCR standard system (Applied Biosystems,
Inc., Foster City, CA, USA). For each run, two no template controls were included with the samples.
La Crosse virus (LACV/74/NY-M (74-32813)) stock controls were included to control for both the
extraction and qRT-PCR. A sample was considered positive if the sample CT value was ≤38, the positive
control CT was ≤38, and the negative control CT was >40.
2.8. Chipmunk Mark–Recapture Study
In Montgomery County (BB1, BB2, and BB3), a 7 × 7 trapping grid with a 10 m interval was
established with 3” × 3.5” × 9” large folding Sherman traps (H.B. Sherman Traps, Tallahassee, FL, USA).
Using oats for bait, live trapping was conducted for three consecutive nights at monthly intervals.
All captured chipmunks were ear-tagged to allow for mark–recapture estimates of abundance. The
following morphometric data were collected from each chipmunk: age class, body and tail length,
weight, and reproductive condition. Chipmunks were briefly anesthetized by a licensed veterinarian
(M.C.H.) in a small tupperware container using a cotton-ball soaked with isoflurane (Baxter, Deerfield,
IL, USA) prior to blood collection. Blood was collected from the orbital sinus or lateral saphenous vein
with the collected volume not exceeding 1% of total blood volume [51]. All trapping and handling of
small mammals was approved by the Virginia Department of Game and Inland Fisheries (VDGIF #
031626 and 038780) and the Virginia Tech Animal Care and Use Committee (IACUC# 07-083-BIOL and
10-064-BIOL).
2.9. Chipmunk Plaque-Reduction Neutralization Test (PRNT) for La Crosse Virus Antibodies
Blood was collected from 52 chipmunk captures. However, four samples were not tested because
they were from recaptured chipmunks and nine had inadequate serum volume for PRNT. For recaptured
chipmunks, only the last collected serum sample was tested for LACV antibodies. Although traps
were placed on the contiguous control sites (BB3), no chipmunks were captured and, therefore, no
blood was collected. Serum samples were heat-inactivated at 56 ◦ C for thirty minutes to inactivate
viruses and destroy complement. Using BA-1 diluent, sera were initially diluted to 1 in 10 and then
titrated by two-fold serial dilutions to 1 in 320 for PRNT assays. LACV-specific neutralizing antibody
titers were determined by 90% endpoint PRNT (PRNT90 ). Serum-virus mixture was added to six-well
plates with a confluent layer of Vero cells. A 0.5% agarose double-overlay was used and plaques
were visualized with neutral red staining in the second overlay, which was applied 48 h after the first
overlay [52,53]. Normal guinea pig complement (S1639, Sigma-Aldrich, St. Louis, MO, USA) was
added to the serum–virus mixture at an 8% concentration to provide labile serum factor. Each test run
was validated with an LACV-specific mouse hyperimmune polyclonal ascitic fluid positive control
(World Reference Center for Emerging Viruses and Arboviruses, University of Texas Medical Branch
at Galveston, Galveston, TX, USA), normal mouse serum negative control (M5905, Sigma-Aldrich,
St. Louis, MO, USA), and an LACV back-titration. Neutralizing antibody titer was expressed as the
reciprocal of the endpoint serum dilution that reduced the challenge LACV plaque count by 90% based
on the back-titration.
2.10. Statistical Analysis
We compared mosquito vector abundance per trap night across forest disturbance treatments
using linear mixed-effect models (package nlme). The model with the lowest AIC was selected for
this analysis. The model included temporal (year, Julian date) and spatial (study site location: BB1,
BB2, NC, or BB3) variables as random effects, with treatment (CCON, ECON, CCUT, or SW) as a fixed
effect. This model (AIC: 7081) outperformed models with simpler random effects, which considered
location and year (7375), location and Julian date (7109), only location (7391), only year (7402), or only
Julian date (7214). We utilized a nested random effects structure with Julian date nested within year
and year nested within study site location. The addition of location only slightly improved the model.Insects 2020, 11, 28 7 of 16
A likelihood ratio Chi-squared test was used to test for associations between the disturbance treatment
of mosquito collection and detection of LACV nucleic acid.
Because of the low density of small mammals, chipmunk abundance was estimated as the
minimum number known alive per hectare (MNKA) [54]. MNKA values were calculated based on
treatment and year. Therefore, chipmunk abundance (MNKA) across forest disturbance treatments
was compared using linear mixed-effect models, with treatment as a fixed effect and year as a random
effect. A nonparametric test (Pearson’s Chi-squared test) was used to test for associations between the
location of chipmunk capture and presence of LACV antibodies. The prevalence of LACV antibodies
across the forest disturbance treatments was compared using the package epiR. The LACV antibody
analysis did not include the CCON treatment because no chipmunks were captured on these sites.
All analyses were conducted in R version 3.00 (R Development Core Team 2013).
3. Results
3.1. Mosquito Accessory Vector Abundance
Abundance data for the three most commonly collected vector species at our sites (Ae. triseriatus,
Ae. japonicus, and Cx. pipiens/restuans) were previously reported [27], and generally showed significant
declines with an increasing degree of forest disturbance (with the exception of Cx. pipiens/restuans).
Here, we present results for the accessory vectors not examined in prior work.
3.1.1. Aedes vexans
Over three field seasons, 316 Ae. vexans adult females were collected. There was a significant
disturbance treatment effect on the abundance of this mosquito (F3,380 = 4.5, p = 0.0042). On average,
this vector was most abundant in the clearcut (CCUT) treatment, and was only rarely collected in
contiguous control (CCON) sites, which were least disturbed (Figure 2A).
3.1.2. Aedes canadensis
Over three field seasons, 79 Ae. canadensis adult females were collected. There was a significant
disturbance treatment effect on the abundance of this floodwater mosquito (F3,380 = 3.5, p = 0.016).
On average, the shelterwood (SW) treatment (the most recently logged) harbored the highest abundance
of this species, and similar to Ae. vexans, this species was very rare to absent in contiguous control sites
(Figure 2B).
3.1.3. Aedes albopictus
Over three field seasons, 191 Ae. albopictus adult females were collected. There was a significant
disturbance treatment effect on the abundance of this invasive species (F3,380 = 6.2, p = 0.0004). As with
Ae. canadensis, the shelterwood (SW) treatment (most recently logged) had the highest abundance
of this species, although the next highest abundance occurred on the contiguous control (CCON)
treatment, the least disturbed treatment in our study (Figure 2C). Thus, although Ae. albopictus was
significant impacted by treatment, responses to logging did not appear to be directional in this species.
3.1.4. LACV Mosquito Surveillance
Across all years, LACV nucleic acid was detected in five total pools from two total vector species:
Ae. japonicus and Cx. pipiens/restuans (Table 2). There was a significant effect of treatment on the
detection of LACV nucleic acid (χ2 = 8.1, d.f. = 3, p = 0.044; n = 274). The majority of positive samples
(4/5, 80%) were in embedded control sites, with the exception of an Ae. japonicus pool in the SW.
Most positive samples were from sites in Montgomery County, but there was one positive Ae. japonicus
pool from the Craig County site (NC).Insects
Insects 2020,
2020, 11,
11, x28FOR PEER REVIEW 88of
of 16
16
1.5 Ae. vexans
A
Abundance Per Trap Night
1.0
0.5
0.0
1.0
B Ae. canadensis
Abundance Per Trap Night
0.5
0.0
1.0
C Ae. albopictus
Abundance Per Trap Night
0.5
0.0
CCON ECON CCUT SW
(100–130 yrs) (80–100 yrs) (12–14 yrs) (0–2 yrs)
Logging Treatment
(Stand Age)
Figure 2. Mean number (± standard error) of female mosquitos from three La Crosse virus accessory
Figure 2. Mean(A:
vector species number (± standard
Aedes vexans, error)
B: Aedes of female
canadensis, andmosquitos from threecaught
C: Aedes albopictus) La Crosse virus accessory
per trap-night across
vector species (A: Aedes vexans, B: Aedes canadensis, and C: Aedes albopictus) caught per
forest disturbance treatments, from least (CCON) to most disturbed (SW), as quantified by frequency trap-night
across forest
of harvest disturbance
and stand age treatments,
(darkness offrom least corresponds
shading (CCON) to mostto ourdisturbed (SW), as
categorization of quantified
the degree byof
frequency of harvestCCON
forest disturbance). = contiguous
and stand age (darkness of ECON
control; shading= embedded
corresponds to ourCCUT
control, = clearcut,
categorization of and
the
SW = high-leave
degree of forest shelterwood.
disturbance). CCON = contiguous control; ECON = embedded control, CCUT =
clearcut, and SW = high-leave shelterwood.
3.1.4. LACV Mosquito SurveillanceAcross all years, LACV nucleic acid was detected in five total pools from two total vector species:
Ae. japonicus and Cx. pipiens/restuans (Table 2). There was a significant effect of treatment on the
detection of LACV nucleic acid (χ2 = 8.1, d.f. = 3, p = 0.044; n = 274). The majority of positive samples
(4/5, 80%) were in embedded control sites, with the exception of an Ae. japonicus pool in the SW. Most
positive samples were from sites in Montgomery County, but there was one positive Ae. japonicus
Insects 2020, 11, 28 9 of 16
pool from the Craig County site (NC).
In 2008, amplification was reproduced in all three positive samples following re-extraction.
NoneIn of2008,
the 2008 positives were
amplification wassuccessfully
reproducedconfirmed with
in all three the LAC812/LAC881
positive primers.
samples following However,
re-extraction.
these
None positive
of the samples were allwere
2008 positives fromsuccessfully
species (Ae. confirmed
japonicus, and
withCx.the
pipiens/restuans)
LAC812/LAC881 shown to be
primers.
competent
However, these for La Crosse
positive virus were
samples in past work species
all from [26,55].(Ae.
Further, although
japonicus, and Cx.bothpipiens/restuans)
positive Cx.
pipiens/restuans
shown to be competent pools hadfor high
La C T values,
Crosse several
virus lines
in past of evidence
work support although
[26,55]. Further, that thoseboth
samples are
positive
true positives. First,pools
Cx. pipiens/restuans six positive
had high pools
CT of Cx. pipiens/restuans
values, several lines of were detected
evidence in nearby
support West Virginia
that those samples
using
are true more stringent
positives. protocols
First, [26].pools
six positive Similarly,
of Cx.we previously performed
pipiens/restuans were detectedvector competence
in nearby West
experiments
Virginia using tomore
demonstrate
stringentthat both Culex
protocols [26]. species arewe
Similarly, competent
previouslyvectors of LACV
performed [26],
vector albeit to a
competence
lesser degree to
experiments than other species.
demonstrate that Quantitative RT-PCR
both Culex species arerevealed
competent novectors
positiveofpools
LACV in[26],
2010,albeit
but two
to a
positive Ae. japonicus
lesser degree pools
than other in 2009Quantitative
species. (Table 2). RT-PCR revealed no positive pools in 2010, but two
positive Ae. japonicus pools in 2009 (Table 2).
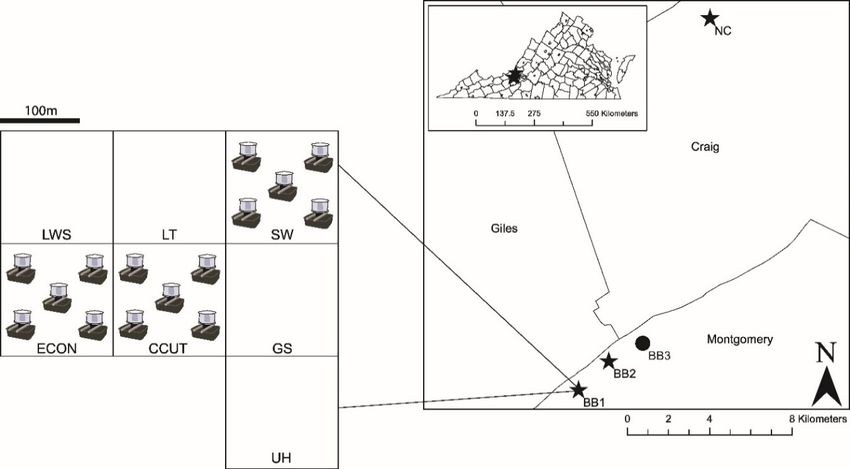
3.1.5. Chipmunk Mark–Recapture Study
3.1.5. Chipmunk Mark–Recapture Study
Forty-eight individual chipmunks were captured over three field seasons. The mean estimate of
Forty-eight
chipmunk individual
abundance chipmunks
(MNKA) was 3.97werepercaptured
hectare,over three
with field seasons.
a minimum of The
zeromean
(CCON)estimate
and ofa
chipmunk abundance (MNKA) was 3.97 per hectare, with a minimum of zero (CCON)
maximum of 12 individuals (SW) (Figure 3). There was no significant difference in the MNKA across and a maximum
of 12 individuals
forest disturbance (SW) (Figure
treatments 3).= 3.6,
(F3,5 Therep =was no significant difference in the MNKA across forest
0.10).
disturbance treatments (F3,5 = 3.6, p = 0.10).
12
10
Chipmunk MNKA
8
6
4
2
0
CCON ECON CCUT SW
(100–130 yrs) (80–100 yrs) (12–14 yrs) (0–2 yrs)
Logging Treatment
(Stand Age)
Figure 3. Mean Tamias striatus abundance (minimum number known alive per hectare (MNKA) ± SE)
Figure
across 3. Mean
forest Tamias striatus
disturbance abundance
treatments, (minimum
from number
least (CCON) to known alive per hectare
most disturbed (SW) as(MNKA) ± SE)
quantified by
across forest
frequency disturbance
of harvest treatments,
and stand from least
age (darkness (CCON)
of shading to most disturbed
corresponds (SW) as quantified
to our categorization by
of the degree
frequency of harvest and
of forest disturbance). CCONstand= age (darkness
Contiguous of shading
control; = Embedded
ECONcorresponds to control, CCUT = Clearcut,
our categorization of the
and SW = High-leave shelterwood.
degree of forest disturbance). CCON = Contiguous control; ECON = Embedded control, CCUT =
Clearcut, and SW = High-leave shelterwood.
3.1.6. Chipmunk Plaque-Reduction Neutralization Test (PRNT) for La Crosse Virus Antibodies
3.1.6.Sera
Chipmunk Plaque-Reduction
from 38 Neutralization
chipmunks collected Test (PRNT)
in Montgomery for (BB1
County La Crosse VirusinAntibodies
and BB2) 2009 and 2010
was tested for LACV antibodies. PRNT (at 90% plaque reduction) confirmed the presence of serum
antibodies to LACV in 5 (13%) of 38 chipmunk serum samples. These positive samples were from
disturbed sites (SW = 3, CCUT = 2; Table 4). The prevalence of LACV in chipmunks captured on
logged sites (pooling SW and CCUT treatments) was 2.75 times (95% CI = 0.17, 44.75) greater than the
prevalence in chipmunks captured on the embedded control (ECON) plots. However, there was noInsects 2020, 11, 28 10 of 16
significant difference when results were compared across forest disturbance treatments (χ2 = 1.376,
d.f. = 2, p = 0.50). All titers were low (i.e., ≤1 in 20). Most of the positive samples were collected in
June, with one of the SW positives collected in late July.
Table 4. La Crosse virus antibody prevalence in chipmunks (n = 38) based on plaque-reduction
neutralization testing across forest disturbance treatments, from least (CCON) to most disturbed
(SW), as quantified by frequency of harvest and stand age. Note that no chipmunks were captured
on contiguous control (CCON) sites and thus there were no blood samples to test. A sample
was defined as seropositive if there was a 90% reduction in plaques when compared to the LACV
back-titration. CCON = Contiguous control; ECON = Embedded control, CCUT = Clearcut, and
SW = High-leave shelterwood.
Forest Disturbance Treatment No. Seropositive/Total Tested Seroprevalence
Contiguous Control (CCON) N/A N/A
Embedded Control (ECON) 0/7 0%
Clearcut (CCUT) 2/14 14.3%
Shelterwood (SW) 3/17 17.6%
Overall Total 5/38 13.2%
4. Discussion
Here, we examined how LACV accessory vector abundance varied with forest disturbance
treatment in the southern Appalachians. In contrast to our past work [27] showing that the abundance
of the most common LACV vectors on our sites largely declined with forest disturbance, the abundance
of LACV accessory vectors largely increased with forest disturbance (Figure 2). LACV nucleic acid
detection was greatest on the undisturbed forest sites (Table 2), where the abundance of common LACV
vectors was previously documented to be highest [27]. However, seropositive chipmunks were only
detected on the two disturbed treatments, although this effect was not statistically significant. Overall,
our results suggest that the risk of LACV for humans (as measured by LACV-positive mosquitoes)
may be highest in unlogged forest.
Human risk for LACV has been shown to be correlated with the density of Ae. triseriatus, the
primary LACV vector [56]. This tree-hole mosquito can maintain this bunyavirus in nature through
both transovarial and venereal transmission [15,16,57]. Additionally, LACV can overwinter in the
diapause eggs of Ae. triseriatus [19]. In prior analyses, we found that the abundance of Ae. triseriatus,
which relies largely on shaded areas and forest trees for oviposition [12,58,59], significantly declined
with logging [27]. Here, we showed that La Crosse virus nucleic acid detection in vectors was
significantly affected by disturbance treatment, with higher rates of detection on undisturbed sites. In
fact, 80% (4/5) of our positive mosquito pools were from embedded control sites (Table 2), while only
one positive pool was detected on the shelterwood site. Thus, in agreement with previous work [56],
the higher abundance of Ae. triseriatus on unlogged forest sites may explain the higher detections of
LACV nucleic acid on these sites. However, much to our surprise, none of our detections of LACV
were from Ae. triseriatus.
Although Ae. triseriatus is the primary LACV vector, invasive accessory vectors are increasingly
important for LACV risk [20,49]. Two Asian invasive mosquitoes (the Asian rock pool mosquito,
Ae. japonicus, and the Asian tiger mosquito, Ae. albopictus) have become established in the United
States [60–63], including southwest Virginia [64]. These species are known to be competent vectors
for LACV [55,65], and can become naturally infected [20,21]. In fact, we detected LACV in three
pools of Ae. japonicus but not in any pools of the more abundant primary vector, Ae. triseriatus, which
outnumbered Ae. japonicus by 2.6 to 1 at our sites. The Asian tiger mosquito, Ae. albopictus, is capable
of transovarial LACV transmission [65,66], but the ability of Ae. japonicus to vertically transmit this
virus is unknown. Our past research together with these results show that invasive vector abundanceInsects 2020, 11, 28 11 of 16
is differentially affected by logging, which may have important implications for LACV risk. The Asian
rock pool mosquito (Ae. japonicus) significantly declined with logging [27]. In contrast, here we show
that Ae. albopictus, known to thrive in sunlit urban areas [10,67], appears to do well on both control
treatments and highly disturbed sites, having the highest abundance on the shelterwood (Figure 2).
However, we did not detect LACV in any Ae. albopictus pools in our sample, and recent modeling
work suggests that this species likely does not play an important role in LACV emergence in the
Appalachian region [68].
Accessory LACV vectors include well-established invasive and native mosquitoes, in addition
to the recent Asian invasive species. Therefore, we also examined the influence of logging on two
floodwater mosquitoes, Ae. canadensis and Ae. vexans, and, in past work, Culex species [27]. The La
Crosse virus has been isolated from field-collected Ae. canadensis [20,23,56,69] and Ae. vexans [70].
Although both are considered poor LACV vectors experimentally [71], Ae. canadensis has been shown to
play a role in LACV dynamics in Ohio and West Virginia [23,56]. We found that the abundance of both
Ae. canadensis and vexans was impacted by logging, with the highest abundance of Ae. canadensis found
on the shelterwood and the highest abundance of Ae. vexans on the clearcut (Figure 2). These patterns
are not surprising, because Ae. canadensis utilizes a wide range of transient pools, but Ae. vexans prefers
to lay its eggs in ground depressions in direct sunlight [72]. Although LACV was previously detected
in this species in our region [73], LACV was not detected in the Ae. canadensis pools on our study sites.
However, the low LACV infection rates previously reported [24,56] suggest that it would be difficult to
detect this bunyavirus from our small sample size. Finally, our prior analyses examined the effects of
logging on Cx. pipiens/restuans and found no detectable effects of disturbance on the abundance of this
group [27]. Although known to be ornithophilic, there is evidence that Culex mosquitoes will feed on
mammals [74] and may play a role in LACV dynamics [25,26]. Although both detections of LACV
from Cx. pipiens/restuans in the current study had relatively high CT values (Table 2), our prior work
found that six Cx. pipiens/restuans pools collected in West Virginia were positive for LACV, with CT
values ranging from 34 to 39, and experimental infections indicated that both species are competent
vectors of LACV [26,55]. Further surveillance and research are needed to understand the role of these
accessory species in LACV dynamics.
Although vector abundance has been shown to be most important for LACV risk [56], the presence
of sciurid rodents is also critical for horizontal transmission [38]. Thus, we examined chipmunk
abundance across forest disturbance treatments. While the white-footed mouse (P. leucopus), the
primary reservoir for Lyme disease, is known to increase in abundance with forest fragmentation [4],
the response of T. striatus varies [30–33,75]. Our results indicate that chipmunk abundance (as measured
by MNKA) is not significantly affected by forest logging (Figure 3), although it is interesting to note that
we did not capture any chipmunks on undisturbed control sites. MNKA is known to underestimate
populations [54], so a more extensive mark–recapture study might better elucidate the impact of logging
on chipmunks. Future work should include additional trapping methods to assess the abundance of
other sciurids that influence LACV dynamics (e.g., squirrels).
In addition to examining chipmunk abundance, we assessed their LACV exposure. Once a
chipmunk is infected with LACV, it maintains viremia for an average of 2–3 days [39,76] before
developing lifelong immunity evident by antibody levels [17]. Although we found no significant
difference in the presence of LACV antibodies across the forest treatments, likely due to small sample
sizes, we only detected seropositive chipmunks on disturbed sites (Table 4). These prevalence values
were lower than what has been previously reported for chipmunks in endemic areas, where end of
season seroprevalence rates ranged from 55% to 100% [18]. The feeding behavior of mosquitoes has to
be considered alongside amplifier host antibody prevalence in order to determine resulting risk for
LACV horizontal transmission. Generalist vectors such as Culex spp. may take more bloodmeals from
the abundant rodents on disturbed sites. Alternatively, mammalophilic mosquitoes like Ae. triseriatus
may dilute LACV by taking a higher proportion of non-amplifier (e.g., deer) bloodmeals on disturbed
sites [77,78]. On our sites, there was no detectable difference in deer abundance based on fecal pelletInsects 2020, 11, 28 12 of 16
surveys (C.L. Squibb, unpublished data), but the feeding behavior of vectors may be influenced by
habitat in addition to simply the abundance of potential bloodmeal hosts.
5. Conclusions
Overall, our results together with our past work [27] indicate that the risk of LACV to humans may
generally decrease with forest disturbance, although the role of primary versus accessory vectors across
gradients of forest disturbance requires further research. The primary LACV vector, Ae. triseriatus, and
Ae. japonicus, the invasive species for which we detected several LACV-positive pools, showed a general
decline with logging in our past analyses [27]. Furthermore, the vast majority of our LACV-positive
pools were on unlogged, embedded control sites. Thus, together with prior work showing that human
risk for LACV is correlated with the density of Ae. triseriatus [56], our results suggest that human
LACV risk should generally decline with logging. Notably, all of our LACV detections were from
species generally considered to be accessory vectors (Ae. japonicus and Cx. pipiens/restuans). We also
examined the abundance of the less common Aedes species on our sites and found that the abundance
of these vectors generally increased with logging, although LACV was not detected from any of these
low-abundance species. While the role of forest disturbance in mediating LACV risk from accessory
versus primary vectors remains unclear, our results suggest that, at least in some areas, accessory and
invasive vectors may be playing a larger role in the maintenance of La Crosse virus than currently
thought [79]. It is critical to continue to fully elucidate the role of vectors other than Ae. triseriatus,
as well as the role of environmental changes such as logging in the dynamics of LACV transmission in
Appalachian regions, which continue to be important emerging foci for this disease.
Author Contributions: M.C.H.: Conceptualization, research investigation, data curation, Data analysis,
writing—original draft, funding acquisition. S.D.Z.: Methodology (LACV primer development), Writing—review
and editing. S.L.P.: Research administration, Supervision, resources (field and laboratory), Writing—review and
editing. D.M.H.: Research administration, Supervision, funding acquisition, Data analysis, writing—review
and editing. All authors have read and agreed to the published version of the manuscript.
Funding: Research funding was supported in part by Virginia Tech, Sigma Xi and an NIH Ruth L. Kirschstein
National Research Service Award for Individual Pre-doctoral Fellows [1F31AI080160-01A1].
Acknowledgments: We thank Nate Lambert, Allen Patton, RJ Wilding, Jake Bova, Bonnie Fairbanks, Cari Lynn
Squibb, Noah Thrope, Kylie Perkins, Lindsey McAlexander, Courtney Scarborough, Dorian Jackson, Genevieve
Dudzinsky, Jennifer Miller and Laila Kirkpatrick for field and lab assistance. We thank Jim Adelman for statistical
analysis discussions and Jack Cranford for training, equipment and consultation for the chipmunk mark–recapture
study. We thank Kevin Myles for use of laboratory space and equipment. RNA extraction and LACV RT-PCR
testing of mosquito pools were provided by Bryan Tims, Andrew Luna, Dee Petit and Sean Kelly of Virginia DCLS;
Amy Lambert of CDC; and Laura Kramer of Wadsworth. CDC’s Arboviral Diseases Branch provided training to
M.C.H. (esp. Jason Velez, Olga Kosoy, Marvin Godsey, Amy Lambert and Roger Nasci).
Conflicts of Interest: The authors declare no conflict of interest.
References
1. Vora, N. Impact of anthropogenic environmental alterations on vector-borne diseases. Medscape J. Med. 2008,
10, 238. [PubMed]
2. Walsh, J.F.; Molyneux, D.H.; Birley, M.H. Deforestation: Effects on vector-borne disease. Parasitology 1993,
106, S55–S75. [CrossRef] [PubMed]
3. Allan, B.F.; Keesing, F.; Ostfeld, R.S. Effect of forest fragmentation on Lyme disease risk. Conserv. Biol. 2003,
17, 267–272. [CrossRef]
4. Nupp, T.E.; Swihart, R.K. Effects of forest fragmentation on population attributes of white-footed mice and
eastern chipmunks. J. Mammal. 1998, 79, 1234–1243. [CrossRef]
5. Krohne, D.T.; Hoch, G.A. Demography of Peromyscus leucopus populations on habitat patches: The role
of dispersal. Can. J. Zool. 1999, 77, 1247–1253. [CrossRef]
6. Afrane, Y.A.; Little, T.J.; Lawson, B.W.; Githeko, A.K.; Yan, G.Y. Deforestation and vectorial capacity of
Anopheles gambiae giles mosquitoes in malaria transmission, Kenya. Emerg. Infect. Dis. 2008, 14, 1533–1538.
[CrossRef]Insects 2020, 11, 28 13 of 16
7. Vittor, A.Y.; Gilman, R.H.; Tielsch, J.; Glass, G.; Shields, T.; Lozano, W.S.; Pinedo-Cancino, V.; Patz, J.A.
The effect of deforestation on the human-biting rate of Anopheles darlingi, the primary vector of falciparum
malaria in the Peruvian Amazon. Am. J. Trop. Med. Hyg. 2006, 74, 3–11. [CrossRef]
8. Afrane, Y.A.; Githeko, A.K.; Yan, G.Y. The ecology of Anopheles mosquitoes under climate change: Case
studies from the effects of deforestation in East African highlands. Ann. N. Y. Acad. Sci. 2012, 1249, 204–210.
[CrossRef]
9. Bonneaud, C.; Sepil, I.; Milá, B.; Buermann, W.; Pollinger, J.; Sehgal, R.N.; Valkiūnas, G.; Iezhova, T.A.;
Saatchi, S.; Smith, T.B. The prevalence of avian Plasmodium is higher in undisturbed tropical forests
of Cameroon. J. Trop. Ecol. 2009, 25, 439–447. [CrossRef]
10. Chasar, A.; Loiseau, C.; Valkiunas, G.; Iezhova, T.; Smith, T.B.; Sehgal, R.N.M. Prevalence and diversity
patterns of avian blood parasites in degraded African rainforest habitats. Mol. Ecol. 2009, 18, 121–4133.
[CrossRef]
11. Laurance, S.G.; Jones, D.; Westcott, D.; Mckeown, A.; Harrington, G.; Hilbert, D.W. Habitat fragmentation
and ecological traits influence the prevalence of avian blood parasites in a tropical rainforest landscape.
PLoS ONE 2013, 8, e76227. [CrossRef] [PubMed]
12. Barker, C.M.; Paulson, S.L.; Cantrell, S.; Davis, B.S. Habitat preferences and phenology of Ochlerotatus
triseriatus and Aedes albopictus (Diptera: Culicidae) in southwestern Virginia. J. Med. Entomol. 2003, 40,
403–410. [CrossRef] [PubMed]
13. Haddow, A.D.; Bixler, D.; Schuh, A.J. The Demographic and Socioeconomic Factors Predictive for Populations
at High-Risk for La Crosse Virus Infection in West Virginia. PLoS ONE 2011, 6, e25739. [CrossRef] [PubMed]
14. McJunkin, J.E.; Khan, R.R.; Tsai, T.F. California La Crosse encephalitis. Infect. Dis. Clin. N. Am. 1998, 12,
83–93. [CrossRef]
15. Miller, B.R.; Defoliart, G.R.; Yuill, T.M. Vertical transmission of La Crosse virus (California encephalitis
group)—Transovarial and filial infection rates in Aedes triseriatus (Diptera: Culicidae). J. Med. Entomol. 1977,
14, 437–440. [CrossRef] [PubMed]
16. Thompson, W.H.; Beaty, B.J. Venereal transmission of La Crosse (California encephalitis) arbovirus in Aedes
triseriatus mosquitoes. Science 1977, 196, 530–531. [CrossRef]
17. Moulton, D.W.; Thompson, W.H. California group virus infections in small, forest-dwelling mammals of
Wisconsin: Some ecological consideration. Am. J. Trop. Med. Hyg. 1971, 20, 474–482. [CrossRef]
18. Gauld, L.; Hanson, R.; Thompson, W.; Sinha, S. Observations on a natural cycle of La Crosse virus
(California group) in Southwestern Wisconsin. Am. J. Trop. Med. Hyg. 1974, 23, 983–992. [CrossRef]
19. Watts, D.M.; Thompson, W.H.; Yuill, T.M.; DeFoliart, G.R.; Hanson, R.P. Overwintering of La Crosse virus in
Aedes triseriatus. Am. J. Trop. Med. Hyg. 1974, 23, 694–700. [CrossRef]
20. Lambert, A.J.; Blair, C.D.; D’Anton, M.; Ewing, W.; Harborth, M.M.; Seiferth, R.; Xiang, J.; Lanciotti, R.S.
La Crosse virus in Aedes albopictus mosquitoes, Texas, USA, 2009. Emerg. Infect. Dis. 2010, 16, 856–858.
[CrossRef]
21. Westby, K.; Fritzen, C.; Huang, J.; Jaske, E.; Paulsen, D.; Jones, C.; Moncayo, A. La Crosse encephalitis in
eastern Tennessee: Evidence of invasive mosquito (Aedes albopictus and Ochlerotatus japonicus) involvement
in the transmission of an indigenous disease. Am. J. Trop. Med. Hyg. 2011, 85, 1476–1645.
22. Harris, M.C.; Dotseth, E.J.; Jackson, B.T.; Zink, S.D.; Marek, P.E.; Kramer, L.D.; Paulson, S.L.; Hawley, D.M.
La Crosse virus in Aedes japonicus japonicus Mosquitoes in the Appalachian Region, USA. Emerg. Infect.
Dis. 2015, 21, 646–649. [CrossRef] [PubMed]
23. Berry, R.L.; Parsons, M.A.; Lalondeweigert, B.J.; Lebio, J.; Stegmiller, H.; Bear, G.T. Aedes canadensis, a vector
of La Crosse virus (California serogroup) in Ohio. J. Am. Mosq. Control Assoc. 1986, 2, 73–78.
24. Berry, R.L.; Parsons, M.A.; Restifo, R.A.; Peterson, E.D.; Gordon, S.W. Reed, Kin Ohio: An 18-year retrospective
summary. Prog. Clin. Biol. Res. 1983, 123, 215–223. [PubMed]
25. Thompson, W.H.; Anslow, R.O.; Hanson, R.P.; Defoliart, G.R. La Crosse virus isolations from mosquitoes in
Wisconsin 1964–1968. Am. J. Trop. Med. Hyg. 1972, 21, 90–96. [CrossRef] [PubMed]
26. Harris, M.C.; Jackson, D.M.; Yang, F.; Dotseth, E.J.; Paulson, S.L.; Hawley, D.M. La Crosse virus field detection
and vector competence of Culex mosquitoes. Am. J. Trop. Med. Hyg. 2015, 93, 461–467. [CrossRef]
27. Hopkins, M.C.; Thomason, C.A.; Brown, B.L.; Kirkpatrick, L.T.; Paulson, S.L.; Hawley, D.M. Experimental logging
alters the abundance and community composition of ovipositing mosquitoes in the southern Appalachians.
Ecol. Entomol. 2018, 43, 463–472. [CrossRef]Insects 2020, 11, 28 14 of 16
28. Antonovics, J.; Iwasa, Y.; Hassell, M.P. A generalized-model of parasitoid, venereal, and vector-based
transmission processes. Am. Nat. 1995, 145, 661–675. [CrossRef]
29. Mather, T.N.; Nicholson, M.C.; Donnelly, E.F.; Matyas, B.T. Entomologic index for human risk of Lyme disease.
Am. J. Epidemiol. 1996, 144, 1066–1069. [CrossRef]
30. Kellner, K.F.; Urban, N.A.; Swihart, R.K. Short-Term Responses of Small Mammals to Timber Harvest in the
United States Central Hardwood Forest Region. J. Wildl. Manag. 2013, 77, 1650–1663. [CrossRef]
31. Kirkland, G.L. Responses of small mammals to clearcutting of northern Appalachian forests. J. Mammal.
1977, 58, 600–609. [CrossRef]
32. Krull, J.N. Response of chipmunks and red squirrels to commercial clear-cut logging. N. Y. Fish Game J. 1970,
17, 58–59.
33. Yahner, R.H. Dynamics of a small mammal community in a fragmented forest. Am. Midl. Nat. 1992, 127,
381–391. [CrossRef]
34. Slajchert, T.; Kitron, U.D.; Jones, C.J.; Mannelli, A. Role of the eastern chipmunk (Tamias striatus) in the
epizootiology of Lyme borreliosis in northwestern Illinois, USA. J. Wildl. Dis. 1997, 33, 40–46. [CrossRef]
[PubMed]
35. Hersh, M.H.; Tibbetts, M.; Strauss, M.; Ostfeld, R.S.; Keesing, F. Reservoir competence of wildlife host species
for Babesia microti. Emerg. Infect. Dis. 2012, 18, 1951–1957. [CrossRef]
36. Johnson, R.C.; Kodner, C.; Jarnefeld, J.; Eck, D.K.; Xu, Y.N. Agents of Human Anaplasmosis and Lyme
Disease at Camp Ripley, Minnesota. Vector Borne Zoonotic Dis. 2011, 11, 1529–1534. [CrossRef]
37. Platt, K.B.; Tucker, B.J.; Halbur, P.G.; Tiawsirisup, S.; Blitvich, B.J.; Fabiosa, F.G.; Bartholomay, L.C.; Rowley, W.A.
West Nile virus viremia in eastern chipmunks (Tamias striatus) sufficient for infecting different mosquitoes.
Emerg. Infect. Dis. 2007, 13, 831–837. [CrossRef]
38. Gauld, L.W.; Yuill, T.M.; Hanson, R.P.; Sinha, S.K. Isolation of La Crosse virus (California encephalitis group)
from the chipmunk (Tamias striatus), an amplifier host. Am. J. Trop. Med. Hyg. 1975, 24, 999–1005. [CrossRef]
39. Patrican, L.; DeFoliart, G.; Yuill, T. La Crosse viremias in juvenile, subadult and adult chipmunks
(Tamias striatus) following feeding by transovarially-infected Aedes triseriatus. Am. J. Trop. Med. Hyg.
1985, 34, 596–602. [CrossRef]
40. Belote, R.T.; Jones, R.H.; Hood, S.M.; Wender, B.W. Diversity-invasibility across an experimental disturbance
gradient in Appalachian forests. Ecology 2008, 89, 183–192. [CrossRef]
41. Atwood, C.J.; Fox, T.R.; Loftis, D.L. Effects of alternative silviculture on stump sprouting in the southern
Appalachians. For. Ecol. Manag. 2009, 257, 1305–1313. [CrossRef]
42. Homyack, J.A.; Haas, C.A. Effects of repeated-stand entries on terrestrial salamanders and their habitat.
Southeast. Nat. 2013, 12, 353–366. [CrossRef]
43. Atwood, C.J. Effects of Alternative Silvicultural Treatments on Regeneration in the Southern Appalachians.
Ph.D. Thesis, Virginia Tech, Blacksburg, VA, USA, 2008.
44. Jackson, B.T.; Paulson, S.L.; Youngman, R.R.; Scheffel, S.L.; Hawkins, B. Oviposition preferences of Culex
restuans and Culex pipiens (Diptera: Culicidae) for selected infusions in oviposition traps and gravid traps.
J. Am. Mosq. Control Assoc. 2005, 21, 360–365. [CrossRef]
45. Stone, C.M.; Foster, W.A. Plant-sugar feeding and vectorial capacity. In Ecology of Parasite-Vector Interactions;
Wageningen Academic Publishers: Wageningen, The Netherlands, 2013; Volume 3, pp. 35–79.
46. Saul, S.H.; Grimstad, P.R.; Craig, G.B. Identification of Culex species by electrophoresis. Am. J. Trop. Med. Hyg.
1977, 26, 1009–1012. [CrossRef]
47. Harrington, L.C.; Poulson, R.L. Considerations for accurate identification of adult Culex restuans (Diptera:
Culicidae) in field studies. J. Med. Entomol. 2008, 45, 1–8. [CrossRef]
48. Nasci, R.S.; Gottfried, K.L.; Burkhalter, K.L.; Kulasekera, V.L.; Lambert, A.J.; Lanciotti, R.S.; Hunt, A.R.;
Ryan, J.R. Comparison of Vero cell plaque assay, TaqMan (R) reverse transcriptase polymerase chain reaction
RNA assay, and VecTest (TM) antigen assay for detection of West Nile virus in field-collected mosquitoes.
J. Am. Mosq. Control Assoc. 2002, 18, 294–300.
49. Gerhardt, R.R.; Gottfried, K.L.; Apperson, C.S.; Davis, B.S.; Erwin, P.C.; Smith, A.B.; Panella, N.A.; Powell, E.E.;
Nasci, R.S. First isolation of La Crosse virus from naturally infected Aedes albopictus. Emerg. Infect. Dis. 2001,
7, 807–811. [CrossRef]
50. Lambert, A.J.; Nasci, R.S.; Cropp, B.C.; Martin, D.A.; Rose, B.C.; Russell, B.J.; Lanciotti, R.S. Nucleic acid
amplification assays for detection of La Crosse virus RNA. J. Clin. Microbiol. 2005, 43, 1885–1889. [CrossRef]You can also read