Copper and Copper/Zinc Ratio in a Series of Cystic Fibrosis Patients - MDPI
←
→
Page content transcription
If your browser does not render page correctly, please read the page content below
nutrients
Article
Copper and Copper/Zinc Ratio in a Series of Cystic
Fibrosis Patients
Marlene Fabiola Escobedo-Monge 1, * , Enrique Barrado 2 , Carmen Alonso Vicente 3 ,
María Antonieta Escobedo-Monge 4 , María Carmen Torres-Hinojal 1 ,
José Manuel Marugán-Miguelsanz 3 and María Paz Redondo del Río 1
 1   Faculty of Medicine, Valladolid University, Avenida Ramón y Cajal, 7, 47005 Valladolid, Spain;
     mctorresh@telefonica.net (M.C.T.-H.); paz.redondo@uva.es (M.P.R.d.R.)
 2   Department of Analytical Chemistry, Science Faculty, Campus Miguel Delibes, University of Valladolid,
     Calle Paseo de Belén, 7, 47011 Valladolid, Spain; ebarrado@qa.uva.es
 3   Department of Pediatrics of the Faculty of Medicine, Valladolid University, Section of Gastroenterology and
     Pediatric Nutrition, University Clinical Hospital of Valladolid, Avenida Ramón y Cajal, 7, 47005 Valladolid,
     Spain; carmenalonso@gmail.com (C.A.V.); jmmarugan@telefonica.net (J.M.M.-M.)
 4   Department of Chemistry, Science Faculty, University of Burgos, Plaza Misael Bañuelos sn, 09001 Burgos,
     Spain; antoitalia777@gmail.com
 *   Correspondence: amescobedo@msn.com; Tel.: +34-639-590-467

 Received: 12 October 2020; Accepted: 28 October 2020; Published: 30 October 2020

 Abstract: Cystic fibrosis (CF) patients require a stable and sufficient supply of micronutrients.
 Since copper is an essential micronutrient for human development, a cross-sectional study was carried
 out to investigate the serum copper levels, serum copper/zinc (Cu/Zn) ratios, and their relationship
 with nutritional indicators in a group of CF patients. Anthropometric, biochemical, and dietary
 measurements, an abdominal ultrasound, and respiratory and pancreatic tests were conducted.
 Seventeen CF patients were studied (10 females, 59%), 76.5% of whom were ∆F580. Their mean
 serum copper (113 ± 23 µg/dL) was normal, and there was only one teenager with hypocupremia
 (6%) and two children with hypercupremia (18%). A significant association between serum copper
 and zinc levels was discovered. The Cu/Zn ratio was higher than 1.00 for 94% of patients, which is an
 indicator of an inflammation status. There was no significant correlation between the serum copper
 concentrations and respiratory and pancreatic function, respiratory colonization, and the results
 of the abdominal ultrasound. Linear regression analysis showed that serum copper had a positive
 association with both the Z-score body mass index (BMI) and mean bone conduction speed (BCS).
 Therefore, since 94% of CF patients had a Cu/Zn ratio > 1.00, this factor must alert us to consider the
 risk of zinc deficiency and high inflammatory response. The measurement of serum zinc alone does
 not show one’s zinc status. However, the Cu/Zn ratio may be an indicator of zinc deficiency and the
 inflammatory status of CF patients.

 Keywords: hypocupremia; hypercupremia; inflammatory response; risk of zinc deficiency;
 serum copper/zinc ratio

1. Introduction
     Cystic fibrosis (CF), also called mucoviscidosis, is recognized as an important genetic disease
worldwide [1]. It is an autosomal recessive disorder that commonly affects white people with an annual
incidence of approximately 1 in 3500 live births [2]. This multisystem disorder is characterized by
genetic mutations in the CF transmembrane conductance regulator (CFTR) gene on chromosome 7,
which encodes a protein that is essential for the regulation of transmembrane chloride reabsorption [3].
Mutations in CFTR result in channelopathy, with impaired sodium and chloride conductance

Nutrients 2020, 12, 3344; doi:10.3390/nu12113344                                  www.mdpi.com/journal/nutrients
Nutrients 2020, 12, 3344 2 of 16
obstructing the mucosa of the exocrine glands [4], affecting a variety of organs, including the lungs,
pancreas, intestine, and hepatobiliary tract [5]. More importantly, CF is characterized by a progressive
lung infection and exocrine pancreatic dysfunction due to the production of altered sweat and increased
mucus production in the lungs and digestive system [6]. Lung disease is the most closely associated
cause of morbidity and mortality in these patients [7]. However, pancreatic disease presents the highest
penetrance regarding the severity and consequences of CF, as the pancreas is one of the first organs to
be affected by this disease [8].
In CF, there is a strong association between nutritional status and lung function, and therefore
life expectancy [9]. With increasing longevity, the burden and prevalence of comorbidities increase,
which includes CF-related diabetes (CFRD), CF-related liver disease (CFLD), and CF-related kidney
and bone disease, along with the increased chance for obesity and overweight, which were all reported
in CF patients [5,10,11]. CF is closely related to a poor nutritional status, which is linked directly to
factors associated with the genetic mutation underlying this disease [12]. In addition to a decreased
nutrient intake, especially during periods of acute illness [13], the risk of nutritional deficiencies
in CF patients is likely to be due to several coexisting factors, such as the malabsorption of fat,
protein, energy, and micronutrients that are secondary to pancreatic insufficiency, the alteration in bile
salts, the increase in energy needs due to the deterioration in lung function, chronic inflammation,
and not only microbial colonization but also recurrent lung infection [14]. Although the prevalence of
fat-soluble vitamin deficiencies (vitamins A, D, E, and K) and the need for their supplementation in CF
is well known [13], other micronutrient deficiencies, such as minerals and trace elements, are not well
established, especially during acute exacerbations [15].
Copper is an enigmatic ion that has an important role in biological systems [16]. It is a transition
metal that exists in two forms: Cu+ is the reduced cuprous form and Cu2+ is the oxidized cupric form of
copper [17,18]. This important dietary ion fulfills essential structural functions in enzymes [16], such as
cytochrome oxidase, superoxide dismutase, monoamine oxidase, and lysyl oxidase [19]. Furthermore, it is
considered a critical cofactor for a group of cellular transporters, namely, the cuproenzymes [17]. Organ meats,
nuts, seeds, chocolate, and shellfish are rich sources of copper [18]. However, due to the ability of copper to
alternate between two oxidation states, and since free copper is toxic, most of the cellular copper is tightly
bound [16]. Copper is essential for the proper functioning of the human body, as it mainly intervenes in
metabolic processes, such as the synthesis of hemoglobin, the function of neurotransmitters, the oxidation of
iron, cellular respiration, amidation of antioxidant peptides, and the formation of pigments and connective
tissue [17]. Copper is necessary for growth, defense mechanisms, bone mineralization, the maturation of red
and white blood cells, iron transport, cholesterol metabolism, myocardial contractility, glucose metabolism,
and brain development [20].
Even though its deficiency is more commonly an acquired condition that is induced by the imbalance
between need and dietary copper supply [21], it has been reported in subjects with malabsorption
of copper due to malabsorption syndromes, such as celiac disease, tropical and nontropical sprue,
CF, and short-bowel syndrome [22]; resulting from intestinal resection (gastric surgery, including gastric
bypass or gastrectomy) [23]; the excessive use of copper chelators, antacids, zinc supplement overuse,
parenteral overdosing, and denture cream ingestion with zinc; chronic parenteral nutrition without proper
copper supplementation and prolonged jejunal enteral feeding; a diet low in copper; other unknown
causes [24]. Furthermore, copper deficiency can occur in premature infants who are fed formulas with
inadequate copper content, newborns with chronic diarrhea or malnutrition, and patients undergoing
prolonged dialysis or who have suffered severe burns [25]. Since copper is involved in many bodily
functions, its deficiency can cause a wide range of symptoms [26] that occur in stages of increasing
severity (marginal, moderate, and severe clinical deficiencies) [27]. Anemia, neutropenia, and bone
abnormalities are the most frequent clinical manifestations of copper deficiency [21].
Nevertheless, although serum copper is a reliable indicator of its deficiency and falls to very
low concentrations in people with copper deficiency, it does not reflect dietary intake, except when
the intake is below a certain level [28]. In addition, the serum concentration of copper returns toNutrients 2020, 12, 3344 3 of 16
normal values a few days after its supplementation [20]. The ineffective absorption of copper from the
diet, or excessive loss of copper through bile, can cause systematic copper deficiency and it occurs in
CF [25]. Furthermore, as is well known, the nutritional status of CF patients has a great impact on their
life expectancy, and continuous monitoring to improve their nutritional status is a primary goal of
treatment in each patient [29]. For this reason, it was hypothesized whether an abnormal serum copper
level was prevalent in a series of CF patients under nutritional control. Therefore, the main objective of
this study was to investigate the serum copper levels, the copper/zinc ratio, and its relationship with
nutritional indicators in a group of patients with cystic fibrosis. The nutritional status of zinc in this
group has already been published [30].
2. Materials and Methods
The study design was cross-sectional and was conducted at the Nutrition Unit of the Pediatrics
Service at the University Clinical Hospital in Valladolid for 18 months. The study was conducted
according to the Declaration of Helsinki and the protocol was approved by the University Clinical
Hospital Ethics Committee (INSALUD-Valladolid, 14 February 2002). The study population included
both pediatric and adult CF patients. All subjects gave their informed consent for inclusion before
they participated in the study. The inclusion criteria were children with a proven diagnosis of CF.
Exclusion criteria were refusal to take part, hospital admission, and suffering from an acute infection.
Detailed study methods regarding assessing zinc nutritional status in this series are reported
elsewhere. Briefly, this nutritional study included an assessment of phenotypic characteristics, a blood test,
a dietary survey, and a specific assessment of respiratory and pancreatic functions [30]. Figure 1 shows
the flowchart of this cross-sectional study. In this series, the genotype of the participants, as well as the
Norman–Crispin score (>5), the forced vital capacity (FVC% < 80%) and the forced expired volume in
1 s (FEV1 < 80%) to estimate respiratory sufficiency (SR) and insufficiency (IR), and the fat absorption
coefficient (CFA > 94%) to evaluate pancreatic sufficiency (PS) and insufficiency (PI) were studied and
published [30]. An abdominal ultrasound was taken to assess the digestive tract status.
In addition to the evaluation of weight (W) and height (H), BMI, BMI–height–age, and their
corresponding indicators, Z-score, and growth rate were measured [30–32]. The circumference of the wrist,
hip, waist, mid-arm, triceps, biceps, and subscapular and suprailiac folds (Holtain skinfold gauge, pressure
10 g/mm3 ) were measured to obtain the waist–hip ratio, waist–height index, muscular area of the middle
of the arm (MAMA), fat-free mass (FFM), and fat mass (FM). Body composition was measured using
anthropometry and bioelectrical impedance analysis with an RJL Systems single frequency impedance
analyzer [RJL BIA-101 (RJL System, Detroit, MI, USA)] (source). Bone densitometry by ultrasound [DBM
Sonic 1200 IGEA (Emsor S.A., Madrid. Spain] was measured through the BCS of the last four fingers of
the non-dominant hand [33]. Basal energy expenditure (EE) or resting EE (REE) was measured using
fasting indirect calorimetry (IC) with a canopy system [Deltatrac II (Datex-Ohmeda. Helsinki. Finland)]
in standardized conditions.
Apart from the evaluation of a complete blood count, the blood analysis included biochemical
analysis of acute-phase proteins, C reactive protein (CRP), and the erythrocyte sedimentation rate (ESR);
the evaluation of the serum concentration of copper and zinc [30] was done using atomic absorption
spectrophotometry (model PU9400 Philips Scientific, Cambridge, UK) [34]. Less than 70 µg/dL and
more than 140 µg/dL were the cut-offs used to categorize hypo- and hypercupremia, respectively [35].
The Cu/Zn ratio as an alternative biomarker for assessing inflammatory and nutritional status and
adverse clinical outcomes was measured [36], where its normal values range from 0.7 to 1.0 [37].
The zinc/copper (Zn/Cu) ratio was also evaluated.
A 24 h food diary was recorded for 3 days and the collection of information on the habitual diet of the
participants was verified using an in-depth interview (approximately 90 min). Through this prospective
dietary survey of 72 h, including a weekend day, the daily energy intake (IE); proteins; carbohydrates;
lipids; monounsaturated, polyunsaturated, and saturated fats; fiber; vitamins A, B1, B2, B6, B12, C, D,
and E; niacin; folic acid; calcium; magnesium; iron; iodine; zinc intake were measured using the Mataixthey participated in the study. The inclusion criteria were children with a proven diagnosis of CF.
Exclusion criteria were refusal to take part, hospital admission, and suffering from an acute infection.
Detailed study methods regarding assessing zinc nutritional status in this series are reported
elsewhere. Briefly, this nutritional study included an assessment of phenotypic characteristics, a
Nutrients test,12,a 3344
blood2020, 4 of[30].
dietary survey, and a specific assessment of respiratory and pancreatic functions 16
Figure 1 shows the flowchart of this cross-sectional study. In this series, the genotype of the
participants, as well as the Norman–Crispin score (>5), the forced vital capacity (FVC% < 80%) and
Food and Health computer program [38]. Less than 80% of the percentage of the Dietary Reference
the forced expired volume in 1 s (FEV1 < 80%) to estimate respiratory sufficiency (SR) and
Intake (% DRI) and more than 120% DRI were considered inadequate intakes. Besides pancreatic
insufficiency (IR), and the fat absorption coefficient (CFA > 94%) to evaluate pancreatic sufficiency
enzyme replacement therapy (PERT) and fat-soluble vitamin supplements, the patients did not receive
(PS) and insufficiency (PI) were studied and published [30]. An abdominal ultrasound was taken to
zinc or copper supplements.
assess the digestive tract status.
CYSTIC FIBROSIS
n = 17
INCLUDED
EXCLUDED
n = 17
n=0
BONE DENSITOMETRY
BASAL ENERGY EXPENDITURE
RESPIRATORY AND PANCREATIC
FUNCTION
PROSPECTIVE DIETARY BLOOD ANALYTICAL
ANTHROPOMETRIC ASSESSMENT SURVEY Serum copper
BODY COMPOSITION 72 hours including a Serum zinc
weekend days
PREVALENCE OF
DIEARY DEFICIENCY
NUTRITIONAL STATUS HYPOCUPREMIANutrients 2020, 12, 3344 5 of 16
a significant difference between the 64.7% of CF patients with PI and a normal abdominal ultrasound
result and the 23.5% with PS and an abnormal abdominal ultrasound result (p = 0.0001).
Table 1. Baseline demographic and clinical characteristics of participants (n = 17 *) [30].
Mean ± SD or
Characteristics Median Range
No. (%)
Age (years) 14.8 ± 8 15 2–31
Anthropometric Assessment
Body mass index Z-score −0.95 ± 1.1 −0.6 −3.8 to 0.6
Average conduction velocity Z-score 0.3 ± 0.9 −0.0 −1.6 to 1.4
Indirect Calorimetry (calories)
Basal energy expenditure 1078 ± 303 1149 440–1490
Theoretical basal energy expenditure 2193 ± 576 2200 1066–3251
WHO recommended basal energy
1185 ± 233 1230 598–1559
expenditure
Blood Analytics
Serum copper level (µg/dL) 113 ± 23.5 113 69–158
Serum zinc level (µg/dL) 87.2 ± 16.7 86 58–122
Copper/zinc ratio 1.32 ± 0.28 1.33 0.73–2.00
Zinc/copper ratio 0.79 ± 0.18 0.75 0.5–1.38
Complement C3 (mg/dL) 117 ± 24 110 80–165
Complement C4 (mg/dL) 21 ± 6 20 15–35
Lymphocytes NK CD16+56 (%) 10.8 ± 5.8 9 2–22
Gamma glutamyl transpeptidasa (U/L) 20.9 ± 19.3 13 7–70
Prospective Dietary Survey
Energy intake (calories) 2595 ± 464 2672 1846–3410
Vitamin C intake (percentage of dietary
170 ± 141 131 13–461
reference intake)
Zinc intake (percentage of dietary
97 ± 26.9 98 54.9–153.9
reference intake)
Comorbidities (%)
Undernutrition 5 (29.4%)
Anemia by iron deficiency 5 (29.4%)
Hypocupremia 1 (5.9%)
Hypercupremia 5 (29.4%)
Hypozincemia 3 (17.6%)
Dietary zinc deficiency 4 (23.5%)
Abnormal abdominal ultrasound 5 (29.4%)
* Seventeen cystic fibrosis patients were screened, included, and analyzed. WHO: World Health Organization.
The median and mean serum copper of 113 ± 23 µg/dL (Q1–3, 100–125 µg/dL) was normal
and it ranged between 69 and 158 µg/dL. Although females patients presented higher serum copper
(116 µg/dL) than males (109 µg/dL) and the mean serum copper of children (125 µg/dL) was higher
than that of adults (114 µg/dL) and adolescents (96 µg/dL), these differences were not significant.
There was no significant difference in serum copper when comparing patients with high and low
abdominal ultrasound results, sufficient and insufficient respiratory and pancreatic function, as well as
patients with or without respiratory colonization (Table 2). Mean serum copper was significantly
lower in the undernourished (90 ± 14.1 µg/dL) than in the eutrophic (122.7 ± 19.7 µg/dL, p = 0.004)
CF patients. There was a male teenager (6%) with hypocupremia and two female children (12%)
with hypercupremia, where all of them were eutrophic. Table 3 shows the significant correlations and
regression analysis between serum copper and the nutritional parameters studied. Serum copper did
not correlate with dietary zinc, calcium, magnesium, and iron intakes. CF patients with RI had moreNutrients 2020, 12, 3344 6 of 16
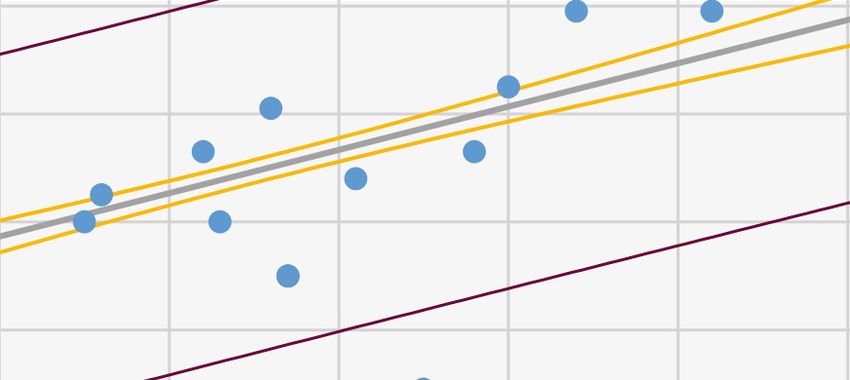
dietary zinc intake (112.5 ± 23.6% DRI) than RS (81.5 ± 20.8% DRI, p = 0.015). Serum copper decreased
slightly with increasing age (Figure 2), and the serum copper and zinc levels had a direct association
when they were adjusted by age (Figure 3).
Table 2. Differences between fibrosis cystic patients.
Characteristics Male Female p-Value
Age (years) 10.4 ± 7.2 17.2 ± 7.9 0.091
Serum copper level (µg/dL) 109.3 ± 23.4 115.7 ± 24.5 0.596
Colonization Yes No
Serum copper level (µg/dL) 119 ± 24 102.2 ± 19.8 0.098
Forced vital capacity 76.9 ± 24.2 94.5 ± 53.7 0.478
Forced expired volume in 1 second 74.9 ± 27.3 84.9 ± 27.5 0.511
Nutritional Status Undernutrition Eutrophic
Serum copper level (µg/dL) 90 ± 14.1 122.7 ± 19.7 0.004
Acute Phase Reactants ERS high Normal
Serum copper level (µg/dL) 116.4 ± 20.2 112 ± 38.2 0.700
Acute Phase Reactants CRP high Normal
Serum copper level (µg/dL) 112.7 ± 23 158 0.154
Respiratory Function Sufficient Insufficient
Serum copper level (µg/dL) 105.1 ± 23.3 120.1 ± 22.5 0.277
Dietary zinc intake (%DRI)) 81.5 ± 20.8 112.5 ± 23.6 0.015
Pancreatic Function Sufficient Insufficient
Serum copper level (µg/dL) 115.5 ± 29.7 112.3 ± 22.6 1.000
ERS: erythrocyte sedimentation rate; CRP: C reactive protein. %DRI: percentage of dietary reference intake.
Table 3. Significant correlations and regression analysis between serum copper and nutritional parameters.
Serum Copper Level
Nutritional Parameters Spearman’s Rho Test Linear Regression Analysis
r p-Value R2 p-Value
Body mass index 0.489 * 0.046 0.236 0.048
Average conduction velocity 0.517 * 0.040 0.275 0.037
Vitamin C intake −0.651 ** 0.040 0.270 0.039
Serum zinc 0.467 0.059 0.376Nutrients 2020, 12, 3344 7 of 16
Nutrients 2020,
Nutrients 2020, 12,
12, xx FOR
FOR PEER
PEER REVIEW
REVIEW 77 of
of 16
16
(µg/dL)
copper(µg/dL) 160
160
140
140
120
120
andcopper
100
100
zincand
80
80
Serumzinc
Serum
60
60
40
40
00 55 10
10 15
15 20
20 25
25 30
30 35
35
Age (years)
Age (years)
Training set
Training set (serum
(serum copper)
copper) Model (serum
Model (serum copper)
copper)
Training set
Training set (serum
(serum zinc)
zinc) Model (serum
Model (serum zinc)
zinc)
Figure 2.
Figure 2. Regression
Regression serum
Regression serum copper and
serum copper and zinc
zinc (μg/dL)
(μg/dL) by
(µg/dL) by age.
age.
180
180
(R² == 0.376)
(R² 0.376)
160
160
140
(µg/dL)
140
copper(µg/dL)
120
120
Serumcopper
100
100
Serum
80
80
60
60
40
40
50
50 60
60 70
70 80
80 90
90 100
100 110
110 120
120 130
130
Serum zinc
Serum zinc (µg/dL)
(µg/dL)
Model
Model Conf. interval
Conf. interval (mean
(mean 95%)
95%) Conf. interval
Conf. interval (obs
(obs 95%)
95%)
Figure 3.
Figure 3. Regression
Regression serum
serum copper
copper (70–140
(70–140 μg/dL)
μg/dL) by zinc
zinc (70–120
(70–120 μg/dL)
μg/dL) adjusted
adjusted for
for age and
and cut-
cut-
Figure 3. Regression serum copper (70–140 µg/dL) byby
zinc (70–120 µg/dL) adjusted for age age
and cut-offs.
offs.
offs.
The mean Cu/Zn ratio of 1.32 ± 0.28 (Q1–3, 1.19–1.38) and range from 0.73 to 2.0 was higher than
The mean
The
the normal mean
valueCu/Zn
Cu/Zn ratio
(rangeratio
fromofof0.7
1.32
to ±±1.0)
1.32 0.28
0.28 (Q1–3,
(Q1–3,
[37] and 94%1.19–1.38)
1.19–1.38) and range
and range
of CF patients from
hadfrom 0.73 to
0.73
a Cu/Zn to 2.0
2.0>was
ratio was
1.00.higher
higher than
than
The mean
the
the
Zn/Cunormal
normal value
ratiovalue (range
(range
was 0.79 from 0.7
from(Q1–3,
± 0.19 to
0.7 to 1.0)1.0) [37] and
[37] and
0.72–0.84) and 94%
94% of CF patients
of CFfrom
ranged patients had
had
0.5 to a Cu/Zn
a Cu/Zn
1.38. ratio > 1.00.
ratio > ratio
The Cu/Zn The
1.00. had
The
amean
mean Zn/Cu
Zn/Cu
direct ratio was
ratio was 0.79
and significant 0.79 ±± 0.19
0.19 (Q1–3,
correlation (Q1–3, 0.72–0.84)
with 0.72–0.84) and ranged
and ranged from
protein, monosaturated from 0.5 to
0.5
lipids, to 1.38. The
1.38.
niacin The Cu/Zn
Cu/Zn
intake, ratio had
ratio had
triglycerides,
a
aanddirect
direct and significant
and significant
gamma-glutamyl correlation
correlation with
transpeptidase, with protein,
and aprotein,
negative monosaturated
monosaturated
association with lipids,
lipids, niacin intake,
niacin intake,
polyunsaturated triglycerides,
triglycerides,
lipids intake and
and gamma-glutamyl
and gamma-glutamyl
monocytes. transpeptidase,
Between thetranspeptidase,
Cu/Zn and Zn/Cu andratios,
and aa negative
negative association
association
there was with
with
a negative polyunsaturated
(r = −0.998;
polyunsaturated
association lipids
lipids intake
p = intake
0.000).
and
The monocytes.
and found
monocytes. Between
Zn/CuBetween
ratio hadthethe Cu/Zn
Cu/Zn
almost the andand Zn/Cu
sameZn/Cu ratios, there
ratios, but
associations there was
was
in an a negative
a negative
inverse association
association
relationship (r =
as the(rCu/Zn−0.998;
= −0.998; pp
ratio.
= 0.000). The found Zn/Cu ratio had almost the same associations but in an inverse
= 0.000). The found Zn/Cu ratio had almost the same associations but in an inverse relationship as the relationship as the
Cu/Zn ratio.
Cu/Zn ratio. All
All of
of them
them had
had aa low
low percentage
percentage of of lymphocytes
lymphocytes T T (CD3)
(CD3) and and ThTh (CD4).
(CD4). Although
Although the the
mean complement C3 (117 mg/dL, Figure 4), complement C4 (21 mg/dL,
mean complement C3 (117 mg/dL, Figure 4), complement C4 (21 mg/dL, Figure 5), and lymphocytes Figure 5), and lymphocytesNutrients 2020, 12, 3344 8 of 16
All of them had a low percentage of lymphocytes T (CD3) and Th (CD4). Although the mean complement
Nutrients 2020,
Nutrients 2020, 12,
12, xx FOR
FOR PEER
PEER REVIEW
REVIEW 88 of
of 16
16
C3 (117 mg/dL, Figure 4), complement C4 (21 mg/dL, Figure 5), and lymphocytes NK CD16+56 (10.8%)
were normal, linear regression analysis showed that all of them had a positive association with serum
NK CD16+56 (10.8%) were normal, linear regression analysis showed that all of them had a positive
copper. CRPwith
association was slightly increased
serum copper. in the
CRP wasadolescent with hypercupremia.
slightly increased The CRP
in the adolescent andhypercupremia.
with ESR levels were
correlated with the Cu/Zn ratio.
The CRP and ESR levels were correlated with the Cu/Zn ratio.
250
200
(R² = 0.350)
(µg/dL)
copper (µg/dL)
150
Serum copper
100
Serum
50
0
70 90 110 130 150 170
Complement C3
Model Conf. interval (mean 95%) Conf. interval (obs 95%)
Figure 4. Regression
Regression serum copper by complement C3.
250
200
(R² = 0.535)
(µg/dL)
copper (µg/dL)
150
Serum copper
100
Serum
50
0
10 15 20 25 30 35 40
Complement C4
Model Conf. interval (mean 95%) Conf. interval (obs 95%)
Figure 5.
Figure 5. Regression
Regression serum
serum copper by complement
copper by complement C4.
C4.
The mean
The meanbasal
basal
EEEE
waswas lower
lower than than the theoretical
the theoretical basal EEbasal EE (pbut
(p = 0.001) = was
0.001) but was
adequate adequate
according to
according
the World to the World
Health Health Organization’s
Organization’s (WHO’s) recommendation (p = 0.074). The
(WHO’s) recommendation (p =mean
0.074).diet
Thewas
mean diet
high in
was high in protein with adequate carbs, fiber, and EI. The diet was adequate, except for the low
iodine intake. Serum copper did not correlate with the zinc, calcium, magnesium, and iron intakes.
CF patients with RI had more zinc intake (112.5% DRI) than RS (81.5% DRI, p = 0.015). Only vitamin
C intake had a negative association with serum copper (Table 3).Nutrients 2020, 12, 3344 9 of 16
protein with adequate carbs, fiber, and EI. The diet was adequate, except for the low iodine intake.
Serum copper did not correlate with the zinc, calcium, magnesium, and iron intakes. CF patients with
RI had more zinc intake (112.5% DRI) than RS (81.5% DRI, p = 0.015). Only vitamin C intake had
a negative association with serum copper (Table 3).
4. Discussion
Cystic fibrosis is a multisystem disorder involving the pulmonary, gastrointestinal, endocrine,
musculoskeletal, and the male genitourinary systems, as well as the sinuses [4]. PI is one of the main
factors of CF morbidity. More than 85% of CF patients show evidence of malabsorption from exocrine
PI [39], leading to fat malabsorption, predisposing them to a severe deficiency of fat-soluble vitamins
(A, D, E, and K) and trace elements, such as calcium, magnesium, iron, copper, and zinc [40]. Although the
information on serum copper levels in patients with CF is scanty [4], the mucus (sputum) of patients
with CF reveals that there are traces of metals, mostly iron and copper, but also zinc [6], and in separate
in vitro studies, these metals have been shown to induce Pseudomonas aeruginosa resistance to carbapenem
antibiotics [41]. Additionally, deficiencies of copper can result in iron deficiency anemia [42], osteoporosis and
joint problems [43], and increased susceptibility to infection that is secondary to poor immune function [44].
Therefore, the main aim of this study was to investigate the serum copper level, Cu/Zn ratio, and its
relationship with nutritional indicators in CF patients.
Even though there were few CF patients in this study, we must consider that both the median and
mean serum copper (113 ± 23 µg/dL) were normal (range from 70 to 140 µg/dL) [35] and agreed
with the mean serum copper (115 ± 91 µg/dL) in twenty-seven north Indian children with CF
(from 3 months to 12 years) [45]. Nevertheless, it was significantly lower in comparison to the mean
serum copper (134.5 ± 25.7 µg/dL, p = 0.004) found in healthy children aged 1 to 18 years who had
not received any vitamin or mineral supplements [46]. Although low levels of serum and plasma
copper, ceruloplasmin, and superoxide dismutase in red blood cells can show a severe copper deficiency,
they are not sensitive to a marginal copper state [47]. Furthermore, the response to inflammation and
infection can alter serum copper and not determine its deficiency [48]. According to different studies,
pediatric reference intervals for serum copper are often difficult to establish [49]. Moreover, patients with
CF serum copper and ceruloplasmin levels show variable results [50]. We must bear in mind that the
consequences of borderline copper deficiency may have little effect on a normal individual but may have
more serious consequences for CF patients [48]. Therefore, its assessment is essential for CF patients.
Milne et al. reported that serum copper changes according to age and sex [51]. Regarding sex,
although females had a higher serum copper (116 µg/dL) than males (109 µg/dL), this difference was
not significant. Similarly, other studies showed that women had significantly higher serum copper
levels (p < 0.05) than men [52]. Although mean serum copper was higher in children (125 µg/dL)
than adults (114 µg/dL) and adolescents (96 µg/dL), these differences were not significant. However,
it was observed that the serum copper decreased slightly with increasing age (Figure 2) in a similar way
to those reported by Lin et al. [47]. Moreover, although Best et al. found a moderate copper deficiency
in CF patients [48], in this group of patients, there was only one 15-year-old male teenager (6%)
with hypocupremia (69 µg/dL). This result contrasts with 44% of CF children with copper deficiency
reported by Yadav et al. in twenty-seven north Indian children with CF [45]. According to Cordano,
a serum copper concentration ofNutrients 2020, 12, 3344 10 of 16
a higher level of serum copper could be associated with the risk of obesity in children and adults [54].
Furthermore, in this series, linear regression analysis showed that there was a direct association
between serum copper levels and BMI (R2 = 0.236, p = 0.048). This result is not surprising because,
in a large-scale sample of 2233 15–65-year-old subjects, a strong positive correlation was found between
serum copper and BMI (R = 0.85, p < 0.001) [55].
CF-related bone disease has increased with life expectancy [5,10,11]. Copper is a micronutrient
present in almost every cell in the human body. Approximately 50% of the copper content is stored in
bones and muscles (approximately 25% in skeletal muscle), 15% in the skin and bone marrow, 8 to 15%
in the liver, and 8% in the brain [56]. In addition, it plays an important role in the synthesis of collagen
in the bones and connective tissue [57]. According to Turk, a bone mineral density examination in CF
patients should be performed at the age of 8–10 y [5]. Surprisingly, the BCS (0.3 ± 0.9) Z-score was
normal and no patient with CF had a low BCS. That is, bone densitometry measured using ultrasound
was normal and no patient with CF was at risk of osteoporosis [33]. However, linear regression
analysis showed that BCS had a positive correlation with serum copper. In contrast, Chase et al.
showed that 44% of children with CF, particularly adolescent girls, have bone demineralization [58].
Among the main risk factors for bone loss in CF are poor nutritional status, vitamin D and K deficiencies,
calcium, hypogonadism, glucocorticoid use, physical inactivity, CFTR dysfunction, and exacerbations of
lung infections. To a lesser extent, deficiencies of copper, phosphorus, magnesium, zinc, essential fatty
acids and proteins, and an excess of vitamin A may have etiological roles [59].
The mean EE was adequate according to WHO’s recommendation (p = 0.074). The mean diet was
high in protein with adequate carbs, fiber, and EI. The diet was adequate except for the low iodine
intake. Serum copper did not correlate with zinc, calcium, magnesium, and iron intakes. Nevertheless,
CF patients with RI had more zinc intake (112.5% DRI) than RS (81.5% DRI, p = 0.015). Surprisingly,
only vitamin C intake had a negative association with serum copper, and all three CF patients with
hypo- and hypercupremia had low vitamin C intake (χ2 = 0.046). Various dietary factors, such as
carbohydrates, iron, zinc, certain amino acids and proteins, molybdenum, and vitamin C, can have
adverse effects on the bioavailability of ingested copper [27]. In experimental animals, supplementation
with vitamin C can induce a copper deficiency, but it is not clear whether this also occurs in humans [60].
Nevertheless, two studies in healthy men showed that the activity of ceruloplasmin oxidase may be
impaired by relatively high doses of supplementary vitamin C [61]. Likewise, vitamin C inhibits
copper absorption, binds or chelates copper, and facilitates its removal [62].
The usual pathophysiological features of copper deficiency include anemia, leukopenia,
and neutropenia [20]. Copper plays a role in the production of hemoglobin, myelin, melanin, and the normal
functioning of the thyroid gland [63]. Furthermore, despite normal serum iron levels, copper deficiency
affects the production of hemoglobin because copper is required for the use of iron in bone marrow [64].
In this series, it was found that the 6-year-old girl with RI, PS, and mesenteric adenopathy and was colonized
by Pseudomonas aeruginosa had hypercupremia, iron deficiency, and slightly high CRP; the 9-year-old girl with
RS and PI and was colonized by Hemophilus influenzae had hypercupremia; the 15-year-old male with PI and
RS and was colonized by Aspergillus fumigatus had hypocupremia, prealbumin deficiency, and lymphopenia
(1610 cell/mm3). Table 4 shows another 8-year-old boy with RI and SI and who was colonized by Candida sp.
Had a high serum copper level on the border of hypercupremia and iron deficiency. All of them had
a low percentage of lymphocytes T (CD3) and Th (CD4). In addition, although the mean complement
C3 (117 mg/dL, Figure 4), complement C4 (21 mg/dL, Figure 5), and lymphocytes NK CD16+56 (10.8%)
were normal, linear regression analysis showed that all of them had a positive association with serum copper.
The CRP and ESR levels were normal and no had association with serum copper. These results agreed with
the study of Dizdar et al. [36].
Copper may be important for immune system function, where its deficiency is frequently associated
with an increased risk of infection and disturbances in copper homeostasis alter immune system
function in rodents [25]. Copper may be necessary for the destruction of bacteria by macrophages
and copper deficiency can disrupt factors of the cellular and humoral immune system [65]. However,Nutrients 2020, 12, 3344 11 of 16
in this series, there were no significant differences in serum copper by bacterial colonization. In contrast,
according to Yadav (2014), serum copper was lower (57 µg/dL) in cases with exacerbation of the
disease compared to levels in stable cases (p = 0.03) [45]. Likewise, in this series, although 17.6% of the
patients were colonized by Pseudomonas aeruginosa and Candida spp., and 23.5% by Staphylococcus aureus,
their lung function was no worse than that of those without such colonization [30]. Songchitsomboon
et al. observed a significant increase in serum copper levels in patients with infectious diseases [66].
However, Lee et al. reported that serum copper levels increased significantly several months after
recovery from an acute pulmonary exacerbation in CF patients [67].
Table 4. Serum copper and iron levels, anemia biomarkers and number of lymphocytes (N = 17 *).
Age Serum Copper Serum Iron Hemoglobin Mean Corpuscular Volume Lymphocytes
Years µg/dL µg/dL g/L µg/m3 Cell/mm3
2 113 49 13.2 82 6580
4 90 79 13.8 82.6 3400
6 158 46 13.5 79.7 3830
8 139 25 15 80.8 3710
8 108 84 14.2 88.9 3440
9 145 108 14.4 85.7 2490
9 121 79 14.35 87.8 3146
13 121 47 14.8 80.5 1900
15 69 135 14.3 89.4 1610
15 100 69 15.1 88.5 3970
16 105 89 15.6 86.3 4120
18 85 69 11.7 92 2110
20 113 129 15.4 84.4 3200
23 125 141 17.8 96.2 2490
23 100 45 13.4 97.8 2270
25 139 92 14.4 101.2 2920
31 91 59 13.1 89.3 2300
* 17 cystic fibrosis patients were screened, included and analyzed.
Copper/Zinc Ratio
Copper and zinc deficiencies are common and underdiagnosed health risks [68]. Both micronutrients
are required for cellular metabolism and antioxidant defense systems [69]. Acute infections alter
metabolism, while deficiencies increase the risks of infection. While acute infections cause an increase
in serum copper in the context of an acute phase response [70], they cause a decrease in serum zinc
due to its redistribution in the liver and other tissues [68]. Physiological conditions, such as age
and sex, as well as malabsorption, inflammatory condition, and genetics, significantly influence the
concentrations of both trace elements [71]. In this series, the median serum zinc (86 µg/dL) was in the
normal range of 70 to 120 µg/dL [30]. Although 23% of patients had inadequate zinc intake and 17%
serum zinc deficiency, none of the patients with deficient intake had hypozincemia. This situation of
deficient zinc intake without hypozincemia alerts to a state of a marginal deficiency of around 41%.
In addition, serum zinc was associated with BMI and W/H Z-score and zinc intake was associated
with EI and weight-for-age Z-score [30]. Nevertheless, no patient with abnormal serum copper had
hypozincemia. Only the teenager with hypocupremia had high calcium and iron intake but low
magnesium and zinc intake. Although the serum copper and zinc levels did not correlate with each
other and there was no association of their serum levels with the age of the patients, linear regression
analysis showed that serum copper had a significant association with serum zinc when adjusted
according to age (Figure 3).
One of the most common trace metal imbalances is elevated copper and depressed zinc [71,72].
The optimal plasma or serum ratio between these two elements is 0.70–1.00 [37], and the normal
Cu/Zn ratio in children and adults is close to 1:1 [71,72]. In this series, the mean Cu/Zn ratio was high
(1.32) with a range from 0.73 to 2.00, and 94% of CF patients had a Cu/Zn ratio > 1.00. The highest
Cu/Zn ratio of 2.00 was in the 6-year-old girl with hypercupremia (158 µg/dL) and normal serum zincNutrients 2020, 12, 3344 12 of 16
(80 µg/dL). A pattern of high copper and low zinc is characteristic of an inflammatory condition [50],
and a Cu/Zn ratio greater than 2 means there is a severe bacterial infection [73]. This situation might
indicate that an inflammatory status was prevalent in most CF patients in this series. Conversely,
the mean Zn/Cu was 0.75 ± 1.9 and ranged from 0.5 to 1.38. A tissue Zn/Cu ratio < 4 is often associated
with increased susceptibility to bacterial and viral infections [62]. In addition, the Cu/Zn ratio had
a direct and significant correlation with protein, monosaturated lipids, and niacin intake, as well as
triglycerides and gamma-glutamyl transpeptidase, and a negative association with polyunsaturated
lipids intake and monocytes. In contrast, the Zn/Cu ratio presented almost the same associations but
in an inverse relationship as the Cu/Zn ratio.
According to Osredkar et al., the Cu/Zn ratio is clinically more important than the concentration of
either trace metal [63]. It has been reported that the Cu/Zn ratio is a good indicator of various diseases [74]
and was proved to be a better predictor of disease severity and/or mortality than copper levels [75].
When high levels of copper and low levels of zinc coexist, they can contribute to diseases such as
schizophrenia, hypertension, autism, fatigue, muscle and joint pain, headaches, infantile hyperactivity,
depression, insomnia, senility, and premenstrual syndrome [71]. The Cu/Zn ratio has also been related
to childhood neurological disorders [72] and assaultive individuals [76]. Additionally, the Cu/Zn
ratio is an indicator of the nutritional status of zinc in patients [73]. Zinc deficiency should be highly
suspected in individuals with high serum Cu/Zn ratios. Previous studies revealed the validity of the
Cu/Zn ratio for the severity of nutritional status, inflammation, oxidative stress, immune dysfunction,
and infection associated with zinc deficiency [77]. This fact agrees with the results published previously,
where 41% of the cases would have an elevated risk of zinc deficiency [30].
At this point, we need to consider four highlights. First, the median serum copper was normal
(113 µg/dL) and the prevalence of abnormal serum copper levels was low (6% of CF patients had
hypocupremia and 12% had hypercupremia). Second, this study demonstrated that the serum copper
level had a significant association with several of the nutritional parameters studied (body mass index
and bone conduction speed, vitamin C intake, serum zinc, complements C3 and C4, and lymphocytes
NK CD16+56). Third, the mean Cu/Zn ratio was high (1.32) and 94% of CF patients in this series had
a high Cu/Zn ratio > 1.00, and only one patient had a high Cu/Zn ratio of 2. These correspond with
a high inflammatory response and severe bacterial infection, respectively. Finally, there was a high
risk of marginal zinc deficiency (41%), and although no patient with abnormal serum copper had
hypozincemia, serum copper significantly correlated with serum zinc. Considering all the highlights,
we should indicate that although the assessed biomarkers of inflammation (ESR and CRP) were normal,
the high Cu/Zn ratio should alert us to a condition with a high inflammatory response and could reflect
the severity of zinc deficiency.
The results respond to the main objective of this study and indicate the need to continue studying
the relationship between the nutritional status of patients with CF and abnormal copper status
in order to understand the essential balance between the copper and zinc statuses. A limitation of this
study is the small number of participants, while its strengths lie in the determination of serum copper
levels, the Cu/Zn ratio, and its relationship with anthropometric, biochemical, and dietary indicators.
We suggest the implementation of multicenter trials to improve the knowledge of copper status in
these patients and to determine the necessary and appropriate amount of copper supplementation to
improve the nutritional status of cystic fibrosis patients when necessary.
5. Conclusions
The mean serum copper was normal and had a direct association with the nutritional status, expressed
as body mass index, bone conduction speed, serum zinc, complements C3 and C4, and lymphocytes
NK CD 16+56, and a negative association with vitamin C intake. No patients with hypocupremia
(6%) and hypercupremia (12%) had hypozincemia. The mean Cu/Zn ratio was high, and 94% of CF
patients had a high Cu/Zn ratio. This situation must alert us to the risk of zinc deficiency and a high
inflammatory response.Nutrients 2020, 12, 3344 13 of 16
Author Contributions: M.F.E.-M., conceptualization, methodology, software, validation, formal analysis,
investigation, data curation, writing original draft, visualization, writing—review and editing, and project
administration; E.B., formal analysis, investigation, and resources; C.A.V., validation, resources, and project
administration; M.A.E.-M., software, data curation, and visualization; M.C.T.-H., visualization and funding
acquisition; J.M.M.-M., validation, supervision, formal analysis, data curation, and writing—review and editing;
M.P.R.d.R., validation, resources, and project administration. All authors have read and approved the submitted
version of this manuscript.
Funding: This research received no external funding.
Acknowledgments: We are grateful to the staff of the Pediatric Service of the University Clinical Hospital and the
Laboratory of Instrumental Techniques of the Chemistry Department of the Valladolid University. I would like
to especially thank María Carmen Escobedo Monge, Joaquin Parodi Roman, and José Escobedo Monje for their
technical support in the preparation and presentation of this article.
Conflicts of Interest: The authors declare no conflict of interest.
References
1. De Boeck, K. Cystic fibrosis in the year 2020: A disease with a new face. Acta Paediatr. 2020, 109, 893–899. [CrossRef]
2. Boëlle, P.Y.; Debray, D.; Guillot, L.; Clement, A.; Corvol, H.; French, C.F. Modifier Gene Study Investigators.
Cystic Fibrosis Liver Disease: Outcomes and Risk Factors in a Large Cohort of French Patients. Hepatology
2019, 69, 1648–1656. [CrossRef]
3. Athanazio, R.A.; Filho, L.V.R.F.S.; Vergara, A.A.; Ribeiro, A.F.; Riedi, C.A.; Procianoy, E.D.F.A.; Adde, F.V.;
Reis, F.J.C.; Ribeiro, J.D.; Torres, L.A.; et al. Grupo de Trabalho das Diretrizes Brasileiras de Diagnóstico
e Tratamento da Fibrose Cística. Brazilian guidelines for the diagnosis and treatment of cystic fibrosis.
J. Bras. Pneumol. 2017, 43, 219–245. [CrossRef]
4. Chakrabarty, B.; Kabra, S.K.; Gulati, S.; Toteja, G.S.; Lodha, R.; Kabra, M.; Pandey, R.M.; Srivastava, A.
Peripheral neuropathy in cystic fibrosis: A prevalence study. J. Cyst. Fibros. 2013, 12, 754–760. [CrossRef]
5. Turck, D.; Braegger, C.P.; Colombo, C.; Declercq, D.; Morton, A.; Pancheva, R.; Robberecht, E.; Stern, M.;
Strandvik, B.; Wolfe, S.; et al. ESPEN-ESPGHAN-ECFS guidelines on nutrition care for infants, children, and adults
with cystic fibrosis. Clin. Nutr. 2016, 35, 557–577. [CrossRef] [PubMed]
6. Gray, R.D.; Duncan, A.; Noble, D.; Imrie, M.; O’Reilly, D.S.; Innes, A.; Porteous, D.; Greening, A.P.;
Boyd, A.C. Sputum trace metals are biomarkers of inflammatory and suppurative lung disease. Chest 2010,
137, 635–641. [CrossRef]
7. Stoltz, D.A.; Meyerholz, D.K.; Welsh, M.J. Origins of cystic fibrosis lung disease. N. Engl. J. Med. 2015,
372, 351–362. [CrossRef] [PubMed]
8. Wilschanski, M.; Novak, I. The cystic fibrosis of exocrine pancreas. Cold Spring Harb. Perspect Med. 2013,
3, a009746. [CrossRef] [PubMed]
9. Declercq, D.; Van Meerhaeghe, S.; Marchand, S.; Van Braeckel, E.; Van Daele, S.; De Baets, F.; Van Biervliet, S.
The nutritional status in CF: Being certain about the uncertainties. Clin. Nutr. 2019, 29, 15–21. [CrossRef]
10. Moheet, A.; Moran, A. CF-related diabetes: Containing the metabolic miscreant of cystic fibrosis.
Pediatr. Pulmonol. 2017, 52, S37–S43. [CrossRef]
11. Berg, K.H.; Ryom, L.; Faurholt-Jepsen, D.; Pressler, T.; Katzenstein, T.L. Prevalence and characteristics of chronic
kidney disease among Danish adults with cystic fibrosis. J. Cyst. Fibros. 2017, 17, 478–483. [CrossRef] [PubMed]
12. Li, L.; Somerset, S. Digestive system dysfunction in cystic fibrosis: Challenges for nutrition therapy.
Dig. Liver. Dis. 2014, 46, 865–874. [CrossRef] [PubMed]
13. Siwamogsatham, O.; Dong, W.; Binongo, J.N.; Chowdhury, R.; Alvarez, J.A.; Feinman, S.J.; Enders, J.;
Tangpricha, V. Relationship between fat-soluble vitamin supplementation and blood concentrations in
adolescent and adult patients with cystic fibrosis. Nutr. Clin. Pract. 2014, 29, 491–497. [CrossRef] [PubMed]
14. Oliver, A.; Alarcon, T.; Caballero, E.; Cantón, R. Microbiological diagnosis of bronchopulmonary
colonization-infection in cystic fibrosis. Enferm. Infect. Microbiol. Clin. 2009, 27, 89–104. [CrossRef]
15. Damphousse, V.; Mailhot, M.; Berthiaume, Y.; Rabasa-Lhoret, R.; Mailhot, G. Plasma zinc in adults with
cystic fibrosis: Correlations with clinical outcomes. J. Trace Elem. Med. Biol. 2014, 28, 60–64. [CrossRef]
16. Grubman, A.; White, A.R. Copper and Molecular Aspects of Cell Signaling. In Molecular, Genetic, and Nutritional
Aspects of Major and Trace Minerals; Collins, J.F., Ed.; Molecular Nutrition; Elsevier: London, UK, 2016;
pp. 85–99. [CrossRef]Nutrients 2020, 12, 3344 14 of 16
17. Myint, Z.W.; Oo, T.H.; Thein, K.Z.; Tun, A.M.; Saeed, H. Copper deficiency anemia: Review article. Ann. Hematol.
2018, 97, 1527–1534. [CrossRef]
18. Livingstone, C. Review of Copper Provision in the Parenteral Nutrition of Adults [Formula: See text]. Nutr. Clin. Pract.
2017, 32, 153–165. [CrossRef]
19. Domellöf, M.; Szitanyi, P.; Simchowitz, V.; Franz, A.; Mimouni, F.; ESPGHAN/ESPEN/ESPR/CSPEN working
group on pediatric parenteral nutrition. ESPGHAN/ESPEN/ESPR/CSPEN guidelines on pediatric parenteral
nutrition: Iron and trace minerals. Clin. Nutr. 2018, 37 Pt. B, 2354–2359. [CrossRef]
20. Danks, D.M. Copper deficiency in humans. Annu. Rev. Nutr. 1988, 8, 235–257. [CrossRef]
21. Uauy, R.; Olivares, M.; Gonzalez, M. Essentiality of copper in humans. Am. J. Clin. Nutr. 1998, 67, 952S–959S. [CrossRef]
22. Halfdanarson, T.R.; Kumar, N.; Hogan, W.J.; Murray, J.A. Copper deficiency in celiac disease. J. Clin. Gastroenterol.
2009, 43, 162–164. [CrossRef] [PubMed]
23. Kumar, N. Nutrients and Neurology. Continuum (Minneap Minn). Neurol. Syst. Dis. 2017, 23, 822–861. [CrossRef]
24. Wazir, S.M.; Ghobrial, I. Copper deficiency, a new triad: Anemia, leucopenia, and myeloneuropathy.
J. Community Hosp. Intern. Med. Perspect. 2017, 7, 265–268. [CrossRef] [PubMed]
25. Prohaska, J.R. Copper. In Present Knowledge in Nutrition, 9th ed.; Bowman, B.A., Russell, R.M., Eds.; ILSI Press:
Washington, DC, USA, 2006; pp. 458–470.
26. Emsley, J. Nature’s Building Blocks: An A-Z Guide to the Elements; Oxford University Press: Oxford, UK, 2003.
27. Lonnerdal, B. Copper nutrition during infancy and childhood. Am. J. Clin. Nutr. 1998, 67, 1046S–1053S.
[CrossRef] [PubMed]
28. Institute of Medicine (US) Panel on Micronutrients. Dietary Reference Intakes for Vitamin A, Vitamin K, Arsenic, Boron,
Chromium, Copper, Iodine, Iron, Manganese, Molybdenum, Nickel, Silicon, Vanadium, and Zinc; National Academies Press
(US): Washington, DC, USA, 2001; Volume 7. Available online: https://www.ncbi.nlm.nih.gov/books/NBK222312/
(accessed on 25 July 2020).
29. Kerem, E.; Viviani, L.; Zolin, A.; MacNeill, S.; Hatziagorou, E.; Ellemunter, H.; Drevinek, P.; Gulmans, V.;
Krivec, U.; Olesen, H. ECFS Patient Registry Steering Group. Factors associated with FEV1 decline in cystic
fibrosis: Analysis of the ECFS patient registry. Eur. Respir. J. 2014, 43, 125–133. [CrossRef] [PubMed]
30. Monge, M.F.E.; Barrado, E.; Vicente, C.A.; del Río, M.P.R.; de Miguelsanz, J.M.M. Zinc Nutritional Status in
Patients with Cystic Fibrosis. Nutrients 2019, 11, 150. [CrossRef] [PubMed]
31. Frisancho, A.R. New norms of upper limb fat and muscle areas for assessment of nutritional status. Am. J.
Clin. Nutr. 1981, 34, 2540–2545. [CrossRef]
32. Hernández, M.; Sobradillo, B.; Aguirre, A.; Aresti, U.; Bilbao, A.; Fernández-Ramos, C.; Lizárraga, A.;
Lorenzo, H.; Madariaga, L.; Rica, I. Curvas y Tablas de Crecimiento (Estudios Longitudinal y Transversal);
Fundación Faustino Orbegozo: Bilbao, Spain, 1985.
33. Martínez, M.J.; Redondo, D.; Conde, F.; Redondo, P.; Franch, M.A. Gráficas Longitudinales de Velocidad de
Conducción Media de Ultrasonidos en Falanges. Estudio Nutricional de Castilla y León; de CyL, J., Ed.; Junta Castilla
y León: Valladolid, Spain, 2009.
34. Escobedo, M.F.; Barrado, E.; Alonso, C.; de Miguelsanz, J.M.M. Comparison study between colorimetric
method and flame atomic absorption spectrophotometry in serum zinc status. Nutr. Clin. Diet Hosp. 2018,
38, 128–133. [CrossRef]
35. Shenkin, A. Vitamins and trace elements. In Textbook of Clinical Chemistry and Molecular Diagnosis, 4th ed.;
Bertis, S.A., Ashvud, E.R., Bruns, D., Eds.; Saunders Elsevier: Philadelphia, PA, USA, 2006.
36. Dizdar, O.S.; Baspınar, O.; Kocer, D.; Dursun, Z.B.; Avcı, D.; Karakükcü, C.; Çelik, İ.; Gundogan, K.
Nutritional Risk, Micronutrient Status and Clinical Outcomes: A Prospective Observational Study in
an Infectious Disease Clinic. Nutrients 2016, 8, 124. [CrossRef]
37. Kaslow, J.E. Copper/Zinc Imbalance. Medical Board of California. Available online: http://www.mbc.ca.gov
(accessed on 15 August 2020).
38. Verdú, J.M.; Diaz, J.G. Nutriber. V. 1.0; Fundación Universitaria Iberoamericana: Barcelona, Spain, 2005.
39. Boat, T.F.; Acton, J.D. Cystic fibrosis. In Nelson Textbook of Pediatrics, 18th ed.; Kliegman, R.M., Jenson, H.B.,
Behrman, R.E., Stanton, B.F., Eds.; Saunders Elsevier: Philadelphia, PA, USA, 2008; Volume 2.
40. Tangpricha, V.; Kelly, A.; Stephenson, A.; Maguiness, K.; Enders, J.; Robinson, K.A.; Marshall, B.C.;
Borowitz, D. Cystic Fibrosis Foundation Vitamin D Evidence-Based Review Committee. An update on the
screening, diagnosis, management, and treatment of vitamin D deficiency in individuals with cystic fibrosis:Nutrients 2020, 12, 3344 15 of 16
Evidence-based recommendations from the Cystic Fibrosis Foundation. J. Clin. Endocrinol. Metab. 2012, 97,
1082–1093. [CrossRef] [PubMed]
41. Dieppois, G.; Ducret, V.; Caille, O.; Perron, K. The transcriptional regulator CzcR modulates antibiotic
resistance and quorum sensing in Pseudomonas aeruginosa. PLoS ONE 2012, 7, e38148. [CrossRef] [PubMed]
42. Groff, J.L.; Gropper, S.S.; Hunt, S.M. Advanced Nutrition and Human Metabolism; West Publishing Company:
New York, NY, USA, 1995.
43. Copper in Diet. Available online: http://www.nlm.nih.gov/medlineplus/ency/article/002419.htm (accessed on
27 July 2020).
44. Harless, W.; Crowell, E.; Abraham, J. Anemia and neutropenia associated with copper deficiency of unclear
etiology. Am. J. Hematol. 2006, 81, 546–549. [CrossRef] [PubMed]
45. Yadav, K.; Singh, M.; Angurana, S.K.; Attri, S.V.; Sharma, G.; Tageja, M.; Bhalla, A.K. Evaluation of
micronutrient profile of North Indian children with cystic fibrosis: A case–control study. Pediatr. Res. 2014,
75, 762–766. [CrossRef] [PubMed]
46. Rükgauer, M.; Klein, J.; Kruse-Jarres, J.D. Reference values for the trace elements copper, manganese,
selenium, and zinc in the serum/plasma of children, adolescents, and adults. J. Trace Elem. Med. Biol. 1997,
11, 92–98. [CrossRef]
47. Bonham, M.; Jacqueline, M.; Bernadette, M.H.; Strain, J.J. The immune system as a physiological indicator of
marginal copper status? Br. J. Nutr. 2002, 87, 393–403. [CrossRef]
48. Percival, S.S.; Bower, E.; Wagner, M. Reduced copper enzyme activities in blood cells of children with cystic
fibrosis. Am. J. Clin. Nutr. 1995, 62, 633–638. [CrossRef]
49. Lin, C.-N.; Wilson, A.; Church, B.B.; Ehman, S.; Roberts, W.L.; McMillin, G.A. Pediatric reference intervals for
serum copper and zinc. Clin. Chim. Acta 2012, 413, 612–615. [CrossRef]
50. Best, K.; McCoy, K.; Gemma, S.; Di Silvestro, R.A. Copper enzyme activities in cystic fibrosis before and after
copper supplementation plus or minus zinc. Metabolism 2004, 53, 37–41. [CrossRef]
51. Milne, D.B.; Johnson, P.E. Assessment of copper status: Effect of age and gender on reference ranges in
healthy adults. Clin. Chern. 1993, 39, 883–887. [CrossRef]
52. Romero, C.D.; Sánchez, P.H.; Blanco, F.L.; Rodríguez, E.R.; Majem, L.S. Serum copper and zinc concentrations
in a representative sample of the Canarian population. J. Trace Elem. Med. Biol. 2002, 16, 75–81. [CrossRef]
53. Cordano, A. Clinical manifestations of nutritional copper deficiency in infants and children. Am. J. Clin. Nutr.
1998, 67, 1012S–1016S. [CrossRef]
54. Gu, K.; Li, X.; Xiang, W.; Jiang, X. The Relationship between Serum Copper and Overweight/Obesity:
A Meta-analysis. Biol. Trace Elem. Res. 2020, 194, 336–347. [CrossRef]
55. Ghayour-Mobarhan, M.; Shapouri-Moghaddam, A.; Azimi-Nezhad, M.; Esmaeili, H.; Parizadeh, S.M.;
Safarian, M.; Kazemi-Bajestani, S.M.; Khodaei, G.H.; Hosseini, S.J.; Parizadeh, S.M.; et al. The relationship
between established coronary risk factors and serum copper and zinc concentrations in a large Persian cohort.
J. Trace Elem. Med. Biol. 2009, 23, 167–175. [CrossRef]
56. Gibson, R.S. Principles of Nutritional Assessment, 2nd ed.; Oxford University: New York, NY, USA, 2005;
pp. 697–711.
57. Angelova, M.; Asenova, S.; Nedkova, V.; Koleva-Kolarova, R. Copper in the Human organism. Trakia J. Sci.
2011, 9, 88–98.
58. Chase, H.P.; Long, M.A.; Lavin, M.H. Cystic fibrosis and malnutrition. J. Pediatr. 1979, 95, 337–347. [CrossRef]
59. Aris, R.M.; Merkel, P.A.; Bachrach, L.K.; Borowitz, D.S.; Boyle, M.P.; Elkin, S.L.; Guise, T.A.; Hardin, D.S.;
Haworth, C.S.; Holick, M.F.; et al. Guide to bone health and disease in cystic fibrosis. J. Clin. Endocrinol. Metab.
2005, 90, 1888–1896. [CrossRef] [PubMed]
60. Powers, H.J.; Loban, A.; Silvers, K.; Gibson, A.T. Vitamin C at concentrations observed in premature babies
inhibits the ferroxidase activity of caeruloplasmin. Free Radic. Res. 1995, 22, 57–65. [CrossRef] [PubMed]
61. Turnlund, J.R.; Keyes, W.R.; Kim, S.K.; Domek, J.M. Long-term high copper intake: Effects on copper
absorption, retention, and homeostasis in men. Am. J. Clin. Nutr. 2005, 81, 822–828. [CrossRef]
62. Eck, P.; Wilson, L. Toxic Metals in Human Health and Disease; Eck Institute of Applied Nutrition and
Bioenergetics, Ltd.: Phoenix, AZ, USA, 1989.
63. Osredkar, J.; Susta, N. Copper and Zinc, Biological Role and Significance of Copper/Zinc Imbalance.
J. Clin. Toxicol. 2011, 2161, 0495. [CrossRef]You can also read