CSR Disclosure: The IPO Case - Article - MDPI
←
→
Page content transcription
If your browser does not render page correctly, please read the page content below
sustainability

Article
CSR Disclosure: The IPO Case
Mar Arenas-Parra 1, *          and Susana Álvarez-Otero 2
 1    Department of Quantitative Economics, Faculty of Economics and Business, University of Oviedo,
      33003 Oviedo, Spain
 2    Department of Business Administration, Faculty of Economics and Business, University of Oviedo,
      33003 Oviedo, Spain; saotero@uniovi.es
 *    Correspondence: mariamar@uniovi.es

 Received: 2 May 2020; Accepted: 25 May 2020; Published: 27 May 2020

 Abstract: Corporate social responsibility (CSR) is one of the pillars of sustainable development. It is
 the key to operationalizing the strategic role of business in contributing towards the sustainability
 process. The fact that firms communicate their activities about economic sustainability, environmental
 sustainability, and social equity shows their commitment to society and their stakeholders. This paper
 analyzes the influence exerted by the composition of boards of directors on corporate social
 responsibility disclosure with reference to those companies that undertook an initial public offerings
 (IPO) in the Spanish capital market during the period 1998–2013. The empirical evidence provided by
 this study shows that ownership structure and board characteristics are relevant in the context of a
 firm’s CSR disclosure. The independent directors, non-executive directors, and large shareholder
 representatives affect the way in which their companies voluntarily disclose information regarding
 CSR. Our results lend support for a non-linear relationship between the proportion of shares in the
 IPO belonging to the members of the board of directors and the level of CSR reporting. We also
 find that the underwriter’s reputation has a positive and statistically significant influence on CSR
 disclosure for Spanish IPOs.

 Keywords: CSR disclosure; sustainable development; corporate governance; board of directors;
 institutional ownership; IPOs (initial public offerings)

1. Introduction
     Corporate social responsibility (henceforth CSR) has been the subject of numerous studies on a
worldwide scale. Research in this field has mainly focused on the determinants of CSR, as well as on
examining the effects of various aspects of corporate financial performance. The latter indicates that
corporations tend to act in socially responsible ways if normative or cultural institutions are in place,
thus creating the proper incentives to act responsibly.
     CSR is one of the pillars of sustainable development. The 2030 Agenda for Sustainable
Development, adopted by all United Nations Member States in 2015, recognizes the close relationship
between CSR and the achievement of the Sustainable Development Goals. It is the key to
operationalizing the strategic role of business in contributing towards the sustainability process.
     There are several models that try to describe the concept of CSR and the processes involved in
the adoption of CSR practices in firms. In general, CSR means that companies identify with their
stakeholder groups and incorporate their needs into the daily decision-making process. The World
Business Council for Sustainable Development defines corporate social responsibility as “the continuing
commitment by business to behave ethically and contribute to economic development while improving
the quality of life of the work force and their families as well as a local community and society at
large” [1]. CSR is based on the belief that “the social responsibility of business encompasses the
economic, legal, ethical, and discretionary expectations that society has of organizations at a given

Sustainability 2020, 12, 4390; doi:10.3390/su12114390                      www.mdpi.com/journal/sustainability
Sustainability 2020, 12, 4390 2 of 22
point in time” [2]. Considering the evolution of CSR, the model developed by Niskala and Tarna [3]
is perhaps the one that describes CSR most accurately. It is a multidimensional model for viewing
CSR through three different perspectives: Economic sustainability, environmental sustainability, and
social equity. In other words, the companies need to focus on economic, environmental, and social
issues in a balanced and symbiotic manner when conducting business. Therefore, the fact that firms
communicate their activities about these issues shows their commitment to stakeholders [4].
A CSR report includes the economic, environmental, and social impacts generated by a company’s
everyday activities, and demonstrates the link between its strategy and its commitment to a sustainable
global economy. The report, therefore, helps companies to set goals and manage change in order to
make their operations more sustainable. Since the decision to disclose financial and non-financial
information depends on those who make decisions in companies, the ownership structure and the
board composition must obviously play an important role in the decision to disclose CSR reports.
The present study endeavors to meet two objectives. First, the aim is to analyze how the ownership
structure and the board composition influence CSR disclosure for those companies that made an
initial public offering (henceforth IPO) in the Spanish capital market during the period 1998–2013.
This represents an important distinction in relation to previous Spanish studies (see [5–9], among
others). The key contribution of our paper to existing knowledge is that we study IPO firms. These
companies have the particularity of presenting a higher degree of information asymmetry because they
have never been quoted, so the value of information with respect to CSR disclosure is higher. With this
research, we can determine the influence of that information in the valuation of the companies in the
crucial moment that is the time of going public.
After controlling for other influences, such as the auditor’s reputation or the underwriter’s
reputation, we wish to investigate the possibility of a non-linear relationship between the proportion
of shares in the IPO belonging to members of the board of directors and the level of CSR reporting.
Secondly, we aim to complete a more in-depth analysis with respect to the composition of the board,
given that we have more data concerning the specific characteristics of IPO directors. Basing ourselves
on the latter characteristics enables us to check whether the type of director is also relevant for CSR
disclosure. Additionally, we wish to determine whether independent directors, non-executive directors,
women, large shareholders, the size of the board, and CEO duality may affect the way in which
companies disclose information regarding CSR.
Companies in Europe rely more on internal rather than external corporate governance mechanisms
in relation to their Anglo-American counterparts, and, as such, we research whether this could influence
CSR disclosure. Hence, the influence on IPO valuation and CSR exerted by the boards of directors in
companies located in continental European countries such as Spain merits further attention.
This research is organized in the following way. In the second section, we present a literature
review, while we postulate the hypotheses of our study in the third section. The descriptions of our
database, the research methodology, and our model are presented in the fourth section. The fifth
section is dedicated to the results of our estimations, while the conclusions are summarized in the
final section.
2. Literature Review
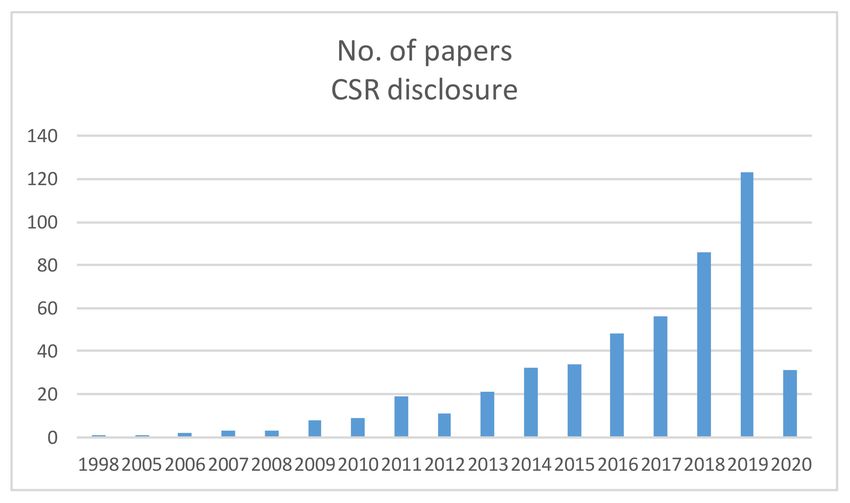
The literature on CSR disclosure is extensive. The number of papers published on this subject
begins to be considerable from 2011 onwards (see Figure 1). Researchers have explored the effects of
different issues on CSR disclosure, such as corporate governance, board composition, institutional
ownership, information asymmetry, or the types of firms. Moreover, the first contributions that studied
these relationships were published no more than 10 years ago (see Figure 2).Sustainability 2020, 12, 4390 3 of 22
Figure 1. Published papers on corporate social responsibility (CSR) disclosure by year of publication
(source: Scopus).
Figure 2. Published papers on the effect of corporate governance, board composition, institutional
ownership, information asymmetry, or the types of firms on the CSR disclosure by year of publication.
(source: Scopus).
Table 1 presents some of these contributions in detail, reporting a brief summary of their main
characteristics (country, period of study, and main variables considered). The results of these studies
are presented in this section.
Table 1. Literature Review: The impact of corporate governance, board composition, institutional
ownership, information asymmetry, and the types of firms on CSR disclosure.
Paper Country Period of Study Main Variables Main Result
G: Economic Economic results affect
Balabanis et al. [10] Great Britain 1988–1989
performance CSR
Higher levels of corporate
G: Legal system, social responsibility
Barakat et al. [11] Palestine/Jordan 2011
auditor disclosure (CSRD) in
Jordan
Bassam and Said CG: Board size,
Jordan 2013–2015 Board size affects CSR
[4] diversity
CG: Diversity on CSR positive impacts
Bear et al. [12] United States 2009
board reputation
Cabeza-García et al. CG: Diversity on More women, better CSR
Spain 2009–2013
[9] board disclosureSustainability 2020, 12, 4390 4 of 22
Table 1. Cont.
Paper Country Period of Study Main Variables Main Result
CG: Type of OC in No relation between CSR
Cea-Moure [13] EU-15 2007
banks and OC type
G: Scores A to C in
Coulmont et al. High individualism, lower
40 countries 2012 Global Reporting
[14] A score
Initiative (GRI)
CG: Board of Diversity of board impacts
Cucari et al. [15] Italy 2011–2014
directors CSR
Dienes and Velte CG: Board Gender diversity impacts
Germany 2011
[16] composition CSR
El-Bassiouny and CG: Diversity on Diversity in CG affects
Egypt, USA, Germ. 2014–2015
El-Bassiouny [17] board CSR
Fallah and CG: Ownership
Tehran 2014–2015 OC positively affects CSR
Mojarrad [18] Concentration
Fernández-Gago CG: Board Positive influence of
Spain 2009–2014
et al. [8] composition independents
Gamerschlang et al. G: Determinants of Shareholder structures
Germany 2008
[19] CSR affect CSR
García-Meca and CG: Diversity on
9 countries 2004–2010 CSR affected by diversity
Palacio [20] board
Garde-Sánchez CG: Gender and No relation between CSR
International n.a.
et al. [21] profile and gender
Guerrero-Villegas IO: Research Influence on CSR
International 2003-17
et al. [22] meta-analysis disclosure
CG: Board gender Female members affect
Gulzar et al. [23] China 2008–2015
diversity CSR
Herrera-Madueño FS: Research many Influence of size on CSR
International 1976–2013
et al. [24] countries disclosure
Holder-Webb et al. G: Determinants of Type of industry affects
United States 2004
[25] CSR CSR
CG: Asymmetry Agency problems affect
Iadd et al. [26] Jordan 2012
information CSR
CG: Elements of No relation between
Khan [27] Bangladesh 2007–2008
Governance women and CSR
CG: Board Board independence
Khan et al. [28] Bangladesh 2005–2009
independence affects CSR
CG: Board Independent members
Kiliç et al. [29] Turkey 2008–2012
structure affect CSR
Miras-Rodríguez, CG: Mechanisms of
BRICS countries n.a. CG mechanisms affect CSR
M. et al. [30] CG
G: Return on
Nurdiono et al. [31] Indonesia 2014-16 Equity (ROE), debt, CSR affects stock returns
stock return
Ong and CG: Types of Type of directors affects
Australia 2012
Djajadikerta [32] directors CSR
CG: Board Board independence
Pham and Tran [33] 20 countries 2005–11
independence affects CSR
Pistoni and Songini G: Historical CSR is related to company
Western countries 2000–13
[34] Analysis GRI size
G: Determinants of Large firms have CSR
Reverte [5] Spain 2005–2006
CSR ratings
Safonchyk and G: Theoretical Better results in systematic
EU member states n.a.
Vitman [35] research CSRSustainability 2020, 12, 4390 5 of 22
Table 1. Cont.
Paper Country Period of Study Main Variables Main Result
CG: Board size, Government ownership
Sahid et al. [36] Malaysia 2006
ownership affects CSR
IO: Institutional Positive relation between
Saleh et al. [37] Malasya 2000–07
ownership IO and CSR
FS: Size of the
Venkataraman [38] USA 2000–01 No difference in CSR
company
CG: Board size, CEO duality affected by
Vintila [39] Romania 2010
leverage CG
CG: Board Board size/gender affects
Zaid et al. [40] Palestine 2013–16
diversity, size CSR
CG: Ownership Ownership structure
Zhou [41] China 2010–16
structure affects CSR
G: General issues; CG: Corporate governance; IO: Institutional ownership; FS: Family status; OC: Organizational
charts; n.a.: Not applicable.
Corporate governance is a key issue in a company and is influential for many aspects because it has
to do with the direction and control of the firms. Boards of directors are responsible for the governance
of their companies, and the CSR disclosure is affected by their decisions. The relation between corporate
governance and CSR disclosure has been studied in the literature. Fallah and Mojarrad [18] investigate
this relationship for quoted companies on the Tehran Stock Exchange. According to the results, the
composition of the audit committee, the board tenure, and the concentration of ownership have a
positive impact on CSR disclosure. In addition, for the Australian market, Ong and Djajadikerta [32]
find positive correlations between the extent of sustainability disclosures and the proportions of
independent directors and female directors on the board.
With an interesting approach, Zaid et al. [40] examine the relationships between corporate
governance and CSR disclosure. Their results reveal that the level of CSR reporting is positively
affected by board size and independence. Furthermore, CEO duality is negatively correlated with CSR
disclosures. Zhou [41] investigates the effects of corporate governance on the decision to voluntarily
disclose CSR reports and finds that ownership structure and board characteristics are related with
firms’ decisions to voluntarily disclose CSR reports.
More recently, Garde-Sánchez et al. [21] analyzed the corporate governance and CSR disclosure
for the Top 200 Universities in the Shanghai Ranking. Their results show that leadership team, the size
of governance board, committees in the board, and stakeholder participation affect the disclosure of
information on CSR. Others studies of corporate governance on CSR disclosure are present in many
countries, such as those of Sahid et al. [36] for Malaysia, Khan [27] and Khan et al. [28] for Bangladesh,
and Miras-Rodríguez et al. [30] for the BRICS countries (Brazil, Russia, India, China, and South Africa).
The board composition and the type of directors may also have an influence on CSR disclosure
according to the financial literature. Iadd et al. [26] examine the impact of board composition on CSR
disclosure for listed Jordanian firms, and their results are explained by the agency theory. In relation to
the board composition, the role of women in CSR disclosure has also been explored in the financial
literature. Bear et al. [12] find that CSR ratings had a positive impact on reputation and mediated the
relationship between the number of women on the board and corporate reputation.
García-Meca and Palacio [20] analyze the relationship between board composition and firm
reputation in Spain. Their findings evidence that, contrary to popular beliefs, directors with previous
experience as politicians are not negatively viewed by stakeholders. Fernández-Gago et al. [8] show
empirical evidence on how the background of independent directors helps to explain why companies
disclose information about CSR following the standards of the Global Reporting Initiative (GRI).
The results from a sample of Spanish listed companies confirmed that having independent directors
with political backgrounds and diverse educational backgrounds has a positive impact on CSR reporting
following the GRI guidelines. Finally, Cabeza-García et al. [9] find that a higher percentage of womenSustainability 2020, 12, 4390 6 of 22
in boardrooms and in groups of outside and independent directors implied a better CSR disclosure for
Spanish quoted companies.
Bassam and Said [4] investigate the influence of board composition and ownership structure on
CSR disclosure. They find that there is considerable room for improvement in CSR disclosure. Similarly,
Pham and Tran [33] analyze the effects of board model and board independence on CSR disclosure
of multinational corporations. Their evidence confirms that the board model exerts a significantly
positive effect on CSR disclosure. In the same line, we find other studies such as Cucari et al. [15] for
Italy, Dienes and Velte [16] for Germany, Gulzar et al. [23] for China, or Kiliç et al. [29] for Turkey.
The role of the institutional ownership on CSR disclosure has also been analyzed because the
participation of institutional investors in equity may have an influence in many companies’ decisions.
Saleh et al. [37] explore CSR disclosure and its relationship with institutional ownership in Malaysian
publicly listed companies. The results confirmed that there are positive relationships between both
variables. This suggests that Malaysian public quoted companies can attract and maintain their
institutional investors while they engage in social activities. In consequence, companies should be
encouraged to be involved in CSR activities. García-Torea et al. [7] analyze the influence of ownership
structure on the transparency of CSR reporting, and they find a different relationship between each
type of shareholder and the transparency of CSR information for a sample of Spanish listed companies.
The use of an institutional approach is the more modern way of trying to improve many key
issues in the company. In economic theory, institutional approaches involve principles that can be
effectively used for the development and improvement of many corporate decisions. Barakat et al. [11]
characterize CSR disclosure practices in Palestine and Jordan to determine the formal institutional
factors that influence CSR disclosure. They find that for all aspects, the level of CSR disclosure in
Jordan is higher than for Palestine, albeit low in both when compared with Western countries.
The level of information asymmetry also has a role on CSR disclosure. For the Spanish capital
market, Reverte [6] examines whether firms pertaining to the IBEX35 with less information asymmetry
and higher CSR disclosure ratings are better valued by the capital market. He finds positive evidence
for the period 2007–2011. On the other hand, Nurdiono et al. [31] analyze the effects of disclosed CSR
information on the market performance in Indonesia. They find that CSR affects the stock return, the
debt equity ratio, and the return on equity. A seminal paper in this sense is the one of Balabanis et al. [10]
for Britain. Their results support that economic performance (past, concurrent, and subsequent) is
related to both CSR performance and disclosure in British companies.
Finally, the types of firms could also have a role in CSR disclosure. Venkataraman [38] investigates
this issue for large US companies, and he finds no significant difference in the likelihood of sustainability
reporting between family and non-family firms of the Standard and Poors 500. However, there is a
relationship between that likelihood and certain firm-specific and industry characteristic variables.
For the Spanish capital market, Herrera-Madueño et al. [24] describe the evolution of research on
social responsibility for small and medium-sized enterprises during the period 1976–2013 based on
321 papers.
Apart from these issues, other papers have analyzed, in general, the determinants of voluntary
CSR disclosure, such as Reverte [5] for Spain, Holder-Webb et al. [25] for the United States, and
Gamerschlang et al. [19] for Germany. Coulmont et al. [14] explore the determinants and impacts of
sustainability disclosure together with its key tools and frameworks. The state of the art and the new
directions adopted by sustainability disclosure have been deeply analyzed by Pistoni and Songini [34].
On the other hand, Safonchyk and Vitman [35] analyze the experience resulting from EU Member
State regulations of corporate social responsibility policy, revealing the practices of respective EU
national governments in the field of CSR. The most significant results have been achieved by those EU
Member States that use the systemic approach to CSR development. El-Bassiouny and El-Bassiouny [17]
explore the effects of organizational-level factors, specifically diversity and corporate governance
structure, on the CSR reporting practices of companies operating in Egypt, Germany, and the USA. They
find that the influence of those factors on CSR is highly dependent on the institutional context. With aSustainability 2020, 12, 4390 7 of 22
different approach, Cea-Moure [13] explores whether there is some relationship between organizational
charts and CSR in banks. The analysis is based on contents disclosed in their CSR/sustainability reports.
He found no solid evidence to accept or reject a possible relationship between both variables.
This literature review provides a backdrop for the hypotheses developed in this paper, which are
in the next section.
3. Our Hypotheses for CSR Disclosure
In the literature, the most studied characteristics of boards of directors are independence, size,
activity, and directors´ participation in company ownership [42–47]. According to Spanish law, the
composition of the board of directors should be balanced and equilibrated [48]. The role of independent
directors is to ensure better monitoring so they can bring information about the IPO and the value
of the firm [49]. The independence of directors enhances information exchange, so this can affect
IPO performance [50]. One method for improving corporate governance is to pay attention to CSR.
Thus, IPO performance could be connected with CSR disclosure because it is part of the company’s
performance. Moreover, it is undeniable that a modern concept of company management must include
CSR activities.
The effect of a director’s gender is also considered in our research. The presence of women on
corporate boards (gender diversity) is important for most modern firms because they bring unique
experiences, working styles, and perspectives to the board [51,52]. Empirical studies demonstrate that
female directors are more interested in charitable and philanthropic activities, while men are driven
toward profitable activities [53,54]. In relation to the size of the board, large companies with large
boards may bring more information to the decisions, while on small boards, the decision-making is
easier [55–57]. In this context, there is a direct relationship between larger boards and the intellectual
capital [58]. Given that IPO valuation is based on informational differences, the level of asymmetric
information should affect CSR disclosure, and this asymmetry should be lower in a large board.
The duality of the CEO and chairman position occurs when the same person holds both positions in
a firm. In this situation, the effectiveness could be compromised [59]. The duality could negatively affect
the board’s governance role over corporate initiatives, including CSR initiatives and disclosures [4,60].
In addition, Vintila [39] reveals an important relationship between CEO duality and corporate
governance. Namely, CEO duality is negatively associated with a board’s independence and size.
Moreover, Guerrero-Villegas et al. [22] found that CEO duality had a negative relationship with CSR
disclosure, while the contrary occurs with board independence, board size, and women’s representation.
Their research revealed differences in the relationship between board attributes and CSR disclosure,
and these differences were conditioned by the institutional contexts.
According to the previous ideas, we postulate the Board Composition Hypothesis (H1) with six
sub-hypotheses related to different characteristics of the members of the board: Independence,
executives, women directors, large shareholder representatives, size of the board, and CEO
duality. Henceforth:
Hypothesis 1a (H1a). The proportion of non-executive directors has a negative effect on CSR disclosure.
Hypothesis 1b (H1b). Independence in the board of directors has a positive effect on CSR disclosure.
Hypothesis 1c (H1c). The number of women on the board of directors has a positive effect on CSR disclosure.
Hypothesis 1d (H1d). A positive relationship exists between large shareholder representatives on the board of
directors and CSR disclosure.
Hypothesis 1e (H1e). The size of the board of directors has a positive effect on CSR disclosure.Sustainability 2020, 12, 4390 8 of 22
Hypothesis 1f (H1f). A negative relationship exists between the duality of the CEO and chairman positions
and CSR disclosure.
As far as the ownership structure and the influence on CSR disclosure is concerned, we have
to consider the participation of directors in the ownership of the firm. In relation to this, the main
explanation is related to the alignment/entrenchment hypotheses [20,61,62]. However, in the literature,
there are mixed results. Due to the separation between ownership and control, conflicts of interest
may arise within the company. For low-level managerial ownership, there should be a convergence
of interests with those of other shareholders. However, above a given threshold, the managers may
be entrenched and make decisions at the expense of other shareholders. Therefore, we propose an
inverted U-shaped effect of director ownership on CSR disclosure.
On the other hand, the concentration of ownership has influence on CSR disclosure. Board
ownership concentration occurs when stock is concentrated in the hands of a few directors and their
close family members. Two contrary influences on CSR disclosure could be possible. The first way
indicates that they can behave in the interests of shareholders and other powerful stakeholders [63].
This suggests a positive relationship between board ownership concentration and CSR disclosure
level. In contrast, the second way and main opinion in the literature suggests a negative relationship
between board ownership concentration and the CSR disclosure level based on the agency theory [64].
Moreover, a director who owns corporate stock may acquire information through means other than the
annual report with different informal channels, and this reduces the need for formal CSR disclosure [65].
The empirical studies suggest a negative relationship between board ownership concentration and the
CSR disclosure level [66,67].
Based on these ideas, the following Ownership Structure Hypothesis (H2) is suggested with
two sub-hypotheses:
Hypothesis 2a (H2a). The proportion of shares belonging to members of the board of directors in the IPO has a
non-linear effect on CSR disclosure.
Hypothesis 2b (H2b). Board ownership concentration has a negative effect on CSR disclosure.
The reputation of external agents may reduce the ex-ante uncertainty about the firm, and this may
also affect the implications of the company with respect to its CSR strategy. The greater the prestige of
the agents, such as the auditor and underwriter, the greater the implication for the CSR surrounding
the offer. The financial literature has established that underwriters with greater reputations tend to
cooperate with reputable auditors, so both agents signal the quality of the firm going public [68,69]
and reduce ex-ante uncertainty about its value; this, in turn, affects CSR disclosure. The expected sign
for these variables measuring the reputations of agents involved in the IPO is positive. We posit that
reputable and prestigious firms should be associated with more CSR disclosure.
In consequence, we propose the following Signaling Quality Hypothesis (H3) with
two sub-hypotheses:
Hypothesis 3a (H3a). The reputation of the auditor has a positive effect on CSR disclosure.
Hypothesis 3b (H3b). The reputation of the underwriter has a positive effect on CSR disclosure.
The literature has demonstrated that the business cycle affects IPOs [70–72]. The dynamics of
the capital market will influence the IPO activity [73]. This is the reason to control in our research for
the return on the pre-IPO market. The influence of the ex-ante uncertainty in IPOs is documented in
the literature. Other studies explore the impact of investor sentiment on IPOs. In some models, the
aftermarket price of IPO shares depends on information about the intrinsic value of the company andSustainability 2020, 12, 4390 9 of 22
investor sentiment [74–82]. The control measures connected to information asymmetry referred to IPO
firms and offer characteristics as well as the effect of the market situation are considered in the model.
The more appropriate theories used to explain the CSR disclosure practices are legitimacy theory,
stakeholder theory, social contract theory, and signaling theory [83,84]. Omran and Ramdhony [84] show
that there is no universal theory applicable to CSR disclosure for all situations or societies. Although
legitimacy theory and stakeholder theory are considered complementary rather than competing
theories, their use will depend on the identified user group for CSR disclosures. According to the
stakeholder theory, organizational management and business ethics account for multiple constituencies
impacted by business entities, such as employees, suppliers, local communities, and creditors. On the
other hand, legitimacy theory helps to understand the organization’s behavior in implementing,
developing, and communicating its social responsibility policies. The main assumption of legitimacy
theory is fulfilling the organization’s social contract, which enables the recognition of its objectives. This,
in turn, requires, among other things, the adoption of a CSR strategy affecting various areas of activity,
also including management accounting. Social contract theory is appropriate for developed/emerged
economies, as CSR disclosure exists due to an implicit social contract between business and society,
which implies some indirect obligations of businesses towards society. Signaling theory will suit a
situation where firms are competing for resources. A firm willing to demarcate itself from other firms
will engage in more CSR practices. It is also important that the signal reaches the target audience by
reporting on CSR [84]. Our hypotheses in this research fit better with the legitimacy theory rather than
the stakeholder theory, and also with the signaling theory, because these hypotheses have to do with
the fact of signaling to the investors and the society the quality of the company that goes public as well
as its CSR strategy.
4. Methodology
This section is dedicated to presenting the sample and data of our research as well as the
explanatory and control variables considered in the model for our empirical analysis.
4.1. Sample and Data
The database of this research includes the companies that went public on the Spanish capital
markets—Continuous Market or AIM (Alternative Investment Market)—during the 16 year period of
1998–2013. The AIM is a secondary market for small- and medium-sized firms [85]. The final number
of companies going public in that period is 72 IPOs: 49 on the Continuous Market and the other 23 on
the AIM. With this database, the results of our research are representative not only of the situation for
small companies (23), but also for large companies, which is, traditionally, the type of company more
common in the Spanish capital market. The distribution of the database is given in Table 2.
Table 2. Number of initial public offerings (IPOs) every three-year period except for the last one.
1998–2000 18
2001–2003 3
2004–2006 13
2007–2009 13
2010–2012 23
2013 2
N 72
Our data come from the reports that firms must submit before going public. We hand-collected
our set of data from these prospectuses, which are available at the Spanish Stock Exchange Commission
(CNMV). The reason for selecting this type of company is that the level of information asymmetry is
higher than for the rest of the companies in the quoted market. Hence, the relation with CSR disclosure
could prove more informative and could thus grant additional value to our research.Sustainability 2020, 12, 4390 10 of 22
4.2. Explanatory Variables
CSR has to do with the fact that firms contribute to sustainable development. We propose CSR
disclosure as the dependent variable (namely corporate social responsibility disclosure (CSRD)), which
takes a value of one if a company issues a report about CSR in the IPO, and zero otherwise. Now, we
describe the selection of variables to test the proposed hypotheses.
The variables to test the Corporate Governance Hypothesis (H1) are the following: NONEXE
is the proportion of non-executive directors on the board. As for the independence on the board,
we select the variable INDEPD, which is the number of independent directors. In order to test the
sensitivity of the board and its influence on the CSR strategy, we include the variable WOMEN, which
is the number of women on the board of directors. The presence of large shareholders on the board
of directors could also affect CSR disclosure, so we include the variable LARGE as the number of
directors representing large shareholders. Finally, larger companies have bigger boards of directors.
This is defined with the variable TOTNUM, which is the size of the board (total number of members).
Finally, to test this hypothesis, we have included the dummy variable CEODUAL, which takes value 1
if the CEO and chairman posts are the same, and 0 otherwise.
As for the Ownership Structure Hypothesis (H2), the variable DIREPROP refers to the percentage
of shares in the IPO in the hands of the board’s members, while the inclusion of DIREPROP2,
which is the square of the previous variable, has the aim of testing the non-linear relationship.
The proportion of shares in the hands of the first three shareholders prior to the offer (C3) is expected
to have a negative relation with CSRD. We also consider alternative concentration indexes, such as
the Herfindahl–Hirschman concentration index (HERF) and the Cubbin–Leech concentration index
(CUBIN). The expected relation for them with CSRD is negative [86].
In order to test the Signaling Quality Hypothesis (H3), the variables are the following: AUD, to
control for the effect of the external agent’s reputation. The variable AUD takes the value of 1 for a
prestigious auditor and 0 otherwise. These auditors are named the “Big Five” before 2002 and the
“Big Four” after the failure of Arthur Andersen in 2002. The expected sign for this variable is positive
because of the decisions of firms choosing more reputable auditing firms and better CSR compared to
other firms [68]. The reputation of the underwriter is estimated according to the underwriters’ market
share in all IPOs in this research. The variable UREPUT equals 1 if the underwriter belongs to the
prestigious group of underwriters in the IPO market, and 0 otherwise. The expected sign for this
variable and its influence on the CSR disclosure is positive, because more prestigious companies will
be more interested in CSR strategies that enable them to become more competitive and prove more
interesting to investors.
4.3. Control Variables
In order to control other firms’ characteristics, we include measures of the solvency and the size
of the company, assuming that said characteristics could exert a positive influence on CSR disclosure.
The solvency ratio measures an enterprise’s ability to meet its debt obligation, and it indicates whether
a company’s cash flow is enough to meet its short-and long-term liabilities. We include the variable
SOLV as the relationship between assets and liabilities, predicting a positive relationship in terms
of CSR disclosure. Moreover, larger companies have more resources to develop CSR strategy, so we
include SIZE as the total asset value (in logarithm) in the year before the IPO, also predicting a positive
relationship with the dependent variable, as stated before. Another control variable is the age of the
firm, AGE, measured as the number of years (in logarithm) since the foundation of the firm to the IPO
(in logarithm). Older firms are expected to develop CSR disclosure more than newer firms. On the
other hand, we have also incorporated a control variable related to the size of the IPO, which is OFFER,
as a ratio between the size of the company and the size of the IPO, also with an expected positive
relationship with CSR disclosure.
In our research, we control for the market situation prior to the IPO [71,72]. The variable MARKET
has been calculated as the buy-and-hold return of the general index during the one month before theSustainability 2020, 12, 4390 11 of 22
IPO. We also control for the type of market with the CONT dummy, which equals 1 when the firm goes
public in the continuous market and 0 if it is on the AIM market, where newer and smaller companies
are quoted. The expected sign for the coefficient of this variable is negative. Additionally, we control
for time effects via a set of dummy variables. All models include these time dummy variables. As far
as industry effects are concerned, these have been seen to have no influence on CSR, and, thus, we
finally decided to exclude them.
We propose the following Probit model to test the previous hypotheses:
CSRDi = a0 + β Xi + Dt + µi, (1)
where i is the firm, Xi denotes the explanatory and control variables of firm i, and Dt is a set of dummy
time variables included in the regression. Finally, µi is the error term. In this model, we are explaining
an annual issuance of CSR disclosure at a given time, which is the year prior to the IPO, so the Probit
model is appropriate due to the characteristics of the dependent variable. In this research, our analysis
is done for companies that go public with a higher degree of information asymmetry.
The summarized hypotheses and variables in our research and the sign for each coefficient are
presented in Table 3.
Table 3. Hypotheses and control variables.
Variable Definition Code Prediction
Dummy variable that takes a value of
Dependent Corporate Social
1 if a company issues a CSR report in CSRD
Variable Responsibility Disclosure
the IPO; 0 otherwise.
Non-Executive Ratio Proportion of non-executive directors. NONEXE Negative
Independent Directors Number of independent directors. INDEPD Positive
Corporate Women Directors Number of women in the board. WOMEN Positive
Governance Number of director representatives of
Large Shareholders LARGE Positive
(H1) large shareholders.
Size of the Board Total number of board members. TOTNUM Positive
Dummy that takes value 1 if CEO and
CEO Duality CEODUAL Negative
chairman are the same; 0 otherwise.
Proportion of IPO shares in the hands
Directors in the IPO DIREPROP Negative
of the board of directors.
Directors in the IPO Square proportion of IPO shares in
Ownership DIREPROP2 Positive
(square) the hands of the board of directors.
Structure Major shareholder Proportion of shares for the first three
(H2) C3 Negative
ownership shareholders prior to the IPO.
Herfindahl–Hirschman
Herfindahl Index. HERF Negative
index
Cubin–Leech index Cubin–Leech Index. CUBIN Negative
Dummy variable equal to 1 for a
Auditor Dummy AUD Positive
Signaling Quality high-reputation auditor (0 otherwise).
(H3) Dummy variable equal to 1 for a
Underwriter Reputation high-reputation underwriter (0 UREPUT Positive
otherwise).
Control variables
Buy-and-Hold Return of general
Market Situation Market Return MARKET +/-
index prior to the IPO.
The relation between assets and
Solvency Ratio SOLV Positive
liabilities.
Logarithm of asset value in the year
Size SIZE Positive
Firm and IPO before the IPO.
Characteristics Logarithm of number of years since
Age the foundation of the company until AGE Positive
the IPO.
Ratio between the size of the firm and
Offer Size OFFER Positive
the size of the offer.Sustainability 2020, 12, 4390 12 of 22
Table 3. Cont.
Variable Definition Code Prediction
Dummy equal to 1 when company
CONTINUOUS Market goes public in CONTINUOUS
Type of Market CONT Negative
Dummy Market, 0 in the Alternative
Investment Market (AIM).
The following Table 4 is dedicated to presenting the main descriptive statistics for the 72 companies
that made an IPO in the Spanish capital market from 1998–2013.
Table 4. Descriptive statistics.
Mean Std. Dev. Minimum Maximum
IPO Shares of Board Members (DIREPROP) (%) 22.59% 19.56% 0.00% 100.00%
Square proportion of IPO Shares of Board
887.71% 1541.78% 0.00% 1000.00%
Members (DIREPROP2) (%)
Equity of the first three shareholders (C3) 0.68 0.18 0.61 0.69
Herfindahl Index (HERF) 0.66 0.22 0.32 1.00
Cubin–Leech Index (CUBIN) 0.75 0.18 0.45 1.00
Non-Executive (NONEXE) 0.73 0.16 0.33 1.00
Independent (INDEPD) 1.19 0.62 0.00 2.31
Women (WOMEN) 0.39 0.52 0.00 1.61
Large Shareholder (LARGE) 1.25 0.82 0.00 3.04
Total Number of Members (TOTNUM) 9.49 4.30 7.50 12.00
Auditor dummy (AUD) 0.75 0.43 0.00 1.00
Underwriter Reputation (UREPUT) 0.53 0.50 0.00 1.00
Market Return (MARKET) −0.00 0.02 −0.06 0.12
Solvency Ratio (SOLV) 9.06 32.51 −59.05 244.77
Assets Value (SIZE) 19.28 2.73 17.08 20.19
Natural logarithm of age of the firm (AGE) 2.45 1.14 0.69 4.62
Size of the firm related to size of the offer
5.22 × 10⁸ 9.13 × 10⁸ 0.00 4.07 × 10⁹
(OFFER)
N = 72. Spanish IPOs between 1998 and 2013. Summary statistics. See variables in Table 3.
According to the data in Table 4, with the descriptive statistics for the main variables in our
sample, the firms have 73% of non-executive directors and the size of the board is close to 10 members
on average, but women are only 0.39. In general, women on boards are not experts, but representatives
of large shareholders. Taking these numbers into account, the board of directors’ ownership is close
to 23% on average. We control for potential correlation problems in our econometric estimations.
The correlation matrix is presented in Table 5 as well as the variance inflation factor (VIF) test results in
order to check the multicollinearity issues. For those cases where we find correlations between the
variables (VIF higher than 10), these are considered in alternative estimations so that our results are
not affected by correlation problems.Sustainability 2020, 12, 4390 13 of 22
Table 5. Correlation matrix for listed variables and the variance inflation factors (VIF).
(I)
CSRD NONEXE INDEPD WOMEN LARGE TOTNUM CEODUAL DIREPROP DIREPROP2 C3 HERF CUBIN AUD
CSRD 1
NONEXE −0.1843 1
INDEPD 0.0747 0.1615 1
WOMEN −0.0554 0.3246 0.3369 1
LARGE −0.0809 0.5745 0.1495 0.2806 1
TOTNUM −0.2995 0.5535 0.4056 0.4971 0.6056 1
CEODUAL 0.1650 −0.2341 0.1066 0.0706 −0.0959 −0.1484 1
DIREPROP 0.1483 −0.1466 −0.2504 −0.0963 −0.1808 −0.3053 0.1368 1
DIREPROP2 0.1749 −0.1836 −0.2854 −0.1221 −0.2218 −0.3350 0.1259 0.9041 1
C3 −0.0328 −0.2172 0.2173 −0.0741 −0.1944 −0.0943 0.1138 −0.1644 −0.1754 1
HERF −0.0102 0.0343 0.1287 0.0252 −0.0834 −0.0468 −0.0456 0.0433 0.0605 0.4809 1
CUBIN −0.0345 0.0522 0.0748 −0.0324 −0.0888 −0.0542 −0.0885 0.0519 0.0605 0.3961 0.9760 1
AUD −0.3048 0.1749 0.1059 0.1699 0.2231 0.4245 −0.1448 −0.0671 −0.0248 −0.1276 −0.0525 −0.0279 1
(II)
CSRD NONEXE INDEPD WOMEN LARGE TOTNUM CEODUAL DIREPROP DIREPROP2 C3 HERF CUBIN AUD
UREPUT −0.2520 0.2572 0.2130 0.1450 0.3563 0.4849 −0.2001 0.0870 0.0171 −0.0850 −0.0718 −0.0734 0.5461
MARKET −0.0287 0.0827 0.0918 −0.0036 −0.1533 −0.1028 0.0684 −0.0478 −0.0470 −0.1588 −0.0507 −0.0860 0.0468
SOLV −0.1135 −0.0187 0.0026 0.1463 0.0971 0.1816 0.0809 −0.1126 −0.0554 0.1522 −0.0125 −0.1017 0.0555
SIZE −0.0465 0.2468 0.3140 0.3337 0.3615 0.4222 0.1259 −0.0910 −0.0928 0.0674 0.1198 0.0563 0.2701
AGE −0.0847 0.0828 0.0661 0.2307 0.0057 0.0660 −0.0155 0.1485 0.0820 −0.0008 0.0495 0.0304 0.1437
OFFER −0.0661 0.3095 0.3819 0.3075 0.3930 0.4769 −0.0859 −0.1738 −0.1568 0.1485 0.2129 0.1672 0.3223
CONT −0.5471 0.2723 0.2006 0.2048 0.2352 0.6220 −0.2117 −0.0264 −0.0801 0.0619 0.0683 0.0738 0.6363
VIF 1.7800 1.4200 1.4300 1.8900 2.4400 1.1500 5.7300 5.5300 1.1900 28.460 28.730 1.8200
1/VIF 0.5613 0.7063 0.6985 0.5301 0.4102 0.8690 0.1744 0.1807 0.8370 0.0351 0.0348 0.5491
(III)
UREPUT MARKET SOLV SIZE AGE OFFER CONT
UREPUT 1
MARKET −0.1360 1
SOLV −0.0500 0.0769 1Sustainability 2020, 12, 4390 14 of 22
Table 5. Cont.
(III)
SIZE 0.2137 −0.0569 0.3408 1
AGE 0.2974 0.0083 −0.0595 0.0577 1
OFFER 0.3116 −0.1380 0.3275 0.6914 −0.0244 1
CONT 0.7243 −01564 0.1626 0.3264 0.2569 0.3919 1
VIF 2.6000 1.1500 1.5100 2.0800 1.1700 2.300 3.0200
1/VIF 0.3853 0.8722 0.6640 0.4799 0.8543 0.4343 0.3314Sustainability 2020, 12, 4390 15 of 22
5. Results
The results of the model estimation by Probit together with the alternative measures and
independent variables considered are shown in Tables 6–8, considering the correlation levels between
them. In Table 6, we display the results with the alternative variables to test the Corporate Governance
Hypothesis. In Tables 7 and 8, the results for the other two hypotheses and control variables are shown.
Table 6. Results (I).
Variable Model (1) Model (2) Model (3)
2.9829 4.4029 3.6565
Intercept
(0.550) (0.850) (0.420)
−11.5481 *** −10.3005 ** −9.7452 **
NONEXE
(−2.390) (−2.210) (−1.910)
4.9499 ** 5.5747 ** 6.5519 **
INDEPD
(2.150) (2.31) (2.17)
−1.0641 −0.8029 −1.3257
WOMEN
(−0.920) (−0.750) (−0.980)
2.8898 ** 3.3020 *** 3.6116 ***
LARGE
(2.240) (2.440) (2.500)
−2.2503 −3.2859
TOTNUM
(−0.750) (−0.960)
1.2917
CEODUAL
(0.860)
−0.2362 −0.2533 −0.3088
DIREPROP
(−1.460) (−1.550) (−1.430)
0.0049 * 0.0053 * 0.0063
DIREPROP2
(1.620) (1.690) (1.490)
0.4026 0.8886 1.5513
AUD
(0.360) (0.710) (1.000)
2.7353 * 2.5199 3.6924
UREPUT
(1.720) (1.580) (1.420)
−16.7818 −21.8886 * −33.7763 *
MARKET
(−1.470) (−1.610) (−1.690)
−9.0951 *** −8.4458 *** −9.6607 **
CONT
(−2.610) (−2.570) (−2.170)
Annual effect considered YES YES YES
Pseudo R2 78.55% 79.10% 80.11%
Log-likelihood −10.6978 −10.4230 −9.9188
Chi-squared 78.36 *** 78.91 *** 79.92 ***
No. observations 72 72 72
N = 72. Spanish IPOs between 1998–2013. Probit estimations. STATA package. See variables in Table 3. Time
dummy variables included. ***, **, and * indicate significance at 1%, 5%, and 10%. (t-statistic).
The results in Table 6 confirm the Corporate Governance Hypothesis (H1). In particular, these
results support hypotheses H1a, H1b, and H1d, but not H1c (WOMEN), H1e (TOTNUM), and H1f
(CEODUAL). We find support with respect to the influence exerted by the proportion of non-executive
directors and independent directors on CSR disclosure. Moreover, large shareholders also have a
significant influence on CSR disclosure. In consequence, both the number of independent directors and
the number of large shareholder representatives positively influence CSR reporting. This first result
is in line with [8], while the second result for large shareholder representatives lends support to the
studies who proposed that ownership structure is characterized by the presence of large shareholders
and is related to CSR activities. On the other hand, contrary to the literature [4,12,40,87], among others,
our results do not reveal any influence on CSR disclosure for Spanish IPO firms in terms of women
directors, duality of CEO and chairman positions, or board size. In order to explain the result for
women directors and because it is a hand-collected sample, we know that women on Spanish boards of
directors in our database are generally selected because they are representatives of large shareholders,Sustainability 2020, 12, 4390 16 of 22
but not for being experts. This is a bias in the criteria for selecting women capable of making positive
decisions for the company, such as improving the CSR disclosure, and is also an explanation for not
finding a statistically significant coefficient for this variable.
Table 7. Results (II).
Variable Model (1) Model (2) Model (3) Model (4)
2.9829 7.2819 2.1939 −9.9586 **
Intercept
(0.550) (0.590) (0.490) (−2.370)
−11.5481 *** −18.4837 * −11.6886 ** −12.2197 **
NONEXE
(−2.390) (−1.720) (−2.41) (−2.390)
4.9499 ** 7.4087 ** 4.8269 ** 4.9505 **
INDEPD
(2.150) (1.930) (2.18) (2.130)
−1.0641 −2.6045 −0.6684 −0.5562
WOMEN
(−0.920) (−1.170) (−0.560) (−0.460)
2.8898 ** 3.7662 ** 2.7921 ** 2.8483 **
LARGE
(2.240) (2.170) (2.340) (2.370)
−0.2362 −0.2131 −0.2206 −0.2250
DIREPROP
(−1.460) (−1.560) (−1.430) (−1.380)
0.0049 * 0.0046 * 0.0048 0.0050
DIREPROP2
(1.620) (1.780) (1.580) (1.440)
−105.6020
C3
(−1.030)
1.4572
HERF
(0.60)
2.3209
CUBIN
(0.790)
0.4026 −0.7865 0.5879 0.6111
AUD
(0.360) (−0.460) (0.490) (0.470)
2.7353 * 3.5259 3.0735 * 3.2590 *
UREPUT
(1.720) (1.580) (1.710) (1.730)
−16.7818 −30.4796 * −14.4497 −12.7429
MARKET
(−1.470) (−1.620) (−1.240) (−1.070)
−9.0951 *** −10.0282 *** −9.6367 ** −9.6607 **
CONT
(−2.610) (−2.570) (−2.52) (−2.170)
Annual effect considered YES YES YES YES
Pseudo R2 78.55% 80.11% 78.93% 79.28%
Log-likelihood −10.6978 −9.9221 −10.5086 −10.3365
Chi-squared 78.36 *** 79.91 *** 78.74 *** 79.08 ***
No. observations 72 72 72 72
N = 72. Spanish IPOs between 1998–2013. Probit estimations. STATA package. See variables in Table 3. Time
dummy variables included. ***, **, and * indicate significance at 1%, 5%, and 10%. (t-statistic).
As for the Ownership Structure Hypothesis (H2), the results in Tables 6 and 7 show that DIREPROP
and DIREPROP2 have coefficients with different signs. These results confirm the non-linear effect
on the level of CSR disclosure for IPO firms because of the change in sign. The inverted U-shaped
effect of director ownership on CSR disclosure is confirmed according to our results. In the case of
CSR disclosure, the negative relation for low levels is not significant, while the positive relation is
statistically significant. This result indicates that, at this level, the compromise with CSR disclosure
is higher. However, we do not find support for any measure of ownership concentration, since the
coefficients for C3 and for the two alternative concentration indexes (Herfindahl–Hirshman Index and
Cubin–Leech Index) are not statistically significant.Sustainability 2020, 12, 4390 17 of 22
Table 8. Results (III).
Variable Model (1) Model (2) Model (3)
2.9829 2.7322 3.0400
Intercept
(0.550) (0.700) (0.130)
−11.5481 *** −13.7679 ** −11.0645 **
NONEXE
(−2.390) (−2.220) (−2.000)
4.9499 ** 5.7142 ** 5.8461 **
INDEPEND
(2.150) (2.220) (1.780)
−1.0641 −1.129 −1.198
WOMEN
(−0.920) (−0.940) (−0.990)
2.8898 ** 3.4379 ** 3.0773 **
LARGE
(2.240) (2.180) (2.000)
−0.2362 −0.2604 −0.2568
DIREPROP
(−1.460) (−1.440) (−1.490)
0.0049 * 0.0054 * 0.0054 *
DIREPROP2
(1.620) (1.610) (1.620)
0.1419
AGE
(0.230)
-0.6610E-9
OFFER
(−0.870)
-0.4330E-9
SIZE
(−0.700)
0.0122
SOLV
(0.530)
0.4026 0.4474 0.7858
AUD
(0.360) (0.380) (0.600)
2.7353 * 2.8966 * 3.6263
UREPUT
(1.720) (1.750) (1.380)
−16.7818 −16.4864 −23.6782
MARKET
(−1.470) (−1.410) (−1.260)
−9.0951 *** −8.6911 *** −11.2467 *
CONT
(−2.610) (−2.710) (−1.710)
Annual effect considered YES YES YES
Pseudo R2 78.55% 79.21% 79.01%
Log-likelihood −10.6978 −10.3681 −10.4697
Chi-squared 78.36 *** 79.02 *** 78.82 ***
No. observations 72 72 72
N = 72. Spanish IPOs between 1998–2013. Probit estimations. STATA package. See variables in Table 3. Time
dummy variables included. ***, **, and * indicate significance at 1%, 5%, and 10%. (t-statistic).
In relation to the Signaling Quality Hypothesis (H3), this is also confirmed because of the result
for the UREPUT variable with a positive and statistically significant sign. This hypothesis postulates
that the reputations of the auditor and underwriter could reduce the asymmetry of information. There
should thus be a positive relationship between these two variables and the quality of the firm, the CSR
disclosure, and strategy. Thereby, the reputation of this agent helps signal the quality of the firm
going public and reduces ex-ante uncertainty about its value; this, in turn, affects CSR disclosure.
The positive sign found for this variable indicates that the reputation of the company should be directly
connected with CSR. The firm going public also uses the underwriter’s reputation to eliminate part of
the ex-ante uncertainty not dealt with in the IPO prospectus. We found that reputable and prestigious
firms are associated with more CSR disclosure. Hence, the relationship between the variable measuring
the underwriter’s reputation and the CSR disclosure is positive and statistically significant. Taking
into account this result, we find partial support for the Signaling Quality Hypothesis (H3). However,
the coefficient for the AUD variable is not statistically significant, and this result is contrary to the
literature [4].
As for the control variables, the result for the size of the company (SIZE) is not statistically
significant. According to this result, the effect of the asymmetry of information is not conclusive, andSustainability 2020, 12, 4390 18 of 22
we cannot conclude that larger firms perform better CSR disclosure. The same occurs with the solvency
(SOLV) and the age (AGE) of the firm and with the offer size (OFFER). Note that the control variables
are not affecting our results, but, instead, controlling them.
The pseudo R2 coefficient is approximately 78% in all of the regressions. This result is in favor of
the quality of model´s fit.
6. Conclusions
In this paper, we analyze the influence of the board of directors on CSR disclosure. We delve
deeper than prior research because we analyze the influence of board composition and ownership
structure on CSR disclosure for those companies that undertook an IPO in the Spanish capital market
during the period 1998–2013. This marks an important difference with respect to the previous studies
because IPO firms present a higher degree of information asymmetry. They have never been quoted in
the capital market, so the informative value for CSR disclosure is higher. After controlling for other
influences, such as the auditor’s reputation or the underwriter’s reputation, we explore the possibility
of a non-linear relationship between the proportion of shares in the IPO belonging to members of the
board of directors and the level of CSR reporting. In relation to the composition of the board and CSR
disclosure, a more complete analysis is provided given that we have more detailed data with respect to
the differing characteristics of IPO directors. Additionally, we analyze whether independent directors,
non-executive directors, women, large shareholders, the size of the board, and CEO duality affect the
way in which companies disclose information concerning CSR.
Our research is based on the companies that made an IPO during that period, both on the
Continuous Market and on AIM. Our results confirm that the members of the board and the types of
directors have real relevance in CSR disclosure: Independent directors, non-executive directors, and
large shareholder representatives affect the ways in which their companies disclose information about
CSR. However, we do not find influence of women directors on CSR disclosure. In this research, we
use a hand-collected sample, so we know that women on Spanish boards of directors are generally
selected because they are representatives of large shareholders, but not for being experts. This is a
bias in the criteria for selecting women capable of making positive decisions for the company, such as
improving the CSR disclosure.
Our results lend support for a non-linear relationship between the proportion of shares in the
IPO belonging to members of the board of directors and the level of CSR reporting. Finally, the
underwriter’s reputation has a positive and statistically significant influence on CSR disclosure for
Spanish IPOs. The reputation of this agent helps to signal the quality of the firm going public and
to reduce ex-ante uncertainty about its value; this, in turn, affects CSR disclosure. According to this
research, the firm going public uses the underwriter’s reputation to eliminate part of the ex-ante
uncertainty not dealt with in the IPO prospectus. Reputable and prestigious firms are associated
with more CSR disclosure. Hence, the relationship between the variable measuring the underwriter’s
reputation and the CSR disclosure is positive and statistically significant. However, we do not find
support for the influence of the reputation of the auditor on CSR disclosure.
The institutional approach is an interesting issue to be considered in future research about
CSR disclosure.
Author Contributions: This article is a joint work of the two authors, M.A.-P. and S.Á.-O., who contributed to the
research ideas, literature review, analysis, and the writing of the paper. All authors have read and agreed to the
published version of the manuscript.
Funding: This research received no external funding.
Conflicts of Interest: The authors declare no conflict of interest.You can also read