Stc group investor presentation - Investor Relations Q1, 2021
←
→
Page content transcription
If your browser does not render page correctly, please read the page content below
stc group
    investor
    presentation

    Investor Relations
    Q1, 2021

1
Investor Presentation 2021 | stc group

Index

    1   Saudi Arabia’s Macro-Economic Environment   3

    2   KSA Telecom Market Overview                 9

    3   stc Profile                                 13

    4   Strategy Overview                           24

    5   Business Overview                           27

    6   Sustainability at stc                       36

    7   Financial Highlights Q1, 2021               38
Saudi Arabia’s Macro-
Economic Environment

Investor Presentation 2021 | stc group
Gross Domestic Product (GPD) Growth Saudi Unemployment Rate (15+)
According to GASTAT data, real GDP showed that the economy decreased by 4.1% in GASTAT’s latest labor market release for Q4, 2020 showd that Saudi unemployment rate
Domestic Macroeconomic Indicators
2020 compared to 2019. This negative growth resulted mainly from the contraction in decreased to 12.6%, down from 14.9% in Q3, 2020. Male unemployment decreased to 7.1%,
oil sector by 6.7%, in addition to a negative growth rate of 2.3% recorded in the non-oil down from 7.9%, whereas female unemployment decreased significantly to 24.4%, down
sector. The private sector shrunk by 3.1%, and the government sector also showed a from 30.2% in Q3 2020.
negative growth rate of 0.5%.
Bn (SAR) 3,500 20.0% 42%
2,949 2,974 25%
2,800 2,836 32.5% 31.7% 31.4%
3,000 2,760 31.0% 30.9% 31.1% 30.9% 31.1% 30.8% 30.8% 30.2% 34%
2,582 2,625 Source: MoF 28.2%
2,517 2,454 15.0%
2,419 15.4%
2,500 14.9% 24.4%
15% 26%
12.8% 12.9% 12.9% 12.8% 12.7% 12.5% 12.6%
12.3% 12.0% 12.0%
2,000 10.0% 11.8%
18%
1,500 5%
5.0% 7.5% 7.6% 7.6% 7.5% 8.1% 7.9% 7.1%
6.6% 6.6% 6.0% 5.8% 5.6% 10%
1,000 4.9%
-5%
500 0.0% 2%
Q4 Q1 Q2 Q3 Q4 Q1 Q2 Q3 Q4 Q1 Q2 Q3 Q4
0 -15% 2017 2018 2018 2018 2018 2019 2019 2019 2019 2020 2020 2020 2020
2011 2012 2013 2014 2015 2016 2017 2018 2019 2020
Total Unemployment Rate Male Female
Nominal GDP (SAR) Nominal GDP % (Change) Real GDP (% Change) Source: GASTAT
Source: GASTAT
Inflation Rate Government Outlook on Expenditures & Revenues
The general consumer price index (CPI) registered in Q1, 2021 a Y-o-Y surge by 3.4% as it Bn (SAR)
was projected that inflation will rise due to the continues impact of VAT increase from 1200 50%
5 percent to 15 percent that was effective starting from July 2020 onwards. Yet, a slight 1,020 990 955 928 941
decline by 0.4% was witnessed in Q-o-Q. 1000
864 40%
833 849
5.7% 800
4.90%
30%
32.7% 33.3%
31.7%
2.8% 600
2.2% 2.1% 5.30%
1.5% 26.0% 20%
1.0% 0.5%
0.2% 400
2.5% -0.7% -0.8% 2.1% 2.2% -0.8%
1.9% 10%
200
-0.5%
-1.1% -1.4% 0 0%
-2.1%
2020 (budget) 2021 (budget) 2022 (projection) 2023 (projection)
Total Revenue Total Expenditure Debt (% GDP)
Source: SAMA
4
Investor Presentation 2021 | stc group
Saudi Population
Population Census Distribution by Age Group (2019)
33.41 34.21
(Mn) 35 32.55 10%
→ Saudi population is the largest 30.77 31.02
31.79 3%
13.10
and youngest demographic in 30 12.14
12.65
11.71
the GCC region. 10.07 10.24
7% 31%
25 28%
→ 2019 GASTAT data showed that
5.39%
62% of the population is 20 4%
Young and Robust Population
2.49% 2.41% 2.65% 2.38%
between the age of 15 and 49.
15 0.80%
1%
10
20.70 20.77 20.08 20.41 20.77 21.11
5 -2% 38%
2014 2015 2016 2017 2018 2019
Saudi Non-Saudi Growth Rate
0-19 20-39 40-64 65+
Source: GASTAT
Foreigners in the Saudi Labor Force
(Mn) 9.0 6%
→ Latest General Organization for 7.91
7.71
7.40
Social Insurance (GOSI) figures 7.13
3.6%
showed a decrease in the rate of 8.0 6.90 4%
expat exodus in Q1, 2021. 6.71
6.58
6.90
7.0 6.71 2%
→ Despite the increase in number 6.58 6.52 6.67 6.65
6.41
6.44
of workers during Q1, 2020, 6.27 6.25
approximately 417 thousand of 6.0 -1%
expats departure by Q1, 2021. -0.8%
-0.4% -0.3%
-0.9%
-1.3% -1.3%
-1.5%
5.0 -2.0% -3%
-3.6% -2.1%
-2.5% -2.7%
-4.1%
-3.4% -3.3%
-3.6%
4.0 -5%
Q1-17 Q2-17 Q3-17 Q4-17 Q1-18 Q2-18 Q3-18 Q4-18 Q1-19 Q2-19 Q3-19 Q4-19 Q1-20 Q2-20 Q3-20 Q4-20 Q1-21
Male Female Growth
5 Source: GOSI
Investor Presentation 2021 | stc group

                                Average Historical Communication Consumer                                     Segmentation of Average Consumer Spending in
                                Spending (By Total Households)                                                2018 (By Total Households)
                                → Throughout the years, percentage of consumer spending on
Communication Sector Spending

                                  communication services slightly witnessed a decrease.

                                → This is mainly due to a general reduction in the operational costs making     Food And Beverages                                                   17.2%
                                                                                                                                                      20.0%
                                  telecom operators to offer competitive packages in the market.
                                                                                                                Tobacco

                                                                                                                Fabric, Apparel and Footwear                                                      0.5%
                                                                     Average of Consumer
                                                                                                                Housing, Water, Electricity,                                                       3.8%
                                                 Average Household       Spending on
                                    Year                                                           %            Gas, and other Fuels
                                                      Salaries         Communication                            Furniture and Furnishings      5.1%
                                                                           Services
                                                                                                                Health
                                    2018               12,818                659                  5.14                                         2.6%
                                                                                                                Transport                      2.8%
                                    2013               11,522                726                  6.30
                                                                                                                Communications
                                    2007              10,280                 665                  6.47                                                                                           23.3%
                                                                                                                Recreation and Culture     5.1%
                                Source: GASTAT
                                                                                                                Education
                                                                                                                                                        11.9%
                                                                                                                Restaurants and Hotels                                 6.2%
                                                                                                                                                                1.3%
                                                                                                                Miscellaneous Personal Goods
                                                                                                                and Services

                                6
Investor Presentation 2021 | stc group
Aligning stc Strategy with 2020 NTP & 2030 Vision

                                                        2030 Vision Key Objectives                                                            NTP 2020 Key Objectives
                                                        → Raise our ranking on the E-Government Survey Index from our current                 → Provide broadband services to all KSA regions by stimulating investment
                                                          position of 36 to be among the top five nations                                       in infrastructure and regulatory frameworks
                                                        → Increase the private sector's contribution from 40% to 65% of GDP                   → Support e-commerce
                                                        → Increase women’s participation in the workforce from 22% to 30%
                                                                                                                                              → Bridge the digital gap in the skills of ICT users
                                                        → Move from our current position as the 19th largest economy in the world
                                                          into the top 15                                                                     → Increase the IT industry’s contribution in the non-oil GDP

                                                        → Lower the rate of unemployment from 11.6% to 7%                                     → Rehabilitation of specialized Saudi human capital and employment in
                                                                                                                                                CITC sector
                                                        → Increase SME contribution to GDP from 20% to 35%
                                                        → Increase our capacity to welcome Umrah visitors from 8 million to 30                → Develop and activate smart government transactions based on a
                                                          million every year                                                                    common infrastructure

                                                                                                                            → Lead the market in digital services and creative solutions
                                                                                                                            → Drive efficiencies through digital transformation

                                                               stc Strategy                                                 → Digitalize processes, internal operations, delivery engine and commercial approach
                                                                                                                            → Instill culture change
                                                                Elements                                                    → Grow B2G and B SME segments
                                                                                                                            → Lead technological advancement and provide best in class connectivity platform

               7
                                                    7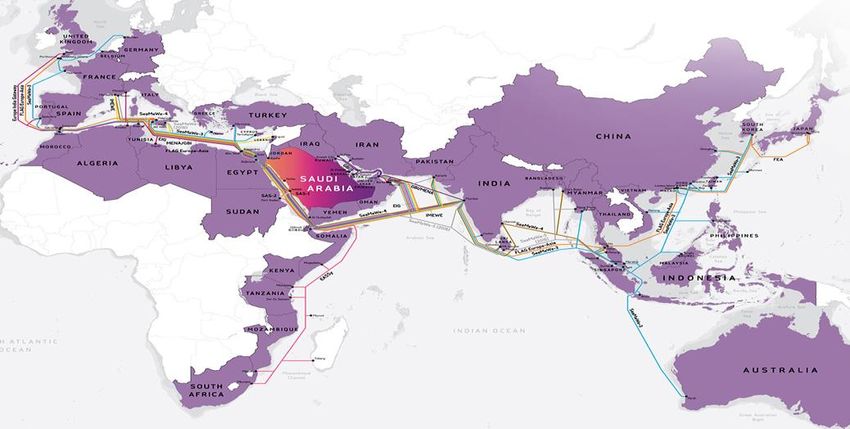
Investor Presentation 2021 | stc group

                                             → The point-of-sale (POS) transactions grew by 20% to SAR 31.05 billion in February 2021, from SAR 25.93 billion in the same period
                                               last year, data issued by the Saudi Central Bank (SAMA).
                                             → Assets held by the Saudi Central Bank (SAMA) saw a decline of SAR 17.1 billion month-on-month (MoM) to SAR 1.834 trillion in
                                               February 2021, according to data released by the central bank.
                             Macro Economy   → Saudi Arabia’s non-oil exports grew by 16% year-on-year (YoY), or SAR 2.56 billion, to SAR 18.91 billion in January 2021, according to
                              & Liquidity      the General Authority for Statistics (GASTAT).
                                             → Saudi Arabia’s oil exports grew by 1% month-on-month (MoM) to 6.58 million barrels per day (bpd) in January 2021, according to the
                                               Joint Organizations Data Initiative (JODI).
                                             → S&P Global Ratings affirmed Saudi Arabia’s sovereign credit ratings at ‘A-/A-2’ with a stable outlook. The credit ratings agency
                                               said in a statement that the Saudi economy will likely return to the positive growth in 2021 after the contraction seen in 2020.
KSA & Telecom Industry

                                             → Companies operating in the telecommunications sector in Saudi Arabia invested over SAR 40 billion in digital infrastructure over
                                               the past three years, according to Communications and Information Technology Commission (CITC) governor Mohammed
                               Regulatory      Altamimi.
                                             → The Saudi telecommunications industry is estimated at SAR 70 billion with the information technology market size at SAR 64
                              Environment      billion and Saudi postal services at SAR 6.4 billion. The market value of the Saudi telecom operators is estimated at SAR 246
                                               billion, according to (CITC) governor Mohammed Altamimi.
                                             → The Communications and Information Technology Commission (CITC) launched the ‘Game Mode’ initiative, with the aim of
                                               enhancing Saudi Arabia’s booming gaming sector.

                                             → Crown Prince Mohammed Bin Salman launched ”Shareek” program to strengthen the partnership with the private sector. The
                                               program aims to enhance the resilience and capacities of major regional and foreign companies. It also seeks to enhance the
                                               Saudi government’s position as a contributor for trade and strengthen the Kingdom’s reputation as a global economic power.
                                             → Crown Prince Mohammed Bin Salman said that several initiatives that will be launched in the short term could boost expenditure
                              Government       over the next decade to SAR 27 trillion, which would exceed spending in the last 300 years.
                                             → Crown Prince unveils Green Saudi and Green Middle East Initiatives. The Initiatives will set the Kingdom’s direction to protect
                               Initiatives     earth and nature.
                                             → Saudi Arabia licensed 91 new factories worth SAR 857 million in February 2021
                                             → Minister of Industry and Mineral Resources, Bandar Alkhorayef, launched “Made in Saudi”, under the sponsorship of Crown Prince
                                               Mohammed bin Salman. The move aims to support national products and services at both local and global levels.

       8
                         8
KSA Telecom Market
Overview
Investor Presentation 2021 | stc group

                                 4G Mobile Download Speed
                                   (Mbps)                                                            (Mbps)
Differentiated Through Quality

                                                                                   88.2                                                      106.2
                                                                         72.8                                                      78.2
                                                          51.4                                                61.8       66.2
                                                37.9

                                                                 Ookla                                                       Meqyas
                                          Q1-Q2 2019    Q3-Q4 2019    Q1-Q2 2020      Q3-Q4 2020               Q1 2020   Q2 2020   Q3 2020   Q4 2020

                                 4G Mobile Upload Speed
                                       (Mbps)
                                                                                                     (Mbps)

                                                           20.0           21.5         22.0
                                                17.0                                                          20.8                 21.0       22.8
                                                                                                                         20.2

                                                                  Ookla                                                      Meqyas

                                           Q1-Q2 2019    Q3-Q4 2019      Q1-Q2 2020     Q3-Q4 2020            Q1 2020    Q2 2020   Q3 2020   Q4 2020

                                  10
Investor Presentation 2021 | stc group
Telecom market has been going through a fixed-mobile
convergence wave to become an ICT one-stop-shop for
their business customers, providing mobile and fixed
telecommunication services and IT and IoT solutions,
under one contract (and therefore one billing).
AI & ML IoT Cyber Security Cloud Computing
$28.5 Million $2.2 Billion $425 Million $425 Million
Trending Technologies
→ AI & Machine Learning will grow at → More than 72% of organizations in → Security spending is predicted to → By end of 2021 Cloud spending in
a steady pace in 2021 to reach $ Saudi Arabia expected to deploy reach more than $ 425 Mn. the Kingdom will cross $541 Mn. By
28.5 Mn as enterprises will use an IoT solution to gain competitive 2023 total spending on cloud will
cognitive systems to monitor and advantage by cost reductions and → In 2021, more 26% of Saudi reach $ 789 Mn.
refine business processes. In 2023 improved productivity driving the organizations will invest heavily in
spending expected to reach $ 38.5 spending in the kingdom to cybersecurity solutions. 35% of → SaaS forms 75% of Cloud spending.
Mn. surpass $ 2.2 Bn in 2021 and security spending in META will
growing to $ 3.08 Bn in 2023. move to public cloud by 2023, up Top cloud applications:
→ 18% of Saudi organizations have from 19% in 2019. 40% of spending → Enterprise Performance
already implemented AI whilst → IoT spending will be driven by will be on managed security → Human Capital Management
more than 40% are looking to analytics, application platforms, services. → Financial Applications
invest in AI workloads within 2021. and security. → Procurement Applications
By 2023, 40% of the data collected → Marketing Campaign Management
throughout the customer journey → 5G technology for IoT is not yet
will be used to create a better fully standardized. The next two
product and a personalized years will be crucial for IoT related
experience. to 5G standardization.
→ Saudi Arabia’s AI & Data Authority
will empower public sector to
adopt AI use cases.
11
Source: IDC Report, Saudi ICT Market and ForecastInvestor Presentation 2021 | stc group
Internet Use Based on Device Perspective as of Jan 2021
# #
Total Number of Active Internet Users as a Total Number of Active Mobile Internet Users as a
Internet Users: 33.58 mn Percentage of Total Mobile Internet Users: Percentage of Total
Population: 96% 32.03mn Population: 95%
Mobile Subscriptions By Type as of Jan 2021
KSA Internet Usage
#
Total Number of Mobile Mobile Connections as a Percentage of Mobile Percentage of Mobile Percentage of
Connections: 39.53 mn Percentage of Total Connections That are Connections That are Mobile Connections
Population: 113% Pre-paid: 62% Post-paid: 38% That are Broadband:
94%
Source: Hootsuite
12We are looking forward stc Profile stc is ranked as the 3rd most valuable brand in the Middle East with a total value of SAR 34.5 bn (USD 9.20 bn) as of January 2021
Investor Presentation 2021 | stc group

                                              stc is                  A-
                        #1 in KSA in     Saudi Arabia's           Standard
                          Mobile        Speedtest Award            & Poor's
                             &               Winner                   A1
                     Fixed Broadband   for mobile network         Moody's
                        subscribers         coverage                 AAA
                                       during Q3-Q4 2020           Tasneef

                                             Length         Total stc group
                       #1 in KSA in       of deployed        employees 19K
                       Post-paid &         fiber optic              &
                        Pre-paid        cables at the end    Total stc KSA
                       subscribers           of 2020        employees 13.6K
                                            229K KM          (2.1% turnover rate)
stc at Glance

                                       More than 12 data
                                                               SAR 34.5 bn
                        #1 in KSA in       centers
                                                            3rdMost valuable        Let’s go
                     Fixed Telephony    spread across
                                                              Brand (AAA-)          forward
                       subscribers            the
                                                            As of January 2021
                                          Kingdom

                14
Investor Presentation 2021 | stc group
1998 2005 2007 2009 2011 2013 2015 2017 2019
Stack acquisition Acquired 60% $5 billion international Sukuk
10 million Acquisition of push-
Company in MAXIS stake in Sale stc ranked as most program offering.
mobile 3rd mobile license in to-talk (PTT) stc became an ICT
Incorporation. Communications Communication. valuable brand in Establishment of Tawal
subscriber Viva Bahrain. mobile operator
stc IPO and its operations Share Increase in integrated player Saudi Arabia. Company.
mark. Public Telecom
(December, in Indonesia & AXIS Indonesia in the region. Establishment of Launching 5G services.
Launch of 3G Company (Bravo).
2002). India. and Integral. STV with $500 Launched the new brand of
and 3.5G Establishment of
Won third mobile Launched IPTV million capital. stc.
mobile Aqalat Company.
license in Viva services in Saudi Uber acquisition of Careem
technology.
Kuwait. Arabia. (in which stc owns a direct
stake of 8.8% and an
indirect stake of 9.3%).
1998-2003 2005-2006 2007-2008 2009-2010 2011-2012 2013-2014 2015-2016 2017-2018 2019-2020
2003 2006 2008 2010 2012 2014 2016 2018 2020
SAR 5 billion Sukuk Share increase in Received highest
Stake acquisition in Launched Bundled Fiber Optic in Saudi. Comprehensive
Introduction of Increased Reached more than program offering VIVA Kuwait up to credit rating by
Our Journey
Oger. services. settlement
DSL services. capital from 500 residents. (1st series was SAR 51.8% and Sale Co. SIMAH Rating
Launched Indonesian agreement with the
SAR 15 billion 2 billion). to 100%. Agency
operation under the Government.
to SAR 20 “Tassnief”.
name AXIS. Announcement of
billion. Sale equity stake
new Dividend
of 15% in stcPay
Policy.
to Western
Launch of stcPay.
Union with a
value of SAR
750 million (USD
200 million).
15Investor Presentation 2021 | stc group
Expanding our footprints across four countries has unlocked growth
opportunities…
2007 Kuwait
2009 Bahrain
Our Regional Footprint
Kingdom of
Saudi Arabia
2008
Malaysia
165G technology
Investor Presentation 2021 | stc group
1st Launched 4,000 5G Towers IoT Technology Award Wining
Commercial Network
Total number of 5G towers as end of 2020 The company will benefit from stc group won 3 international
stc group is the first telecom
reached 4,000 deployed in more 47 cities Internet of Things (IoT) enabled by awards at the 5G MENA Summit.
company launching the fifth
across the Kingdom. 5G technology. It will not only
generation technology in the
region commercially (KSA, Kuwait enhance operational efficiencies
The next phase of the 5G expansion in and user experiences but also
and Bahrain).
Saudi Arabia, is to increase the network provide new revenue opportunities.
by 2,300 towers to reach over 71 new 5G technology in industrial
The fifth generation in the
cities across the Kingdom. applications is a future plan, as the
Kingdom was launched through
broadband applications. company operates in several areas,
stc deals with various international including oil and gas, service
suppliers for providing 5G equipment. agencies and various industries.
1 17
2Investor Presentation 2021 | stc group
# Cable System Name of Cable → stc has given a strategic importance to establish its international network, as
about 99% of the total communication and data transmission is carried out
1 SMW5 South Asia Middle East #5 Western Europe
through Submarine Cables.
2 SMW4 South Asia Middle East #4 Western Europe
3 IMEWE India Middle East Western Europe → stc serves the Middle East and North Africa (MENA) region through its
international network, which for more than 25 years is considered one of the
4 EIG Europe India Getaway leading networks in the region.
5 SMW3 South Asia Middle East #3 Western Europe
Submarine Cable Investment & Optimized
→ stc has signed with more than 400 operators all over the world in more than 100
6 1-SAS 1- Saudi Arabia Sudan countries.
7 2-SAS 2- Saudi Arabia Sudan
→ stc runs more than 90% of the volume of the internet traffic and data in the
8 EASSY Eastern Africa Submarine System Kingdom and increases the data traffic to more than 3,500 TB per day. The
9 MENA Middle East North Africa company passes the data flows through the largest internet gateway in the region
with capacity of 4,000 GB per second.
10 FLAG Fiber link around Global
11 GBI Gulf Bridge International → stc is one of the initiators and founders of the fourth continental submarine
cable, which extends for a distance of 20 thousand Km and connects 14 countries
12 JADI Jeddah Amman Damascus Istanbul
between Singapore and France. The company is also a founding member of
IMEWE marine cable project linking India, Middle East and Western Europe.
→ The Company is a founding member of EIG Europe India Getaway project that
extend from the UK through Alexandria with landing station in Tark mountain,
Libya and Morocco, and from Egypt to India with landing station in Saudi Arabia,
Oman, Djibouti and UAE.
→ The latest achievements was the completion of a project of an international
alliance of more than 14 international communication companies. The project of
establishing the SMW “South Asia Middle East West Europe” (Capacity of 24 TB
per second, 20,000 km long and connects 17 countries).
Connectivity
→ stc is currently preparing to engage in a new project (Africa1 cable), which
connects a number of African countries, with capacity of 36 TB per second and
connect more than 12 countries in Africa and Europe through the Kingdom.
18Investor Presentation 2021 | stc group
Largest telecom operator in the MENA
region
→ Market cap of SAR 254 bn (USD 67.63 bn), and
presence in 4 countries (as of 31-March-
2021).
Experienced best-in-class management
team
Strong financial performance
→ Management team has significant
experience across telecom products & → Consistent growth in EBITDA Margin (14%
markets and has a proven track record of 1 since 2016).
delivery. 8 2
Extensive & developed Strong Government links and strategic
telecommunications infrastructure importance
→ Largest fixed line network in Saudi Arabia. 7 3 → 70% government ownership; national flagship
company; significant contributor to non-oil
Key Credit Strengths
→ Comprehensive cross-border network
serving all operators in MENA. GDP and employment.
→ Regional pioneer in 5G & FTTH deployment.
6 4
Strong balance sheet and Healthy Cash
Sound business and growth strategy 5 Flow
→ Given its strong financial position, stc is able → Well placed to gain access to efficient,
to swiftly capitalize on growth opportunities substantial levels of debt to fund future
via organic and inorganic growth. investments if needed.
Market leadership in Saudi Arabia (the
largest market in the region)
→ 73% market share by revenue, as of 31-Dec-
20.
19Investor Presentation 2021 | stc group
HRH. Prince Mohammed Khalid ALFaisal Ms. Rania Mahmoud Nashar
Chairman of the Board Board Member
H.E. Dr. Khaled Hussain Biyari Mr. Arndt Rautenberg
Board Vice Chairman Board Member
Diverse Board of Directors
H.E. Mohammed Talal Al-Nahhas Ms. Sara Jammaz AlSuhaimi
Board Member Board Member
Mr. Ahmed Mohammed Al-Omran Mr. Sanjay Kapoor
Board Member Board Member
Mr. Jameel Abdullah AlMulhem Mr. Waleed Ibrahim Shukri
Board Member Board Member
Mr. Yazeed Abdulrahman AlHumied Eng. Olayan Mohammed Alwetaid
Board Member Chief Executive Officer (CEO)
20Investor Presentation 2021 | stc group
Share Performance Vs. Telecom & TASI Index Market Capitalization of Telecom Sector As of
31st March 2021
→ stc maintained its momentum and outperformed the telecom sector
and TASI Index.
0.31% 4.64%
24% 7.83%
20% 19.6% YTD
16% 15.3% YTD
15.0% YTD
12%
8%
4%
0%
-4%
Market Performance
87.23%
TASI Telecom stc stc Mobile Zain Atheeb
Key Metrics
Market Cap % Price/
Closing price Issued Shares (Mn) Market Cap Price/ Book Dividend Yield
Tadawul Earnings
126.8 2,000 253.60 2.6% 21.42x 3.90x 3.15%
31st March 2021
21Investor Presentation 2021 | stc group
Ownership Structure As of 31st March 2021 Market Capitalization As of 31st March 2021 Among Major
Saudi Listed Companies (SAR Bn)
Foreign
Ownership
352.2
5.59%
253.6 247.0
24.41% 237.8
97.9
70%
67.3 66.6
54.1 52.0
Public Investment Fund (PIF) Free Float Shares SABIC STC Al Rajhi SNB Saudi Riyad Maaden SABB Al Marai
Market Performance
Electric Bank
Price Vs. Yield Fluctuation MSCI Tadawul 30 Index
136 4.00% Float Adj Mkt Cap
Company Index Wt. (%)
(USD bn)
128
120
AL RAJHI BANKING & INV 32.27 14.76
112 3.20% SAUDI BASIC IND CORP 28.17 12.88
104 Saudi Aramco 21.12 9.66
96 NATIONAL COMM BANK 20.81 9.52
88 2.40% Saudi Telecom Co 20.29 9.28
As of 31st March 2021
Price Div yeild
22Investor Presentation 2021 | stc group
2010 2016
→ Advertiser Excellence in the Middle East and North Africa by Dubai Linux. → Multiple creativity awards on outstanding work on the Rayi7 Rayi7, Dawri Plus, and Laywagif
→ Operational Excellence Award at the Global Forum for Communications TM Forum campaigns by Dubai Lynx.
Management World. → Mega contact centers and “social media services” awards.
→ Transparency Award for Saudi Stock Companies by BMG Financial Consultations Firm. → Middle East Grand Prix at the Lorez Award Ceremony.
→ Gold medal for “contact center” award and the silver medal for “Best use of Social Media in
2011 the Contact Center” award during Contact Center World Summit.
→ Customer Care Excellence Award by Middle East Excellence Awards Institute. → Two awards for being the leader in the telecommunication industry by Effie Worldwide.
→ Cisco Most innovation Data Center Project awards by Cisco International.
→ Leadership Award for pioneer Role in Telecom Industry at TMT Conference Middle East. 2017
→ Best operator of mobile phone services at TMT Conference. → 7 awards (1 Grand Prix, 2 silver, 4 bronze) on creativity portrayed in advertising campaigns by
→ International Award for Development, Experience Transfer, and Innovation at TMT Dubai Lynx International Festival of Creativity.
Conference Middle East. → Makkah excellence award for its strategic partnership.
→ Excellence Award in Corporate Governance at the 2nd Annual Corporate Governance
2012 Conference by Alfaisal University.
→ Distinctive award for Employment Nationalization.
→ Mobile Operator of the Year by TMT Finance. 2018
→ Best iPhone app. → SPEEDTEST award for the fastest mobile internet in the Kingdom.
→ Best Mobile Service Provider in the fourth annual poll by Mobile Trend. → Golden Award for Mystc Campaign for the Effective Integration of the Channels
→ Mid East Media Reach-Out Award by Datamatix International. Partnerships by the WARC Media Awards.
→ The Best Provider of Telecom Services to Airports in Emerging Markets by Arabian Reach. → Silver Award for the "Unveil Saudi" campaign for the Effective Use of Partnerships by the
→ Distinction Award for Information Security Control and Operating Project for the entire WARC Media Awards.
region by Symantec. → Pioneer Marketing Award as Best Advertising Campaign for Digital Day.
2013 2019
→ Customer Services Excellence Award by Global Telecom Business. → 6 Awards at Dubai Lynx 2019 Festival.
→ MENA performance excellence and telecom service delivery Award by COMMSMEA → King Salman honored stc for supporting the Founder’s Equestrian Cup Festival.
magazine → stc Academy won the Silver award in Technology by the Global Council of Corporate
→ World-renowned ISO Certification for effectively handling customer complaints in call Universities (GCCU).
centers by Lloyd’s Register Quality Assurance (LRQA). → 4 Awards by Effie Worldwide as a leader in the telecommunication industry.
Wining Awards
→ Procurement wins EIPM Award. → Won Makkah excellence award for its strategic partnership.
→ Golden Award for “Mystc campaign” and with the Silver Award for “Unveil Saudi”.
2014 → Won the Excellence Award in Corporate Governance by Al Faisal University.
→ 4 Mena Cristal awards for its print and outdoor Roaming campaigns by Mena Cristal event. → Won the Speedtest award for the fastest mobile internet in the Kingdom.
→ Won the Speedtest award for the best mobile coverage.
2015
→ Obtains OKAZ and EFFIE awards. 2020
→ Best wholesale operator for data and voice services in the MENA region by Telecoms → wins the best apply of Customer Experience Management program Award 2020.
World Middle East. → First company headquartered in Saudi to be accredited by CREST for penetration testing
services.
→ Won the best mobile coverage award by Speedtest.
→ Won the fastest 5G and mobile network award by Speedtest.
23Strategy Overview
Investor Presentation 2021 | stc group

                           Our vision                                                                  Our purpose
                           We are a world-class digital leader providing                               We create and bring greater dimension and
                           innovative services and platforms to our                                    richness to people’s personal and professional
                           customers     and     enabling    the  digital                              lives.
                           transformation of the MENA region.

                                         drive                                                            Proactive, Inquisitive and
                                                                                                          Inventive

                                         devotion                                                         Caring, Committed and
Our vision & values

                                                                                                          Trustworthy

                                         dynamism                                                         Agile, Collaborative and
                                                                                                          Fresh

                           Our values form the basis of our culture. We foster trust, in a collaborative and constructive environment where innovation is
                           encouraged, and people have the freedom and support to turn ideas into achievement. We build strong supportive
                           relationships and knowledge transfer among employees and stakeholders. We recognize that a diverse and inclusive
                           workplace sparks innovation and creativity, which makes our offerings to our customers more competitive and appealing.
                      25
Investor Presentation 2021 | stc group
→ Our DARE strategy aims to strengthen our position as a leading telecom and ICT company.
→ The key focus areas and strategic ambitions to guide us in pursuing our purpose are:
digitize stc accelerate performance
→ Maximize shareholder returns by transforming costs and
→ Instill digital mindset and unlock the potential of
monetizing assets.
digital and analytics capabilities.
→ Connect our market through leading next-gen technology
→ Transform into an agile technology company and
Our Strategy for Success
and digital offerings.
embrace new ways of working.
→ Be a role model for sustainability and corporate governance.
→ Lead company-wide culture change and be the employer of
choice for top digital talent.
dare
reinvent experience expand scale and scope
→ Excite customers with a seamless, personalized and → Grow by expanding into selected growth pillars. within
secure experience. digital services and core.
→ Be the trusted partner-of-choice for business in the
region.
26Business Overview
Investor Presentation 2021 | stc group
Sales & distribution arm of stc group and one of the largest telecom Arab Satellite Offers number of services: regional telephony,
Channels by stc 100% distribution companies in the Middle East, with operations in Saudi Arabia, Communications 36.6% television broadcasting, regional radio
Bahrain and Oman. Organization broadcasting, restoration services…etc.
Companies
Associate
Providing the business, governmental, industrial & commercial sectors with Virgin Mobile
Specialized by
100% services and solutions addressing instant collective wireless 10% A mobile virtual network operator.
stc communications.
KSA
stc through one of its subsidiaries (stc
Responsible for owning, constructing, operating, leasing and investing in stc Oger Telecom
Tawal 100% 35% Turkey Holding Ltd) acquired a stake in
KSA towers. Limited OTL.
Local Subsidiaries
Subsidiaries & Global Presence
A leading regional ICT player who provides a wide range of information and
Solutions by stc 100% communications technology & services beyond the traditional telco
offerings.
Constructing, leasing, managing and
Develop & manage the company’s properties in all parts of the Kingdom by Arab Submarine 50% operating a submarine cable connecting
Aqalat 100%
Joint Ventures
adopting the concept of smart developments. the Kingdom and the Republic of Sudan.
A digital secure wallet that empowers individuals to take full control of their
Contact Center Provide call center services and answer
stc pay 49%
100% finances at their fingertips anytime anywhere. (CCC) directory queries with Aegis Company.
Telecom An investment holding group registered in
Operation and maintenance of telecommunications networks, business Binariang GSM
Commercial 100% 25% Malaysia which owns 62% of Maxis
systems and computer and Internet networks. Holding (BGSM) Malaysian Holding Group (“Maxis”).
Investment Co Ltd
Advanced
Technology and 100% Established in the fourth quarter of 2020, with a capital of SAR 120 million to
Cybersecurity provide cybersecurity services.
The company offers mobile, international telecommunications, broadband
stc Bahrain 100% and other related services.
International
Subsidiaries
The company offers mobile, international telecommunications, broadband
stc Kuwait 51.8% and other related services.
Invests in companies operating in Malaysia and owns investments in stc
stc Asia 100% Malaysia Holding LTD in which it holds a 25% stake in the Binariang GSM
Holding Group.
stc Gulf A private company whose operations provide services and support to the
100% Group’s investment activities. The company headquarter is in Bahrain.
Investment
28Investor Presentation 2021 | stc group
Subsidiary Overview Solutions Offered
Date of Built-to-Suit
→ Founded in 2018
Incorporation Selects an optimum spot and constructs wireless
communication towers, tailor-made to match the
Invested Capital → SAR 2.5 billion
business’ needs.
→ To be responsible for owning, constructing,
operating, leasing and investing in the towers.
Subsidiary
→ Establishing itself as the leading player in the Colocation
Objective Saudi telecommunications infrastructure Engage in sharing passive infrastructure through
market, aspiring to extend its services and colocating on our towers to densify the network.
coverage across the region.
stc Ownership → 100%
KSA First Tower Co.
Subsidiary → In Q1 2019, stc Towers Co. obtained the
Operation necessary operational licenses (CITC).
In-Building Solution
Providing In-Building-Solution “IBS” to boost superior
→ TAWAL now owns a portfolio of more than
internal coverage with cutting-edge technologies.
15,000 telecom towers spread across the
Kingdom.
Tower Portfolio
→ 70% of TAWAL’s sites are ground-based
towers, the rest are rooftops. O&M as a Service
Offering operations and maintenance services,
→ In Feb 2020, the CITC announced a new open including preventive maintenance, fault management,
Infrastructure energy management and other services.
access regulation allowing infrastructure
Sharing sharing between operators.
29Investor Presentation 2021 | stc group
Subsidiary Overview Services Offered
Date of
→ Founded in 2002
Incorporation IoT Digital Services
System Integration
Invested Capital → SAR 1.2 billion
→ One of the major names in the field of
technical solutions, and biggest suppliers in Connectivity Services Cloud Services
the kingdom.
→ To enable digital transformation to support
government and private sector goals;
spreading the benefits of ICT services to Business Outsourcing Cybersecurity Integration
Subsidiary
bring down the cost of progress and speed up
Objective the journey into the future.
→ Through an extensive partner ecosystem, the Managed Services
subsidiary aim to deliver the most advanced
end-to-end solutions, and managed services,
for compute, storage and network, software
and hardware.
Our ICT Arm
stc Ownership → 100%
→ In Oct. 2020, solutions by stc have officially
announced its potential IPO.
Subsidiary IPO
→ The IPO is expected to take place either in Q2
or Q3 of 2021 as the Group will maintain the
majority stake of the business.
30Investor Presentation 2021 | stc group
Subsidiary Overview Offered Services
Date of
→ Founded in 2018
Incorporation
Invested Capital → SAR 948 million
→ stcPay is a digital secure wallet that
empowers individuals to take full control of
their finances at their fingertips anytime
anywhere. Enabling users to send, receive,
Subsidiary
spend, and manage money simply through
Objective their phone.
→ the first fintech arm that was authorized by
the Saudi Monetary Authority (SAMA).
stc Ownership → 100%
Our Fintech Arm
Registered Users → 4.9 million (as of Dec. 2020)
→ In Nov. 2020, stc have signed an agreement
with Western Union to sell an equity stake of
15% with a value of SAR 750 million (USD 200
Partners million).
→ The transaction is expected to be completed
during 2021.
→ The company extended its operations to be
Business present in Bahrain in which Bahrain Channels
Operations supporting stcpay in expanding their partners
and point of sales, presence and coverage.
31Investor Presentation 2021 | stc group
Subsidiary Overview
Date of Incorporation → Founded in 2008 266 46,000 +
Stores Merchants
Invested Capital → SAR 100 million
→ Considered as the sales and distribution arm of stc Group. 122 + 57,000 +
Distribution Hubs POS
→ stc Channels is the leading and one of the largest telecom
distribution companies in the Middle East with operations in
Saudi Arabia, Bahrain and Oman. 3,200 +
10 Mn+ Customers
Agents
Subsidiary Objective → The company is a wholesaler and retailer of smart card
services, communication equipment and computer services,
selling and reselling of all fixed and mobile
telecommunications services and maintenance and operation
of commercial complexes.
→ The company’s head office is located in Saudi Arabia.
Our Sales Arm
stc Ownership → 100%
→ Reduced number of branches and distribution centers by 38%
in the last 3 years.
→ Increased the number of self-service machines which
reflected a growth in the number of transactions by 380% in
Optimization Plan only two years.
→ Digitized inventory management by using a digital order
management system.
→ Launched digital platforms to boost online sales: MyStore,
Mystc, electronic recharging…etc.
32Investor Presentation 2021 | stc group
Subsidiary Overview Services Offered
Date of TETRA Services
→ Founded in 2002
Incorporation
Invested Capital → SAR 252 million
Mobile Telephony
→ The only national licensed operator providing
the business sector, and the governmental,
Subsidiary
industrial and commercial sectors with
Objective services and solutions addressing instant Location-Based Services
collective wireless communications.
stc Ownership → 100% Alert Service
Messaging Services
Specialized by stc
Inmarsat
Control Room Solutions
33Investor Presentation 2021 | stc group
Subsidiary Overview
Date of Incorporation → Founded in 2013
Invested Capital → SAR 70 million
→ To develop and manage the company’s properties in all
parts of the Kingdom by benefiting from the capabilities
Subsidiary Objective of the Group and its applications by adopting the
concept of smart development that is based on
integrating technology in all projects and investments.
stc Ownership → 100%
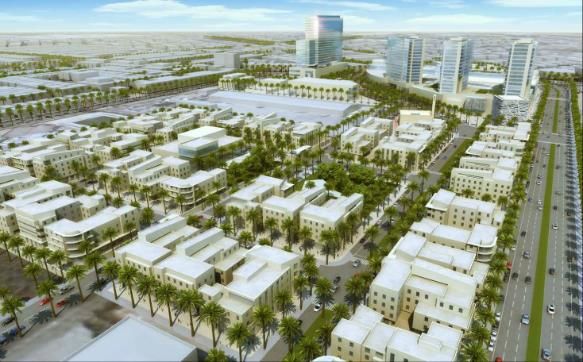
Riyadh Project
Riyadh Project (Smart Square)*
The project is located in the heart of Riyadh City in Al-
Mursalat district, sitting on a 140,000 m2 land. In this project,
AQALAT aspires to achieve its vision of future projects by
enabling Smart Cities concepts. It is a mixed-use project
that include residential, offices and commercial units.
Projects Under
Management Dammam Project (Smart Boulevard)
The project is located in the southern part of the
communications complex in Al-Rayan district, in the heart
of Dammam City situated on a land of 380,000 m2. The
project is a mixed-use project with the commercial part
AQALAT
being the project’s main concept. AQALAT aim this project
to achieve its vision by enabling Smart Cities applications. Dammam Project
*During the fourth quarter of 2019, the Company established a special purpose vehicle (SPV) subsidiary (Smart Zone Real Estate
Company) in the kingdom with a share capital of approximately SR 107 million and its main activity is the development, financing
and management of real estate projects, the establishment of facilities, complexes, commercial, office and residential
buildings.
34Investor Presentation 2021 | stc group
STV is an independent VC fund with a total capital of USD 500 anchored by stc with access to its assets (e.g., network,
channels, analytics, customer base…etc.)
Saudi Technology Ventures (VC Fund)
→ Leading a SAR 78.75 million (USD $21 million) investment round in unifonic.
→ 150+ Countries, 720+ Operators.
→ Vezeeta has managed 3 million bookings in the region.
→ Served 2.5 million consumers/patients.
→ Connected more than 10,000 doctors in Egypt, Saudi Arabia and Jordan.
→ Leading an investment round of SAR 33.75 million to accelerate the company’s growth and
scale-up plans.
→ A multimillion-dollar investment in Mrsool.
→ The leading Saudi on-demand delivery service.
→ USD $270 million in transactions in 2018.
→ 4 million registered users.
→ A Co-leading SAR 32.2 million investment in noon Academy.
→ noon Academy is the leading EdTech platform in the Mena Region.
→ Brings innovation to trucking with On-Demand aggregation in Real-Time.
→ 100% automated booking, real-time tracking of trucks, smart asset utilization, & cost
efficiency.
→ Delivers full screen, engaging media and measurement on rideshare vehicles and taxis.
→ Creating a significant new ad format at scale. The scale of rideshare networks has created a
large opportunity to provide digital out of home advertising with granular city-block and time
targeting.
35Sustainability at stc
Investor Presentation 2021 | stc group
Our approach to sustainability involves maximizing economic value, creating positive environmental impact and supporting progressive social
development. By aligning our actions with the goals of the Saudi Vision 2030, we are helping to build a better future. We believe the steps we
have taken to date are already catalyzing digital transformation in KSA.
01 Doing business with integrity 02 Enhancing economic impacts 03 Enriching lives and experiences
One of the first companies in KSA to 50% of procurement spending 100% of employees have completed
implement corporate governance towards locally registered suppliers iGate training on issues regarding
throughout the management structure as privacy, data protection and
early as 2004 SR 54,368 million in revenues (2019)- cybersecurity
the highest annual revenue since 2013
300+ employees attended anticorruption One of the best complaints to
training and awareness sessions Through Rawafed, provided support subscriber ratio in the world – 0.17%
to SMEs to the value of SAR 4 billion by Dec 2019
Partnered with the World Economic in 2019, equal to one-third of total
Forum – Partnering Against Corruption support given to local suppliers SAR 2.5 billion in community
Initiative (PACI) forum to adopt global investments, through direct
principles for countering corruption contributions
Sustainability at stc
04 Expanding access to 05 Advancing innovative digital 06 Empowering people 07 Caring for the environment
technology and connectivity opportunities
18% decrease in direct energy
Recorded 62 mbps mobile Through InspireU, incubated 28 2.1% turnover rate
consumption from buildings and
download speed in KSA by startups that support ICT/ fleet
December 2019 digital innovation Hiring of female employees
reached 528, starting from 0
50% reduction in paper
We have the largest First operator in KSA to launch in 2015
consumption compared to 2018
broadband network in KSA, 5G commercial services
complemented by significant 288,462 total hours of
Joined the global movement of
fiber optic and 5G network employee training
leading companies aligning their
business with the Paris
Agreement to reach net zero
emissions by no later than 2050
6 *For further details, please refer to the sustainability report at stc website or click here
37Financial Highlights
Investor Presentation 2021 | stc group
Revenue EBITDA
12.6%
9.6% The Group achieved an outstanding
3.1% performance during the first quarter
3.7%
of 2021.
15.70
6.0 65%
15.22 5.8
60%
14.92 14.88 5.6
5.79 5.84
55%
The company was able to grow its
13.93 5.4
5.63 top line by 12.6% which was
supported by:
50%
5.2
5.33 5.34 45%
5.0
→ Increase in Consumer Business
40%
4.8
38.2% 38.9% Unit revenues due to the growth in
35%
37.0% 37.2%
4.6
35.8%
the Broadband & Fixed Wireless
30%
4.4
Access subscriber base by 10.1%,
25%
4.2
4.0 20%
FTTH by 26%, working lines by 3.1%
Quarterly Performance
Q1-20 Q2-20 Q3-20 Q4-20 Q1-21 Q1-20 Q2-20 Q3-20 Q4-20 Q1-21
and data revenue by 4.5%.
EBITDA Margin
→ Enterprise Business Unit
Operating Profit Net Profit revenues grew by 33.4%, as a
1.4%
result of the increased demand for
15.9% the company's services & products
13.9% along with its ability to swiftly
8.6%
respond to customers’ request
4.50
3 22 %
29%
2.91
2.95 and demand in a competitive
4.00 3
3.46 3.48 21%
3.21
27 %
3.06 manner.
3
3.50
3.00 20.9%
2.77
20%
3
3.00 25%
3
2.72
→ Wholesale Business Unit
2.50 19%
23%
3
2.59
23.2% 18.8% managed to increase its revenues
2.00
18.6%
18%
22.2%
21%
2
21.6% 18.3%
21.1% by 5.1%.
1.50
20.5%
2
17%
19%
1.00
17.0%
2
→ Revenues generated by stc’s
17% 16%
0.50
2
0.00 15%
2 15%
subsidiaries grew by 23.2%, which
Q1-20 Q2-20 Q3-20 Q4-20 Q1-21 Q1-20 Q2-20 Q3-20 Q4-20 Q1-21 contributed positively to the
Operating Margin
Net Profit Margin group's overall results.
Numbers are in SAR Billions
39Investor Presentation 2021 | stc group
Revenue Segmentation Geographical Segmentation
7%
15.70 SAR
Revenue Development
15.70
12.6% 93%
Domestic Revenue International Revenue
*Other operating segments include: stc Kuwait, stc Bahrain, Solutions by stc, Specialized by stc, stc Gulf, Aqalat, Tawal,
stcpay and advanced technology and cybersecurity Company .
Numbers are in SAR Billions
40Investor Presentation 2021 | stc group
Revenue EBITDA
+2.3% +4.1%
58.95
22.09
21.26
19.84
18.43
5-Year Historical Performance
18.03
54.37
52.67
51.96
50.66
2016 2017 2018 2019 2020 2016 2017 2018 2019 2020
Operating Profit Net Profit
+5.1% +4.3%
12.48 12.73 10.78 10.99
12.25 10.66
10.02
10.99
8.90
9.95
2016 2017 2018 2019 2020 2016 2017 2018 2019 2020
Numbers are in SAR Billions
41Investor Presentation 2021 | stc group
SAR billion Mar. 2021 Dec. 2020
Total cash 6.84 9.00
Total assets 124.46 121.97
Total liabilities 58.20 56.71
Total equity 65.07 63.95
Total debt 8.84 8.96
Net Debt 1.99 -0.05
Solid Balance Sheet
Debt/ Equity 13.58% 14.01%
Debt/ Assets 7.10% 7.34%
Working capital 13.73 12.97
→ The newly established international sukuk program was approved at the General Assembly meeting on 24th April 2019. This program is
denominated in US Dollars not exceeding the amount of USD 5,000 million. During the second quarter 2019, stc Sukuk Company Ltd.
(SPV established for the purpose of issuing sukuk), completed the first sukuk issuance under the Sukuk Program for USD 1,250 million
(equivalent to SR 4,688), at USD 200 thousand par value, annual yield of 3.89% and a maturity of ten years.
→ stc group is considered one of the lowest leveraged telecom companies in the world (Debt/ EBITDA 0.38x) creating a debt capacity for
the company that might be utilized for financing new projects/ acquisitions.
42Investor Presentation 2021 | stc group
Total Capital Expenditure (Capex) CFO/ Capex Ratio
12 25% 30 3.00
2.61 → In Q4, 2018 stc had a
10 20% 25 2.40 financial dispute with
2.01 1.96
8
20.91%
20
the Regulator entailing
18.78% 18.39% 15% 1.80 the reversion of
6 15.67% 15 provisions on quarterly
10% 0.87 1.20
4 10 basis for 3 years (ending
5% 0.60
in 2020) subject to
2 5
meeting certain KPIs of
Capital Expenditure Trend
7.94 9.76 11.37 10.84 15.92 19.13 9.92 28.32
0 0% 0 0.00 Capex requirement.
2017 2018 2019 2020 2017 2018 2019 2020
CFO CFO/Capex Ratio → The investment is mainly
Capex Capex/ Revenue
focused on the
infrastructure of the
Free Cash-Flow (EBITDA-Capex) Capex/ Depreciation & Amortization Ratio country for example
increasing the speed of
4G, 5G rollout, Wi-Fi
1.29 1.29 spots, spreading the
11.25
1.16 fiber and increasing its
1.07 speed…etc.
10.49
→ The government
10.08
9.90 provisions came to an
end. Therefore, Capex
levels will experience a
decline going forward.
2017 2018 2019 2020 2017 2018 2019 2020
43Investor Presentation 2021 | stc group
Performance Ratios Free Cash Flow Trend
18.15% 19.17
17.27% 17.19%
15.93% 16.45%
9.86% 10.77 10.73
9.23% 9.01% 9.01% 9.49% 9.34
0.49
2016 2017 2018 2019 2020
2017 2018 2019 2020 Mar-21 → Highest FCF achieved in 5 years and on a challenging year.
ROA ROE
→ The sharp decline in FCF in 2019 is mainly due to the sudden
Leverage Level increase in both receivables and payables.
Financial Highlight
9.31
→ stc aims to generate higher cash flow in the coming years.
8.96 80%
9 8.84
70%
43.79% 60%
40.54%
6 37.81% 50%
4.65 40%
4.29
25.25% 15.08% 13.99% 13.58% 30%
3 21.61%
7.40% 6.54% 20%
7.87% 10%
7.31% 7.10%
4.29% 3.92%
0 0%
2017 2018 2019 2020 Mar.2021
Long-Term Debt Short-Term Debt Debt/ Assets
Debt/ Equity Debt/ EBITDA
44Investor Presentation 2021 | stc group
P/E Multiple for Q1 Quarterly EPS and Payouts
79.84% 74.21% *
P/E At 126.8 (Max)* 21.42 13 75.05% 72.20% **
90%
12
67.57%
11
10 10.99
P/E At 106 (Min)** 17.91 9 10.02
10.78 10.66
60%
8
7
P/E at closing price of Q1 (126.8) 21.42 6
5
4 30%
*As of 31/3/2021 2.95
3
** As of 3/1/2021 2 5.83% 6.54% 3.93% 3.77% 3.15%
1
0 0%
2017 2018 2019 2020 Mar.2021
Net Income Dividend Yeild Payout Ratio
*Payout ratio taking into account the special dividend paid in 2018: 111.32%
** Payout ratio taking into account the special dividend paid in 2020: 92.25%
Financial Highlight
1.48
1.46
1.38
1.36
1.30
Q1-20 Q2-20 Q3-20 Q4-20 Q1-21
45Investor Presentation 2021 | stc group
Item International Sukuk Program Domestic Sukuk Program
Issuing Type International Sukuk (senior, unsecured sukuk) Domestic Sukuk
Currency USD denominated SAR denominated
Program Amount USD 5 Bn SAR 5 Bn
→ To support the execution of the company’s strategy,
Sukuk Programs Issued by stc
future plans and diversify the sources of funding; → To support the execution of the company’s strategy,
Issuing Objective → To benefit from the features of international debt future plans and diversify the sources of funding.
capital market in terms of liquidity, competitive
pricing and diversification of investors’ base.
Minimum Settlement USD 200,000 SAR 1,000,000
Price at Maturity At Par At Par
Trading Market Irish Stock Exchange plc trading as “Euronext Dublin” private placement
Issuing Date 13th May 2019 9th June 2014
1st Tranche Amount USD 1.250 bn SAR 2 bn
Number of Sukuk Issued 6,250 sak 2,000 sak
Subscription Coverage 3.5x 2x
Tenor 10 years (13th May 2029) 10 years (9th June 2024)
Coupon Rate 3.89% (Valued at Mid Swap of 2.54%+135 bps) 3M SAIBOR + 70 bps
Payment Frequency Simi annual (first payment on 13th Nov 2019) Quarterly
HSBC, JPMorgan, Standard Chartered, Samba Capital, J.P. Morgan Saudi Arabia Limited, NCB Capital Company
Arrangers
First Abu Dhabi Bank, and KFH Capital and Standard Chartered Capital Saudi Arabia
Rating Moody’s (A1), S&P (A-) N/A
46Investor Presentation 2021 | stc group
Dividends distribution policy
→ In Q4 2018, the company announced that it has approved its dividend policy
for the next three years starting from the 4th quarter 2018 (as approved by
the board of directors);
→ The objective of the dividend policy is to maintain a minimum level of
dividend per share on quarterly basis. stc commits to pay a fixed minimum
dividend of a SAR 1 per share per quarter;
→ The company may consider paying additional dividends subject to the
Board approval after assessment and determination of the Company's
financial situation, outlook and capital expenditure requirements;
Stable Dividends Distribution
→ Additional dividends are likely to vary on quarterly basis depending on the
company’s performance;
→ Based on the policy the last dividend to be paid is in Q3, 2021.
Stability of dividends distributions
→ Over the last six years, stc distributed a total of SAR 54 billion to investors
through a stable dividend distribution in each quarter (SAR 1/share) which
indicates a healthy cash flow supported by a strong and stable
performance.
27
22 5
18 4 22
6 18
12
8 4 12
4 8
4 4
2015 2016 2017 2018 2019 2020
Incremental Dividends/ share
Numbers are in SAR/ share
47Let`s create the future together Disclaimer This presentation has been prepared as an informative guide that might assist interested parties in gaining an insight into the history and background of telecommunications within Saudi Arabia, as they relate to the Saudi Telecom Company (stc). Furthermore, it does not constitute an invitation or inducement to purchase or dispose of any securities, either in stc, or any companies in which stc has a financial interest. In addition, there may also be ‘forward looking’ statements included within the meaning of current securities laws and regulations. In this context, any opinions expressed within this document, regarding the company’s potential future performance, should be viewed as being accurate at the time of preparation. However, cognizance should be taken of the fact that uncertainty may dictate that actual performance differs substantially from any views articulated herein. Investor Relations E-mail: IRU@stc.com.sa Investors Website: https://www.stc.com.sa/wps/wcm/connect/english/investor/overview IR App QR Code:
You can also read