Auckland's economic recovery and council's role - Context to support the development of Auckland Council's Economic Development Action Plan - Item ...
←
→
Page content transcription
If your browser does not render page correctly, please read the page content below
March
                                                 2021

Auckland’s economic recovery and
council’s role
Context to support the development of Auckland
Council’s Economic Development Action Plan

David Norman, Chief Economist
Table of contents
Summary ...................................................................................................................................................... 2
Auckland’s pre-COVID-19 economy: a decade of growth ............................................................................. 3
The impacts of COVID-19 on Auckland’s economy ...................................................................................... 6
Roadblocks to recovery ................................................................................................................................ 9
Economic development levers the Group has............................................................................................. 13

Disclaimer
These views are provided by the Chief Economist Unit in its independent capacity. They do not necessarily reflect the
views of all Council staff or elected officials.

                                                                               1
Summary
•   COVID-19 interrupted a period of strong               exacerbates the wealth gap between those who
    economic growth for Auckland, but impacts             own property and those who don’t. This gap
    have been smaller than first anticipated.             restricts economic mobility and at its extreme, can
•   Roadblocks to economic recovery remain.               lead to a break down in the social contract.
    The Auckland Council Group (“the Group”)
                                                          Roadblocks to recovery are aplenty
    has control or influence over some of these.
•   But financial constraints limit new funding           Recovery over the next two to three years may be
    available to spend on recovery.                       hampered by several roadblocks. Wealth
•   Instead, we need to support recovery by               inequality is one. Some are beyond the influence
    aligning business as usual activities that            of the Auckland Council Group. We don’t control
    together improve specific outcomes.                   new outbreaks and vaccine rollout and uptake
•   This report highlights levers the Group has to        that may keep borders closed. We don’t control
    aid economic recovery and asks how existing           economic weakness in our trading partners or
    activities can better support recovery.               geopolitical tensions that may hamper trade.
                                                          Risks where we may play a meaningful role
A decade of growth
                                                          include overcoming town and city centre
Auckland is the powerhouse of the New Zealand             economic weakness, reducing congestion and
economy, with close to 40% of national GDP, and           improving supply chains, overcoming skills
over 900,000 workers. Over the decade to early            shortages, and making every dollar we spend
2020, economic growth has been driven by strong           count in recovery terms.
population growth, with the construction and
business services sectors leading.                        The Group has several levers to pull
Larger businesses accounted for the bulk in               The Group provides literally hundreds of functions
employment growth, as unemployment fell to its            and services, but the vast bulk are not explicitly
lowest level in a decade.                                 economic development activities. That does not
                                                          imply that they are not valuable activities, just that
Disparities across sub-populations remained,
                                                          they do not primarily aim to improve key
however, in terms of unemployment rates and a
                                                          economic indicators beyond the Group.
widening wealth gap as house prices surged,
particularly between 2011 and 2016.                       The Group also faces unprecedented financial
                                                          constraints, limiting new spending. But the Group
The pandemic’s immediate impacts                          has several existing levers it can pull to aid
Closed borders and two lockdowns in Auckland              economic recovery. These are typically not single
designed to protect against the loss of life led to       activities, but groups of activities that together can
more than 20,000 job losses in Auckland.                  target certain outcomes. This report poses
Jobseeker data suggests unemployment is above             questions under each identified lever to help the
the official estimate, probably around 6.2%               Group think through how we can adjust business
compared with 4% pre-pandemic.                            as usual activities to aid economic recovery.

Yet New Zealand and Auckland both showed                  Levers include enablers (how we use our assets
remarkable resilience. Every major indicator has          and procurement, regulatory powers, transport
turned out “less bad” than anticipated by the main        networks and so on), those that incentivise
economic commentators in April and May 2020.              efficient choices by the private sector (taxes and
                                                          fees, investment in town and city centres, skills
Most extreme among these surprising outcomes              and tourism attraction), and those that coordinate
has been the surge in house prices. This implies          and support (such as social services and
market confidence (a good thing), but also
                                                          coordination with non-Council stakeholders).
                                                      2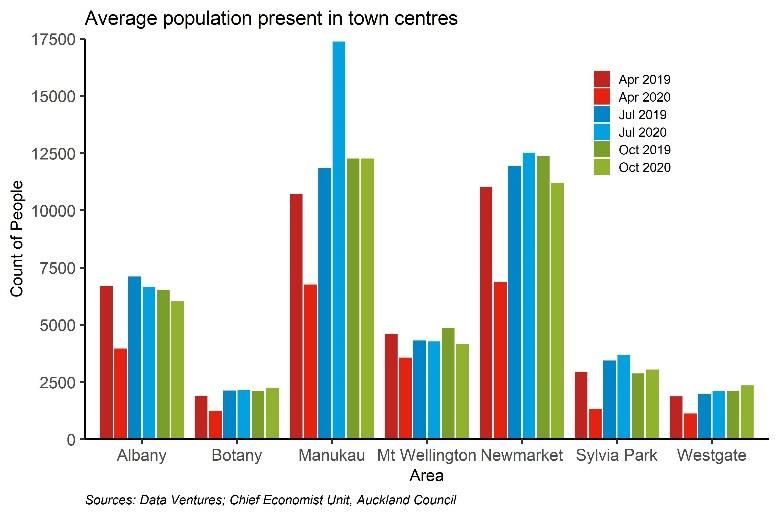
Auckland’s pre-COVID-19 economy: a decade of growth
•   Auckland is New Zealand’s largest economy,           Construction contributed the largest share of
    led by strong and growing professional               Auckland’s total employment growth over the last
    services and construction sectors.                   10 years, becoming the region’s second largest
•   The region’s average business size is similar        sector (95,800 jobs). Although Manufacturing is
    to that of New Zealand, with the vast majority       the third largest sector in Auckland (82,000 jobs),
    of businesses being sole trader, but                 its growth was modest. Most of its increase was in
    businesses with over 50 employees providing          South Auckland.
    half of all regional jobs and most growth.           The isthmus contributed 42% of Auckland’s
•   Just prior to the COVID-19 pandemic, the             employment growth over the last 10 years. Almost
    region had the lowest unemployment in a              a quarter of the region’s jobs growth occurred
    decade, but disparities remained, particularly       across the southern local board areas of
    among youth, Māori, Pacific and in the south.        Māngere-Ōtāhuhu, Ōtara-Papatoetoe, Manurewa,
•   Productivity growth over the decade was              Papakura and Franklin.
    moderate; a strong relationship exists
    between GDP growth and population growth,            Despite the rhetoric, larger businesses
    led by international migration.                      drive employment growth
•   Strong population growth, an insufficient
                                                         As at February 2020, Auckland had more than
    supply response, and low interest rates
                                                         206,000 businesses. Of these, 147,600 had no
    among other factors led to a housing boom
                                                         salaried (or waged) employees, and most of the
    that widened wealth inequalities.
                                                         rest had employee counts below 20. Fewer than
Auckland powerhouse driven by                            one in 15 (6.5%) had 20 or more employees. This
                                                         pattern is broadly similar to New Zealand.
business services and construction
                                                         In terms of who employs workers, however, and
Auckland constitutes almost 40% of New
                                                         assuming zero-employee businesses have
Zealand’s economy. In the year ended March
                                                         somebody self-employed, the pattern is starkly
2020, Auckland’s GDP exceeded $114 billion (in
                                                         different. Large businesses of 50+ employees
2019 dollars) and the region provided a total of
                                                         provide half of all employment in Auckland, and
911,370 jobs. GDP grew 37%, and employment
                                                         more than half (56.0%) of the net employment
29%, in the last 10 years.
                                                         growth from 2010 to 2020.
The largest sector in Auckland is Professional,
                                                         Small businesses of fewer than 20 employees
Scientific and Technical Services, with 109,600
                                                         provided a little over a third of total employment,
jobs. Approximately one third of employment in
                                                         and a third of net employment growth.
this sector is in Auckland’s city centre.

                                                     3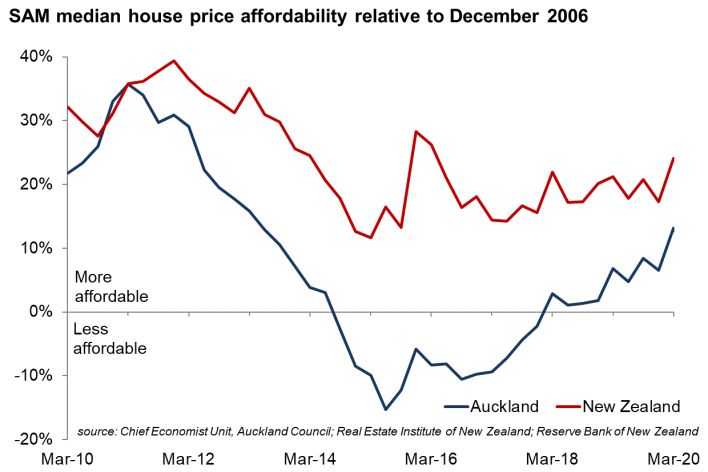
Unemployment at decade lows across                       Again, rates had risen for all groups over the 10
                                                         years, but were noticeably lower for women, the
the board, but disparities remain
                                                         south, those aged 15-19 (some of whom are in
The unemployment rate for the year ended March           secondary or tertiary education), and Pacific.
2020 was 4.3% for Auckland, significantly lower          Overall LFPR was noticeably above average in
than in 2010 (6.8%), the early days of recovery          2020 among those aged 20-45.
from the global financial crisis.
                                                         Migration-led population growth drives
The south, younger people, Māori and Pacific all
                                                         GDP
tended to have a substantially higher overall
unemployment rates than the regional average.            Just before the COVID-19 outbreak, the resident
Women have a slightly higher unemployment rate           population in Auckland was estimated at nearly
than the average. All sub-groups had seen                1.7 million, an increase of 18% over 10 years.
unemployment rates fall by at least one third            The median age in Auckland (35 years old) is
since 2010.                                              slightly younger than that for New Zealand as a
                                                         whole (37). The region is more ethnically diverse,
Unemployment rates are lower for higher levels of
                                                         with greater proportions of people with Pacific and
school qualifications, but the differential has
                                                         Asian ethnic identities. Almost 50% of
generally narrowed since 2010; it is not clear if
                                                         Aucklanders identified as Asian or Pacific,
this narrowing is an ongoing trend that will
                                                         reinforcing the region’s cosmopolitan character
continue, or a cyclical process that could reverse
                                                         and reputation as the gateway into New Zealand
with a weakening economy.
                                                         for around 70% of permanent and short-term
The Labour Force Participation Rate (LFPR) for           arrivals. International migration has been the
the year ended March 2020 was 70.8% for                  main contributor to Auckland’s population growth.
Auckland, somewhat higher than in 2010 (67.3%);

                                                     4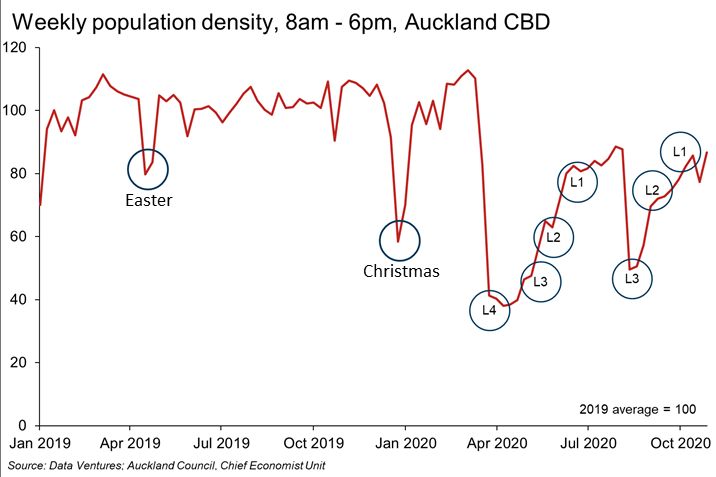
Migrants tend to be young; over 40% are aged              above 1.70 million. Housing supply has been
between 20 and 34.                                        unable to match demand, and Auckland Council
                                                          estimates the housing shortage remains around
International migration is an important economic
                                                          29,000, down from 36,500 with record numbers of
driver in New Zealand and in Auckland, which
                                                          new dwellings consented in the December 2019
receives around half of all new international
                                                          year (15,154).
migrants. The data suggests that migration
stimulates GDP growth rather than the other way           Strong demand has pushed up house prices in
around based on the strong correlation between            Auckland. By March 2020 they had reached
migration and GDP growth in the same period.              $945,000, making them less affordable in
                                                          Auckland than in the rest of New Zealand. The
Growth in GDP per capita terms has been
                                                          gap between Auckland house prices and the rest
substantially lower than overall GDP growth.
                                                          of the country widened to a 72% difference in
Similarly, productivity growth has been modest,
                                                          March 2020 compared to a 54% difference 10
with growth dominated by mouths to feed.
                                                          years prior.
                                                          Yet in the three years from late 2016 to late 2019,
                                                          house prices in Auckland flattened quite
                                                          noticeably, leading to a meaningful improvement
                                                          in housing affordability.
                                                          Sharp asset price rises as we saw between 2011
                                                          and 2016, and as began again by late 2019, lead
                                                          to widening wealth gaps amongst Aucklanders.
                                                          Those who own assets enjoy a large untaxed
                                                          increase in wealth, while those who don’t own
                                                          assets are increasingly locked out of owning
An anomaly in net international migration is              those wealth-generating assets by barriers like
observed during the year ending March 2020.               deposit requirements. The 2018 Census already
This was driven by a combination of already-high          shows a lower home ownership rate (59% of
international migration plus “involuntary” net            those households living in occupied private
immigration due to the global pandemic. We                dwellings) compared to the 2013 and 2006
return to this unusual spike in the next chapter of       Censuses (61% and 64% respectively).
the report.                                               Wealth provides choices. Aucklanders who
                                                          cannot afford to buy a house are increasingly
House price growth drives wealth gap
                                                          disadvantaged relative to home owners who
Over the last 10 years, Auckland’s resident               enjoy wealth gains, limiting economic mobility.
population has grown from around 1.44 million to

                                                      5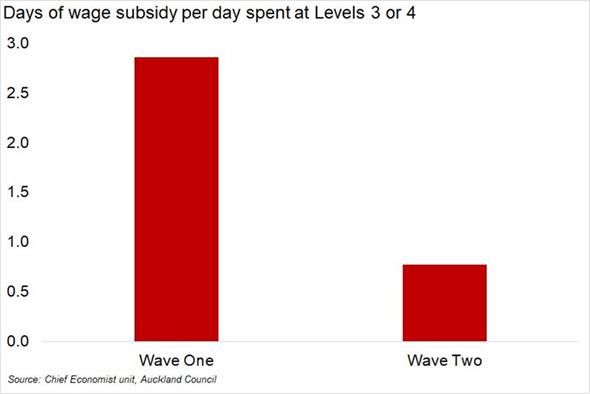
The impacts of COVID-19 on Auckland’s economy
•   Auckland’s solid recent economic
    performance was interrupted by a surge in
    unemployment and falling GDP through two
    lockdowns.
•   Nevertheless, economic activity has
    rebounded faster than economic
    commentators assumed would be the case.
•   Responses here and abroad to tackle the
    pandemic and its economic consequences
    have contributed to a spike in migration and
    rampant house price growth in Auckland.
                                                        Across Jobseeker data where ethnicity was
Lockdowns cost over 22,000 jobs;
                                                        recorded by the Ministry of Social Development,
young people affected most                              the number of jobs lost was spread fairly evenly.
More than 26,000 Aucklanders lost their jobs            The percentage change in the number of
between March and August 2020, and the                  jobseekers rose fastest across categories labelled
unemployment rate surged. The unreliability of          “European” and “Other” (mostly Asian). Yet Māori
unemployment statistics under covid-19                  and Pacific had higher unemployment rates to
conditions, highlighted when comparisons are            begin with. Further, because they are smaller
made to Jobseeker statistics, suggests that the         shares of the population, these ethnicities
real unemployment rate is well above the official       experienced bigger percentage changes in
estimate of 5.6% for Auckland.                          shares of their population seeking jobs.

A second lockdown and a lower level of wage             The number of female Jobseeker and CIRP
subsidy support than during the first lockdown          beneficiaries in Auckland grew by 9,200 between
mean Auckland’s unemployment rate also rose             December 2019 and September 2020, or 44%,
faster than elsewhere. Around 200 Aucklanders           compared to 12,400 in total or 52% for males.
lost their jobs each day at Level 3.                    The biggest rise in Jobseekers was for 18-24 year
Encouragingly, total recipients of Jobseeker            olds, up 84%, and for 25-39 year olds, up 57%.
benefits and Covid Income Relief Payments               Auckland’s GDP fell around 13% in the June
(CIRP) have fallen by about 3,900 since the peak,       quarter, the biggest ever decline, unsurprising
leaving job losses at about 22,800 since March,         given that swathes of the economy were shut for
but some further job losses are expected.               weeks to prevent a lethal virus from spreading.

                                                    6
The national economy rebounded strongly in                  was growing around 2.5% in Auckland and
September 2020 (around 14%), reaching a figure              unemployment was at decade lows
higher than before the pandemic began. But the          •   House prices surging 16% in the year to
rebound in Auckland was weaker given the                    December 2020, as 10% unemployment did
second round of lockdown here, estimated at                 not materialise, interest rates plummeted and
between 7% and 9% quarter on quarter.                       loan-to-value ratio restrictions were removed
                                                        •   Consequently, residential development
Negative economic impacts more
                                                            reaching record levels.
modest than expected
                                                        Indicators like rapidly rising house prices are a
Nevertheless, New Zealand, and even Auckland            double-edged sword – they often imply widening
with an extra round of lockdown, has weathered          inequity – but are powerful indicators of economic
the economic storm better than commentators             confidence. Similarly, the surge in development
believed would be the case.                             activity, despite higher unemployment, is a strong
Over the four months to December 2020, there            vote of confidence in the outlook for the economy.
was not a single major economic indicator that          It points to construction continuing to play a
was weaker than anticipated back in April, or           dominant role in Auckland’s job and GDP growth,
even as we exited the first lockdown in June.           as it has in the last decade.

A non-exhaustive list of better-than-expected           Unexpected consequences in housing
economic outcomes includes:                             and migration
•   Unemployment rising far less than anticipated       As the government and Reserve Bank scrambled
    (May 2020 forecasts across commentators             to respond to the looming economic crisis from
    were for unemployment of 9-12%)                     the pandemic, they took drastic action to prop up
•   GDP rebounding to pre-pandemic levels               the economy, playing a major role in outcomes
    faster than anticipated                             being better than expected. But at the same time,
•   Retail trade bouncing remarkably, remaining         this stimulated house price growth, as already
    flat in nominal terms for Auckland year-on-         highlighted, leading to poorer affordability,
    year despite a collapse during the first            widening the wealth gap.
    lockdown
                                                        Another unexpected outcome has been a huge
•   Air New Zealand reaching 90% of pre-
                                                        surge in migration. The media talks about a flood
    pandemic domestic capacity by December
                                                        of New Zealanders returning to New Zealand, but
    2020, implying take-up by New Zealanders to
                                                        the net number of long-term arrivals since
    offset some of the domestic travel by
                                                        borders closed to non-residents in March has
    international visitors
                                                        been remarkably small, in the range of a few
•   Business confidence being higher than at
                                                        hundred a month.
    three previous points under the current
    government before the pandemic, when GDP

                                                    7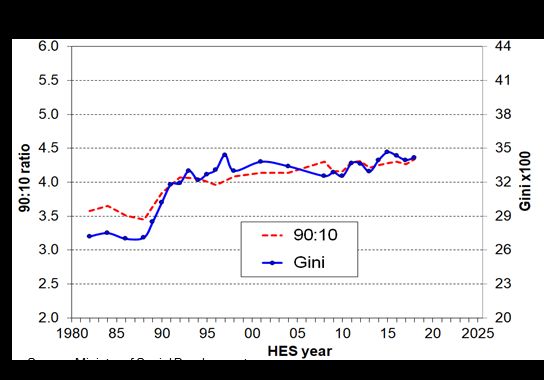
So why did net migration surge to nearly 100,000         has created an artificial distortion in migration
just before borders closed, as the migration             figures. This will be putting huge pressure on the
graph in the previous chapter shows? This                housing stock nationally, contributing to higher
appears to have been driven by people coming to          prices, but will also be having a stimulatory effect
New Zealand perhaps on a short-term basis in             on the economy more broadly. All those extra
the months leading up to the pandemic, and then          people need food, clothing, internet services and
choosing not to or being prevented from leaving          so on. But in the year to March 2021, we can
once those borders closed. This choice could             expect to see significantly lower net international
have been because of worsening health and                migration figures due to the current trickle of
economic conditions overseas, or simply difficulty       people.
or cost in leaving New Zealand. Regardless, it

                                                     8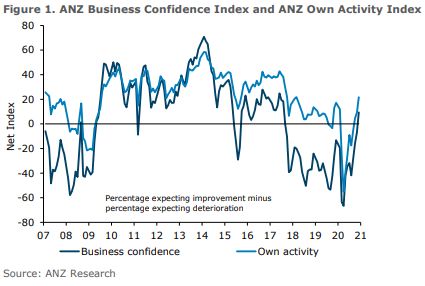
Roadblocks to recovery
•   Numerous risks to recovery exist.                     different trade-offs being made between
•   One group of risks is from the pandemic               protecting lives and protecting livelihoods.
    itself – the ongoing possibility of spread, new
                                                          Slow rollout or uptake of vaccines
    mutations, or slow vaccine rollout and uptake.
•   Others relate to global trade and                     Slow rollout of vaccines in New Zealand, or slow
    geopolitical tensions.                                uptake globally, would mean closed borders for
•   A third category relates to closed borders            longer. This would limit recovery of our tourism
    here, with a languishing tertiary sector, less        and international student markets, and restrict
    downtown business and skills shortages.               access to skilled workers, a point we return to
•   Funding and public confidence risks                   again below.
    include rising national debt levels, quality of       Further, the longer the global community takes to
    evaluation of proposed interventions, risk of         reduce the availability of human hosts for the
    loss of public support, and challenges for            virus, the more likelihood of further mutations and
    Council funding.                                      vaccine-resistant strains developing.
•   If fiscal and monetary policy don’t work
    together, large wealth inequalities will              Economic weakness in our trading
    continue to worsen.                                   partners
Several immediate risks to economic recovery              The world economy was already slowing pre-
exist, and some are growing. Not all of these risks       pandemic. Global weakness and repeated virus
may materialise or last, and not all are risks that       surges are dampening economic activity in many
a Group-led economic development action                   of our main trading partners. Without further
plan (EDAP) can overcome, but we must keep                lockdowns here, we would expect to see GDP
the full range of risks to economic recovery in           growth here surge as the calendar quarters
mind. These risks are discussed next, not                 dampened by lockdowns exit the annual data. But
necessarily in order of importance.                       after this “maths” of New Zealand’s domestic
                                                          recovery has occurred, where will economic
More outbreaks and lockdowns
                                                          growth come from? This risk will be particularly
New Zealand, with Auckland as the primary                 bad if borders remain largely closed into late
gateway, remains at constant risk of the virus            2021, a distinct possibility given the relatively late
getting into the community and causing another            planned roll-out of vaccines in New Zealand (third
lockdown. Further outbreaks, if they result in            quarter of 2021 onward for non-frontline workers).
lockdowns of more than a few weeks, would likely
                                                          Closed borders will prevent a rebound in tourism
have far larger ongoing economic impacts than
                                                          and export education, while sales of more
previous lockdowns here, as seen in Victoria
                                                          traditional New Zealand primary commodities may
(Australia) and the UK, for instance.
                                                          be limited by a weak global economy.
Auckland’s second lockdown saw the region lose
                                                          Weakness overseas carries a further risk, too –
almost 200 jobs a day across 18 days of Level 3.
                                                          that higher unemployment there leads to more
This outcome was even after the experience of
                                                          bad debts, and that a financial crisis emerges as
the first lockdown, which helped prepare
                                                          the financial system comes under pressure. As
businesses for the second lockdown.
                                                          we saw with the Global Financial Crisis, this
A Level 4 lockdown, or a longer period of severe          would have lingering impacts that would flow on
restrictions, would have a snowballing impact on          to countries like New Zealand, even if we don’t
economic outcomes, and could even lead to                 suffer as much from the same banking risks here.

                                                      9
Geopolitical tensions local economic vitality even as industry
composition changes fast.
The political fallout from the pandemic is ongoing.
With several of New Zealand’s traditional allies Tertiary sector breadth of study,
pushing for an independent inquiry into the origins reputation and exposure
of the virus, New Zealand may be caught in the
political and economic crossfire. International students are a major revenue source
for tertiary institutions. Further, access to a pool of
There has already been a sharp economic international students allows institutions to
response from China to calls for the inquiry from provide a range of courses and other services
New Zealand’s second largest trading partner and that may not be possible with restricted revenues
largest tourism market, Australia. China has and student numbers.
implemented successive rounds of trade
sanctions on Australia as rhetoric from both sides With no clear plan to allow most international
has grown. students back into New Zealand, this loss of
income and student volumes will likely lead to
If tensions continue to mount, New Zealand may reduced course offerings for domestic students. It
be pressured to choose sides, leading to further will also result in less exposure for New Zealand
risks of weaker international trade. tertiary institutions (with much of the reputational
City and town centre weakness gain coming from international exposure).
Finally, we may miss out on the opportunity to
The city centre (and many metro and town
attract more students to New Zealand while we
centres) have been badly affected by the loss of
enjoy our reputation as one of the few countries
tourists, loss of international students, lower
that has COVID-19 under control, and to keep the
employment, and more people working from
best graduates to fill our skills gaps.
home. The working from home trend seems to
have weakened again to some extent, retreating Worsening skills shortage
to mostly Mondays and Fridays.
A quick glance at the occupations for which work
But with no clear plan in place for bringing in visas were issued prior to the pandemic shows
foreign students for the 2021 year, and an that a large number were for unskilled workers.
ongoing ban on other international arrivals, the But there are genuine shortages across many
risk is certainly for ongoing city centre weakness. skilled worker categories.
The rise in domestic online shopping (up 33% in
the September 2020 quarter nation-wide Anecdotally, there are already challenges
compared to a year earlier according to bringing in engineers and film crews among
Marketview) also means fewer residents are others, with such limited quarantine spaces
spending in their local town centres, reducing available. Without open borders, and without
further flex in quarantine capacity, these gaps will
widen, slowing recovery.
10In the absence of access to skilled overseas pre-pandemic, but with smaller numbers of
workers, questions remain over whether Auckland people accessing the highly productive city
will be able to upskill enough workers of our own centre. This reality is despite more people
to fill gaps, particularly if the nature of work working from home, which should reduce typical
changes in as yet unknown ways post-pandemic. travel times.
Workers for our housing and Rising debt with mixed results
infrastructure deficit Some central government and Reserve Bank
Further to the skills shortages already described, policies have been effective at stimulating the
questions arise as to where the builders will come economy, helping to prevent a bigger economic
from to build the 16,000 dwellings consented in decline. However, in the early days of pandemic
the last year, especially with borders closed and response, including the May budget, the forecast
Australia now offering one-way quarantine-free was particularly bleak, and there were many
travel to New Zealanders. unknowns. A critical view would be that as a
result, money was spent on a lot of things, without
With billions of dollars of NZ Upgrade and now the luxury of time to evaluate the courses of
shovel-ready projects announced nationally and action that delivered the best value outcomes.
in Auckland, the risk is that the funding goes
unspent, exacerbating the infrastructure shortfall, A year on, there is far less of a case for broad
due to a lack of capacity to deliver the projects. brush programmes, with better knowledge about
how to respond to the pandemic, how different
Congestion without public transport responses have fared, and as national debt (and
(PT) uptake Auckland’s share, as around 40% of the tax-take)
rises. The risk is that funds are spent on projects
Prior to the pandemic, Auckland had a well-
that don’t deliver value for money, based on
documented congestion problem. Since Auckland
limited analysis, which will slow the recovery.
entered lower levels of restrictions, the move back
into PT use has been slow. Travel times into the Public support and confidence
city centre are largely back at where they were
Public support for health and economic counter-
pre-pandemic, but with public transport use still
measures rests on their transparency, perceived
down about 30% compared to the same time a
equity, affordability and likelihood of success.
year earlier. Vehicle use has rebounded to pre-
pandemic levels, suggesting reluctance by There is a risk, highlighted already, of public
Aucklanders to get back on the bus, train or ferry. concern over rising national debt, particularly as
the especially bleak outlook foreseen in May
This means the recovery is being impeded by the
failed to materialise (in part precisely because of
same congestion and emissions issues we saw
government and Reserve Bank action).
11This risk is mostly political, but if political mean that Auckland is left to fend economically
resistance to spending rises, it can lead to slower more for itself than other parts of the country,
decision-making and perhaps less spending than despite this region’s contribution to the tax-take
may be justified in certain areas of need at both and bigger hit from pandemic lockdowns and
the central and local government levels. border closures.
Constrained funding for Auckland Rising wealth inequality
In the last 20 years, New Zealand’s inequality has
been a rising wealth gap far more than a rising
income gap. Monetary policy, which aims to
stimulate the economy by lowering interest rates,
plays a big part in this. It stimulates by pushing up
asset (such as house) prices, which create a
wealth effect and encourage spending.
There is nothing wrong with this relatively blunt
instrument on its own. But it must be
accompanied by other, fiscal policy tools if we are
not going to exacerbate the divide between the
At the same time local governments, including haves and the have-nots, often exemplified by
Auckland Council, have faced revenue challenges landowners and renters.
from border closures and lockdowns. This means
Ironically, rapid house price rises give developers
that despite a huge infrastructure deficit, and
confidence to build more homes, which we need
despite planned spending on infrastructure over
to overcome the ongoing shortage in Auckland.
the next 10 years that will still be at record levels,
Auckland is unable to deliver infrastructure at the Pushed too far, wealth inequality can lead to a
rate it had hoped. break down in the social contract, and resultant
political and social upheaval. This inevitably has
Further, as we saw during the second lockdown,
impacts on economic growth. If wealth inequality
the impacts of which were overwhelmingly
is not tackled, it will lead to worse socio-economic
skewed toward Auckland, there is reluctance to
division and poorer upward immobility.
spend on targeted support for Auckland. This may
12Economic development levers the Group has
• Auckland Council Group provides hundreds of It is beyond the Group
services that are valuable, but most of these The focus is beyond the Group. Economic
are not economic development levers. development is not achieved by the Council
• By economic development levers, we mean employing more people directly. Any money we
Group activities that can be demonstrated to spend is ultimately some form of tax or user
materially improve economic development charge that comes from the pockets of
indicators beyond the Group. households and businesses, so the job we
• The Group is financially constrained. This generate is at direct cost to someone else.
means any levers we pull have to be about Thus, the question of how the Group aids
improving existing processes and activities, recovery is really about how we use our role in
or re-prioritising, rather than spending pots of Auckland to stimulate additional or better
new money. economic outcomes than we would see in our
• Group levers include enablers (how we use business as usual activities, beyond the Group.
our assets and procurement, regulator
powers, transport networks and so on), those What do we mean by levers?
that incentivise efficient choices by the
Themes of activities
private sector (taxes and fees, investment in
The Group engages in literally hundreds of
town and city centres, skills and tourism
different activities, services, and internal
attraction), and those that coordinate and
processes. It would be a vain effort to discuss
support (such as social services and
each one of them that has some link to economic
coordination with non-Council stakeholders).
development. Instead, we take a thematic look at
What do we mean by economic the levers we have available.
development? An example of this is how we use procurement.
The Group engages in all kinds of procurement,
It is not everything we do
from infrastructure to library books. It does not
The Group provides a huge array of services to
make sense to discuss library book purchases as
Aucklanders. But the focus of this report is not on
a specific lever to pull, but procurement across
every service the Group provides, but only on
the board can be used as a lever to aid recovery
services that:
if done well.
1. can be explicitly used as levers to stimulate
Doing BAU better
economic development beyond the Group
The mandate for the EDAP is clear. There is not a
2. can be demonstrated to materially increase
pot of money available for an array of new
incomes, increase the number of jobs,
initiatives. The levers need to be things that we
decrease unemployment, reduce reliance on
are already doing, but where we may be able to
government benefits, increase the mix of
do things differently or better to support
business types, increase GDP growth, and/or
recovery. As we read them, resist the urge to say,
increase productivity (GDP/worker) beyond
“But we already do that”. That’s the whole point.
the Group.
The focus is recovery
If you strain your eyes and tilt your head enough,
The specific focus of the EDAP is on recovery – a
you could call almost anything “economic
three year timeframe. This does not mean that
development”, but that is not an honest appraisal.
some of the levers we pull won’t have much
This analysis cares about scale of impact on
longer-lasting impacts, but these levers should be
economic development, and the extent to which
able to have immediate impacts.
the Group owns these levers (i.e. the extent of
our influence).
13Before we pull the levers With this context in mind, we turn to the levers,
which are not presented in order of importance.
Before pulling the levers, it makes sense to
consider the following: Lever 1: Use assets to provide what
1. Just because something can be done, Aucklanders need
doesn’t mean it should be: Any specific As at June 2020, Auckland Council group had
project undertaken under the banner of a $50 billion in property, plant and equipment. A
lever should still be justified. This means large portion of this is in community infrastructure
using empirical evidence to demonstrate that – our libraries, pools, parks, community centres,
the project is a good use of money, and indoor sports facilities, golf courses, sports parks,
monitoring that it delivers the recovery and corporate property among others.
outcomes it aims to achieve.
2. Every decision we make involves trade- Some of the questions to consider thinking of this
offs. Choosing to spend more here means powerful lever include:
less to spend there. Funds are limited, so • Do we have value tied up in assets that are a
pulling one lever may mean we are limited in hindrance to supporting recovery in an
what we can do in another area. We need to equitable and pragmatic way?
explicitly consider these trade-offs and make • How do or should we monitor what outcomes
them knowingly. (and not just outputs such as number of
3. How we implement projects matters: Once users) we get out of these various assets to
we decide a project is justified in aiding help understand how they support economic
recovery, how we deliver it will obviously development?
affect its success. An example of this is • Are we bold in divesting those that don’t stack
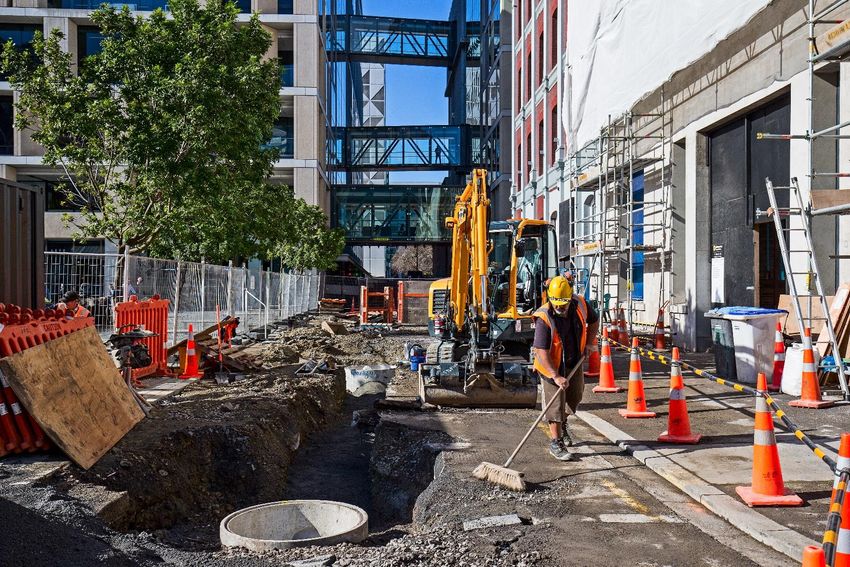
infrastructure development. Disruption up and adjusting the use where necessary of
associated with infrastructure development those that we retain?
can offset a lot of the gains that infrastructure • Is the level of implied subsidy for our different
will have in the long-term. types of facilities and services commensurate
4. Are we crowding out services that should with the use and value to Aucklanders?
be provided by central government, other
agencies or the private sector? All local Lever 2: Stimulate through
governments together collect 7% of taxes in procurement
New Zealand. Central government collects
We have already highlighted that the Group
93%. In such constrained times for local
procures a wide array of products and services,
government, we need to carefully evaluate
from office supplies and library books to multi-
whether we fund services that fall better under
billion dollar infrastructure programmes.
the central government mandate and funding
umbrella. The challenge is that we see gaps
in provision of services and feel the need to
step in, but this discourages central
government or other agencies from funding
these services in Auckland, or in some cases
crowds out private business.
5. What is the role of technology in
implementation? Sometimes, technology can
help us improve delivery, but only if the
technology is fit for purpose. In thinking of
how to support recovery, we should be Source: Auckland Council Summary Annual Report 2019/2020
thinking of better ways to deliver services, and
whether technology will aid that delivery.
14The 2018 to 2028 Long-Term Plan proposed $26 benefit per se, the way a private business does.
billion of capital spending alone, on transport, This means it is right not only to consider the
water, parks, community, town centre dollar cost of procurement, but what that
development and so on. The proposal for the procurement does for Auckland, from a recovery
2021-2031 period includes spending on capital of perspective and beyond.
$31 billion. This is in addition to additional billions
in operational spending.
Lever 3: Support business and
development through right-zoning
Questions to consider as we spend these billions
of dollars include: One of the most powerful levers we have is the
Unitary Plan, which sets the rules for what we can
• Are we spending on things that stimulate
build where.
downstream (i.e. beyond the Group)
economic recovery? Not all spending is equal An enabling Plan supports economic growth; a
in this regard. Spending that encourages restrictive one stifles economic activity. This
people into our communities, to spend money report is not speculating where on that spectrum
locally instead of on the internet, for example, the Plan currently lies.
can have big down-stream benefits. Spending But a number of questions arise in considering
on infrastructure that enables further how to use zoning rules to support recovery:
development using land more efficiently and
making more housing closer to jobs available, • Does the Plan make it easy to undertake
is another example of procurement with a business activities, minimizing compliance
potentially large downstream benefit. costs for businesses? This includes where
• Are our procurement practices making upward and how businesses can operate.
mobility possible? As large procurers, • Does the Plan maximise housing
especially of infrastructure, we play a major development opportunities in a way that
role in the Auckland market. If we tend to use maximises the efficient use of land (which
only large suppliers, this can hollow out the reduces compliance and housing costs),
sector such that smaller players never have especially close to jobs and PT, so as to
the opportunity to grow to deliver larger reduce impediments to accessing jobs, goods
projects. Over time, this can reduce and services?
innovation and competitiveness in an industry. • Do zoning rules maximise usability of a site
• Do our procurement policies support local and such that we get economically efficient
diverse supplier sources, so that salaries and outcomes?
profits generated from procurement we fund Lever 4: Support business and
go back into many communities in Auckland?
development through regulatory
• Are our procurement processes suitably
scalable, making it easy for suppliers to get processes
work from us, supporting a more competitive The Group has a number of regulatory
market and better outcomes? responsibilities as a unitary authority. These
Clearly when considering these latter two regulatory processes have to strike a balance
questions, we still have to ensure value for between meeting legislative responsibilities, and
money. A smaller supplier who wants to charge trade-offs between competing priorities.
twice as much may not be a good way to spend Fast, fit-for-purpose and pragmatic processes
ratepayer money. can aid business recovery and development,
But governments exist to deliver economic while processes without these characteristics do
wellbeing (correctly defined as financial, the opposite. Processes with a direct economic
environmental, social, cultural and potentially development impact range from resource and
other components of wellbeing), not financial building consents to licences for alfresco dining.
15Questions to consider on this lever include: Strong growth also improves commercial
viability of routes.
• How do we make regulatory processes
• How can zoning and infrastructure decisions
faster?
support this objective of improving travel for
• Are processes fit-for-purpose in supporting
people and products through the region?
economic recovery?
• How do we optimise PT routes to allow for
• Are we pragmatic in finding solutions?
faster cross-town travel?
• Do we say “No”, more often than we say “Yes,
• How do we avoid a repeat of the supply chain
that will work with these small changes”?
disruption in December?
Lever 5: Reduce congestion, improve • How do we get incentives right so that people
travel and supply chains use the existing transport network in the most
efficient way?
The Roadblocks chapter pointed out how • How can we collaborate with the private
congestion has surged since the first lockdown sector to encourage PT use and off-peak
despite more people working from home. travel among their workforces?
Challenges also arose at the Ports of Auckland in
Lever 6: Get people into centres
processing cargo in the lead-up to Christmas.
Retail spending in New Zealand has been
Congestion and supply chain disruption are major
remarkably resilient through the last year, but how
impediments to an economy at any time, and no
we spend money has changed. By September
less so as we seek to recover from a downturn. It
2020, New Zealand had recorded a 33% increase
would be naïve to think that Auckland’s
in quarterly domestic online spending compared
congestion problem, which has been growing
to a year before, according to Marketview.
through decades of under-investment by local
and central government, can be overcome in the Online spending has the potential to reduce
next three years. The current level of government congestion and emissions. But it also discourages
and Council group funding for transport, and people from shopping locally. Larger online
within that for PT, is a leap in the right direction. retailers tend to benefit to the detriment of local
retailers. This can lead to hollowed out town or
city centres, creating community-level social and
financial issues.
The Group is engaged in a number of services
that can be used to get people back into centres.
Questions that arise include:
• How do zoning rules encourage development
around town centres? Population density is a
primary driver of sustaining a wider range of
goods and services locally.
• How do regulatory processes encourage town
But the mandate in this EDAP report is how we centre (re)development and a wide range of
use existing services, without large additional business activity?
cost, to encourage recovery. In that context, • Are our infrastructure projects focused on
questions include: providing higher density around town centres?
• Are we prioritising town centre regeneration
• How do we get Aucklanders back on the bus, projects that will encourage people into them?
ferry or train immediately, and grow usage in
• Do we have frequent, widespread public
the double digits annually, a rate needed to
transport links from surrounding suburbs into
make any dent in peak hour congestion?
town centres, and between town centres?
16• How can we best support Business roading network, imposing travel time costs
Improvement Districts? on other network users.
• How can we work with the private sector to • How are rates and charges incentivizing
change the offering businesses have, so they people to achieve good economic
don’t tie their success to one demographic development outcomes?
only, such as the nine to five office worker?
Lever 8: Grow skills and investment
• Are there activities we already provide that
could be provided in town centres to lure Skills shortages in Auckland are growing for two
people back there? reasons. Over the last several years, internal
migration within New Zealand has seen a net
Lever 7: Incentivise productive activity outflow of Aucklanders to other regions. Second,
Prices are a major way to modify behaviour. borders remain largely closed.
Charge a lot for something and quantity Similarly, closed borders are a challenge to
demanded falls. Charge a little and quantity attracting direct investment from offshore. While
demand will rise. we could try and attract investment from other
Economics explains that you get the most parts of New Zealand, Auckland is already the
efficient outcomes (which means better economic commercial capital of the country. New Zealand’s
recovery) when things are priced accurately. private investment funding is largely already here.
Pricing accurately includes charging for the cost Some questions include:
of producing that good or service, but also adds in
the cost of any detrimental effects that good or • If borders remain closed for most of 2021,
service may have on others, or discounting for what role can the Group play in attracting
external benefits that good or service provides. skills from other parts of New Zealand?
• What is the role of the Group in skills
The Group sets numerous taxes and charges,
development or retraining and where does
from property rates, to development contributions,
that start and stop relative to central
licensing, building consent fees, and PT fares.
government and other organisations (see also
In setting fees and taxes, the Group has several Lever 10: Provide social support
considerations including the actual cost of commensurate with our size and role)
delivering a service; affordability to those asked to • To what extent can we navigate around the
pay; and establishing who benefits. challenge of largely closed borders in
Questions to consider include: attracting foreign investment?
• Do Group taxes and charges reflect the Lever 9: Fill the tourism gap
market cost of delivering a service, such that it With borders closed, Auckland has struggled to
directs people to where services are most attract its “fair share” of growth in domestic
cost-effective? An example of this is tourism. With 35% of New Zealanders already
development contributions. If we under- living here, boosting our share is hard.
charge for this (relative to the true cost of
delivering infrastructure there), land prices But borders also won’t be closed forever, and we
rise artificially, and development there is want to be positioned for our share of what could
incentivized even though it may be more cost- be an unprecedented wave of tourism once
effective to develop elsewhere. perceptions on the risk of COVID-19 change.
• To what extent do Group taxes and charges
cover the external (non-market) price of
choices people make such that they make
economically efficient choices? A textbook
example of this is the decision to use the
17communities. These are not direct economic
development levers, and the purpose of this
report is not to list every service we provide or try
to shoe-horn each one of them into somehow
being economic development activities.
But some of the social services the Group
provides can be drawn upon by the community
in times of economic hardship, helping to
provide a social safety net. We should be thinking
about the social services we provide and how
they can support recovery.
There is also a risk that the Group attempts to
provide a range and level of services inconsistent
with its size and funding. The Group is too small
to provide a full array of social support services.
That is predominantly the role of central
government, non-government organisations, faith-
based organisations, marae and the like.
Historically, the Group has stepped in to tackle
social challenges where a need has been
identified, but this crowds out the funding and
work that other agencies should provide, and at
Source: Data Ventures
which they are specialised. This does not serve
Some questions to ask include: Aucklanders best, and is unaffordable.
• What does Auckland offer domestic tourists to Questions that arise include:
boost our market share and how do we
• How do our services support those who have
communicate that to the rest of the country?
lost their jobs to get back on their feet?
• How do we prepare for open borders such
• How do our services help people form and
that we maximise on our region’s position?
maintain social connections particularly during
• How do we answer the decades-old question
harder economic times for many?
of boosting the quality (spend) per visitor,
• Where have we seen mandate creep, putting
rather than simply chasing numbers?
Group funding into services that are best
• How can we use this period of relative
provided (or at least funded) by other
weakness in tourism growth to improve
agencies and how do we address or step
tourism infrastructure challenges?
back from that?
• Who and how do we fund this infrastructure?
• Is our provision of social services
Lever 10: Provide social support commensurate with our role and budget?
commensurate with our size and role Lever 11: Coordinate the response
We have identified levers primarily as groups of Finally, bearing in mind that we cannot be the
activities the Group can undertake to improve provider of all services, and that our influence
economic indicators beyond the Group. It is right extends across Auckland, but our spending is
to keep that tight definition for an economic only a fraction of regional GDP, the Group can
development action plan. play a powerful coordination role.
The Group also provides a range of social We are government on the ground. We have the
support services through our local involvement in local knowledge and responsibility to identify
18areas of greatest need and then work with central
government, the private sector, charities and
other organisations to meet those needs.
Questions that arise include:
• How do we use our wealth of data to help
inform non-Group decision-makers?
• How can we link people and organisations
with the right skills together to achieve their
common recovery goals?
• How can we provide advice and feedback on
how these non-Group organisations can
navigate regulatory processes in a fast and
pragmatic way to support recovery?
19You can also read