Comparative Transcriptome Analysis Combining SMRT- and Illumina-Based RNA-Seq Identifies Potential Candidate Genes Involved in Betalain ...
←
→
Page content transcription
If your browser does not render page correctly, please read the page content below
International Journal of
            Molecular Sciences

Article
Comparative Transcriptome Analysis Combining
SMRT- and Illumina-Based RNA-Seq Identifies
Potential Candidate Genes Involved in Betalain
Biosynthesis in Pitaya Fruit
Yawei Wu 1,2 , Juan Xu 3 , Xiumei Han 2 , Guang Qiao 1 , Kun Yang 1 , Zhuang Wen 1
and Xiaopeng Wen 1, *
 1    Key Laboratory of Plant Resource Conservation and Germplasm Innovation in Mountainous
      Region (Ministry of Education), Institute of Agro-Bioengineering/College of Life Sciences,
      Guizhou University, Guiyang 550025, Guizhou, China; yaweiwu2006@163.com (Y.W.);
      gqiao@gzu.edu.cn (G.Q.); kyanggz@163.com (K.Y.); gzu_zwen@163.com (Z.W.)
 2    Institute of Pomology Science, Guizhou Academy of Agricultural Sciences, Guiyang 550006, Guizhou, China;
      xiaocao550100@163.com
 3    Key Laboratory of Horticultural Plant Biology (Ministry of Education), Huazhong Agricultural University,
      Wuhan 430070, Hubei, China; xujuan@mail.hzau.edu.cn
 *    Correspondence: xpwen@gzu.edu.cn; Tel.: +86-851-8829-0212; Fax: +86-851-8829-0212

 Received: 3 April 2020; Accepted: 4 May 2020; Published: 6 May 2020

 Abstract: To gain more valuable genomic information about betalain biosynthesis, the full-length
  transcriptome of pitaya pulp from ‘Zihonglong’ (red pulp) and ‘Jinghonglong’ (white pulp) in
  four fruit developmental stages was analyzed using Single-Molecule Real-Time (SMRT) sequencing
  corrected by Illumina RNA-sequence (Illumina RNA-Seq). A total of 65,317 and 91,638 genes were
  identified in ‘Zihonglong’ and ‘Jinghonglong’, respectively. A total of 11,377 and 15,551 genes
 with more than two isoforms were investigated from ‘Zihonglong’ and ‘Jinghonglong’, respectively.
  In total, 156,955 genes were acquired after elimination of redundancy, of which, 120,604 genes (79.63%)
 were annotated, and 30,875 (20.37%) sequences without hits to reference database were probably
  novel genes in pitaya. A total of 31,169 and 53,024 simple sequence repeats (SSRs) were uncovered
  from the genes of ‘Zihonglong’ and ‘Jinghonglong’, and 11,650 long non-coding RNAs (lncRNAs) in
 ‘Zihonglong’ and 11,113 lncRNAs in ‘Jinghonglong’ were obtained herein. qRT-PCR was conducted
  on ten candidate genes, the expression level of six novel genes were consistent with the Fragments Per
  Kilobase of transcript per Million mapped reads (FPKM) values. In conclusion, we firstly undertook
  SMRT sequencing of the full-length transcriptome of pitaya, and the valuable resource that was
  acquired through this sequencing facilitated the identification of additional betalain-related genes.
  Notably, a list of novel putative genes related to the synthesis of betalain in pitaya fruits was assembled.
 This may provide new insights into betalain synthesis in pitaya.

 Keywords: pitaya; SMRT; betalain; different expressed genes; qRT-PCR

1. Introduction
     Pitaya (Hylocereus), originating from Latin America and the West Indies [1], is an economical and
nutritional fruit cultivated in tropical and subtropical regions. H. polyrhizus (with red pulp and peel) and
H. undatus (with white pulp and red peel) are the two major types [2]. Betacyanin and betaxanthin are
the two major pigments of betalain, which mainly define the coloration in pitaya fruits [3]. Betalain is
a tyrosine-derived pigment that occurs solely in the order of Caryophyllales, which largely replaces

Int. J. Mol. Sci. 2020, 21, 3288; doi:10.3390/ijms21093288                          www.mdpi.com/journal/ijms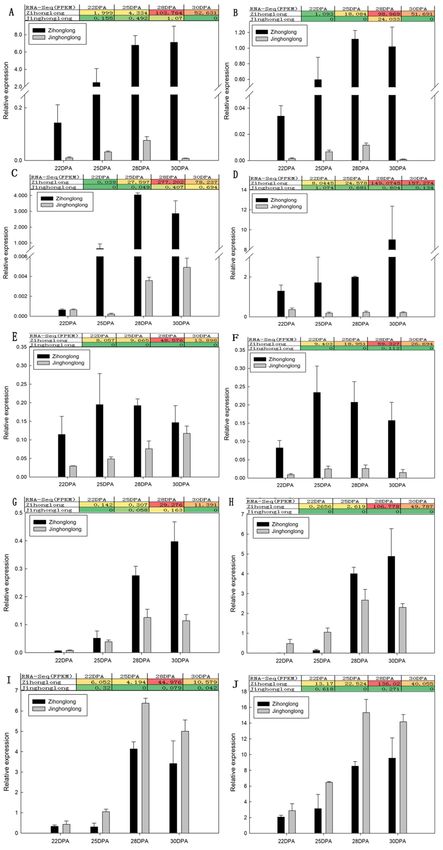
Int. J. Mol. Sci. 2020, 21, 3288                                                                         2 of 17

the anthocyanins in a mutually exclusive manner [4]. Betalain has high nutritional value and positive
effects in health and disease prevention for high antioxidant and anti-inflammatory capabilities [5,6].
Therefore, betalain synthesis has become a research area of high scientific interest, as well as economic
significance [7]. Currently, the metabolic pathway of betalain is clearly defined [4]. The initial step
in betalain biosynthesis is the hydroxylation of tyrosine to form L-DOPA through the monophenolase
activity of the enzyme tyrosinase, CYP76AD6, CYP76AD5, and the previously described CYP76AD1 [7,8].
However, CYP76AD1 is also able to produce cyclo-DOPA, CYP76AD5 and CYP76AD6 do not have this
activity [9]. L-DOPA is subsequently converted to dopaquinone by CYP76AD1 [8,10], or it is alternatively
converted to 4,5-seco-DOPA initiated by DOPA 4,5-dioxygenase (DOD) [11,12], and then, dopaquinone
spontaneously converts to cyclo-DOPA and 4,5-seco-DOPA to betalamic acid identified as chromophore [6,13].
Next, betalamic acid condensates spontaneously with amino acid or amine to form betaxanthins, or with
cyclo-DOPA to form betanidine, and betanidin is further glucosylated by a betanidin glucosyltransferase
to form the basic betacyanins betanin or gomphrenin [4]. An alternative pathway was found, in which
cyclo-DOPA is first glucosylated by a cyclo-DOPA-5-O-glucosyltransferase to form cDOPA-5-O-glucoside,
and then condensates with betalamic acid to form betanin, which spontaneously condensates with betalamic
acid for direct formation of betanin [4,14]. The expression of the key BvDODA and BvCYP76AD1 are
controlled by BvMYB1 [15]. Expression of CYP76AD1, in combination with BvDODA1 and cDOPA5GT,
was therefore found to be sufficient for biosynthesis of betanin, without the need for an exogenous supply of
L-DOPA [16]. Nevertheless, betalain biosynthesis has remained poorly understood in comparison to the other
major classes of plant pigments. Then, the identification of new genes involved in betalain biosynthesis is
important. Sequencing platforms is an efficient approach to identify putative genes; 9 key transcripts involved
in betalain synthesis were identified based on Illumina RNA-Seq in pitaya [6]. Nonetheless, many questions,
including betalain biosynthesis in pitaya remain open for limited sequence data [4].
      Illumina RNA-Seq is a powerful tool for the description of gene expression levels [17]; however, it is
difficult to identify full-length transcript using the Illumina RNA-Seq data [18]. High quality transcript
sequences are crucial for plant biology research. Fortunately, full-length transcriptome is being employed
as an effective approach to obtain high quality transcript sequences. Single-Molecule Real-Time (SMRT)
sequencing developed by PacBio can obtain full-length sequencing without post-sequencing assembly [19,20],
which has been used for whole-transcriptome profiling in many plants [21–27], but, thus far, not in pitaya.
However, SMRT sequencing needs to be corrected with Illumina RNA-Seq reads to eliminate its high error
rate [28]; hence, a combination of SMRT sequencing and Illumina RNA-Seq is a preferable process.
      In the present work, a high quality full-length transcriptome of pitaya fruit was generated by combination
of SMRT and Illumina RNA-Seq sequencing, and the transcript functional annotation, simple sequence
repeats (SSRs) analysis and long non-coding RNAs (lncRNAs) prediction were performed based on the data.
Putative genes involved in the biosynthesis of betalain were identified according to the characteristic of
color phenotypic. This study might be a valuable resource for further investigation of pitaya, and might
provide a better understanding of betalain biosynthesis in pitaya fruit.

2. Result

2.1. The Variation of Pulp Color Parameters and Betalain Content
      As shown in Figure 1A, cultivar apparently affected pulp color. As illustrated in Figure 1B,
 the concentration of betacyanin and betaxanthin in pulp of ‘Jinghonglong’ were very low and hardly
varied during the four developmental stages; the former ranged from 0.56 (at 22 days post-anthesis
(DPA)) to 1.09 mg/100 g DW (at 28 DPA) and the latter ranged from 0.82 mg/100 g DW (at 30 DPA) to
1.21 mg/100 g DW (at 28 DPA). From 22 to 25 DPA, a similar concentration and variation were found in
‘Zihonglong’; the concentration of betacyanin were both 1.08 mg/100 g DW and that of betaxanthin was
varied from 1.18 to 1.38 mg/100 g DW. Furthermore, there were no significant differences between the
 two varieties in the concentration of betacyanin and betaxanthin of pulp at the two stages. In contrast,
 the concentration of betacyanin and betaxanthin in the pulp of ‘Zihonglong’ increased dramatically at 28 DPA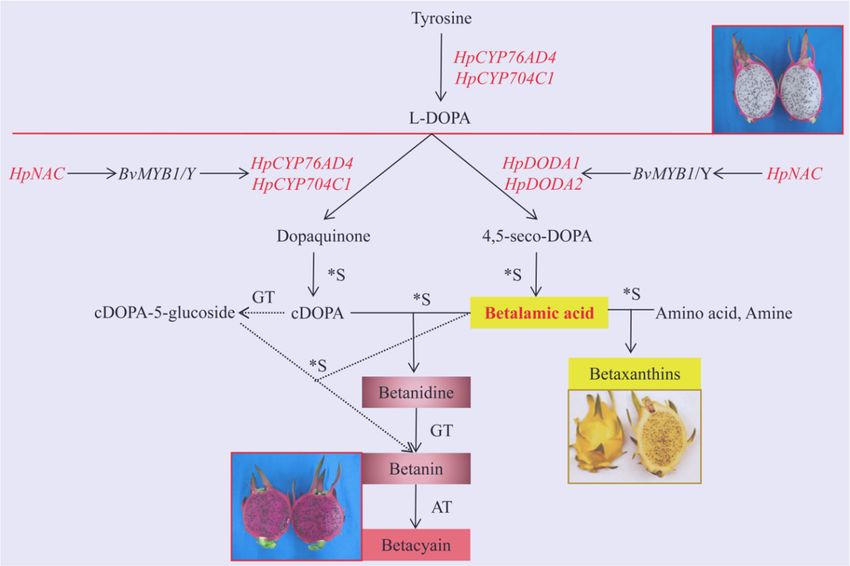
Int. J. Mol. Sci. 2019, 20, x FOR PEER REVIEW 3 of 18
Int. J. Mol. Sci. 2020, 21, 3288 3 of 17
differences between the two varieties in the concentration of betacyanin and betaxanthin of pulp at
the two stages. In contrast, the concentration of betacyanin and betaxanthin in the pulp of
‘Zihonglong’
(10.32 mg/100 g DW ofincreased
betacyanindramatically at 28 DPA
and 5.32 mg/100 (10.32
g DW of mg/100 g DWrespectively),
betaxanthin, of betacyanin and and reached
5.32 mg/100
peak
g DW of betaxanthin, respectively), and reached peak values at 30 DPA (33.06 mg/100 g DW of
values at 30 DPA (33.06 mg/100 g DW of betacyanin and 12.40 mg/100 g DW of betaxanthin, respectively).
betacyanin and 12.40 mg/100 g DW of betaxanthin, respectively). Moreover, the concentration of
Moreover, the concentration of betacyanin was significantly higher than that of betaxanthin, which caused
betacyanin was significantly higher than that of betaxanthin, which caused the red appearance of
the red appearance of the pulp.
the pulp. There were There were no significant
no significant differences differences
in the L*, in b*L*,
a*,the a*, b* of
values values of ‘Zihonglong’
‘Zihonglong’ and
and ‘Jinghonglong’ pulps at 22 DPA. The L*, a*, b* values of ‘Jinghonglong’ were relatively
‘Jinghonglong’ pulps at 22 DPA. The L*, a*, b* values of ‘Jinghonglong’ were relatively stable, stable, while those
while
of ‘Zihonglong’
those ofchanged remarkably
‘Zihonglong’ changed during the fruitduring
remarkably development
the fruitstages. With the
development development
stages. With theof
‘Zihonglong’ fruit, L* value
development was decreasedfruit,
of ‘Zihonglong’ gradually, a* value
L* value wasincreased
decreased prominently
gradually,ata* 25 DPA,
value and reached
increased
the highest level, 27.90 at 28 DPA. There then appeared to be a slight decline for mature fruit. The b* be
prominently at 25 DPA, and reached the highest level, 27.90 at 28 DPA. There then appeared to a
value
slight decline for mature fruit. The b* value decreased from 2.11(yellow
decreased from 2.11(yellow pulp) at 22 DPA to -6.73 (blue pulp) at 25 DPA (Figure 1C). pulp) at 22 DPA to -6.73
(blue pulp) at 25 DPA (Figure 1C).
Figure 1. The
Figure variation
1. The of parameters
variation of parameters related
relatedtotopigmentation
pigmentation(A), (A), Pulp
Pulp color
color in
in four fruit development
four fruit development
stages. (B),(B),
stages. the the
content of betalain
content of betalain in inpitaya
pitayafruit.
fruit.(C),
(C),Color
Colorparameters
parameters of pitaya fruit.
of pitaya fruit. Note, in Figure 1A,
W1 refers
Note,toin‘Jinghonglong’
Figure 1A, W1 fruit
refersatto22‘Jinghonglong’
days post-anthesisfruit at(DPA)
22 days(stage 1). W2 refers
post-anthesis (DPA) to ‘Jinghonglong’
(stage 1). W2 refersfruit
at 25toDPA
‘Jinghonglong’
(stage 2). W3fruitrefers
at 25 to
DPA (stage 2). W3fruit
‘Jinghonglong’ refersatto
28‘Jinghonglong’
DPA (stage 3).fruitW4atrefers
28 DPA (stage 3). W4
to ‘Jinghonglong’
fruitrefers
at 30 to
DPA‘Jinghonglong’
(stage 4). R1 fruit at 30toDPA
refers (stage 4). R1
‘Zihonglong’ refers
fruit to ‘Zihonglong’
at 22 DPA (stage 1). fruit
R2atrefers
22 DPA to (stage 1). R2
‘Zihonglong’
refers to ‘Zihonglong’ fruit at 25 DPA (stage 2). R3 refers to ‘Zihonglong’ fruit
fruit at 25 DPA (stage 2). R3 refers to ‘Zihonglong’ fruit at 28 DPA (stage 3). R4 refers to ‘Zihonglong’ at 28 DPA (stage 3). R4
refers to ‘Zihonglong’ fruit at 30 DPA (stage 4), the same as follow. Different letters
fruit at 30 DPA (stage 4), the same as follow. Different letters in Figures 1B and 1C represent statistically in Figure1B and
Figure 1C represent statistically significant differences (p < 0.05).
significant differences (p < 0.05).
2.2. Transcriptome
2.2. Transcriptome AnalysisAnalysis
Using Using
PacBioPacBio
SequelSequel
The full-length transcriptome of pitaya fruit was generated by PacBio Sequel on ‘Zihonglong’
The full-length transcriptome of pitaya fruit was generated by PacBio Sequel on ‘Zihonglong’
and ‘Jinghonglong’ (Table S1). In total, 9,579,839 subreads from 8.47 G bases were obtained from the
and ‘Jinghonglong’ (Table S1). In total, 9,579,839 subreads from 8.47 G bases were obtained from the
pulp of ‘Zihonglong’, while 7,245,659 subreads were obtained from 7.74 G bases from the pulp of
pulp of ‘Zihonglong’,
‘Jinghonglong’. while 7,245,659adapters
After removing subreadsand were obtained
artefacts, from
367,001 7.74 consensus
circular G bases from the pulp
sequence (CCS)of
‘Jinghonglong’. After removing adapters and artefacts, 367,001 circular consensus sequence
(including 314,173 full-length non-chimerics, FLNCs) of ‘Zihonglong’ and 481,602 CCS (including (CCS)
(including 314,173
348,184 full-length
FLNCs) non-chimerics,
of ‘Jinghonglong’ FLNCs) respectively.
were generated, of ‘Zihonglong’ and 481,602
The lengths CCS (including
of ‘Zihonglong’ FLNCs
348,184 FLNCs) of ‘Jinghonglong’
ranged from 334 to 14,604 nt were generated,
with an respectively.
average length of 950 nt,The
whilelengths of ‘Zihonglong’
‘Jinghonglong’ FLNCs
FLNCs showed
an average length of 1095 nt and ranged from 374 to 6988 nt. For ‘Zihonglong’,
ranged from 334 to 14,604 nt with an average length of 950 nt, while ‘Jinghonglong’ FLNCs showed 184,875 polished
consensus
an average lengthsequences
of 1095 nt transcripts
and rangedwerefrom
produced,
374 toincluding
6988 nt.23,669 polished high-quality
For ‘Zihonglong’, 184,875(HQ) and
polished
consensus sequences transcripts were produced, including 23,669 polished high-quality (HQ) and
161,206 low-quality (LQ) isoform sequences. For ‘Jinghonglong’, 188,215 polished consensus sequences,
including 25,299 polished HQ and 162,916 LQ isoform sequences were obtained. After correcting and
removing redundant reads, 65,312 and 91,638 genes (non-redundant reads) were obtained from full
length transcripts of ‘Zihonglong’ and ‘Jinghonglong’, respectively.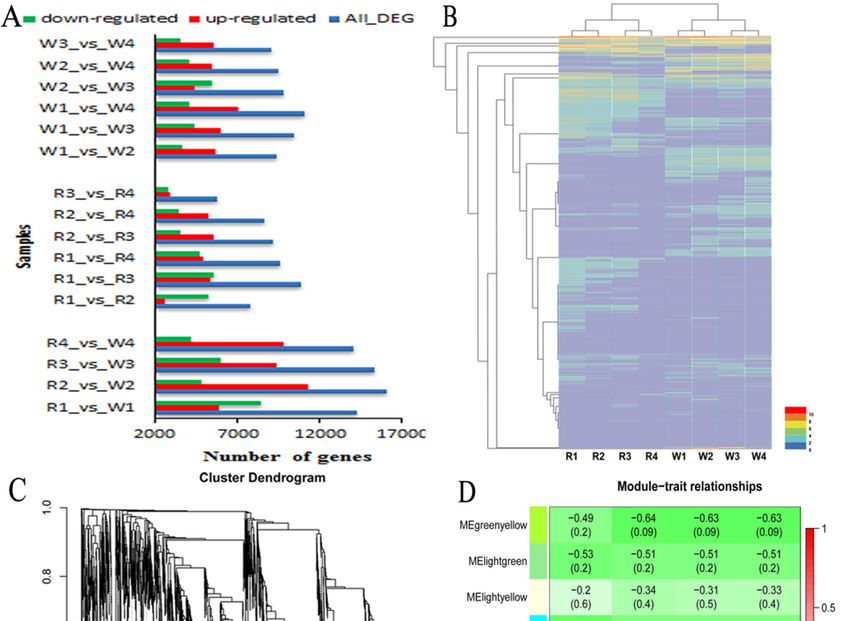
Int. J. Mol. Sci. 2020, 21, 3288                                                                        4 of 17

2.3. Comparison of SMRT Sequencing and Next-Generation Sequencing
     The number of SMRT gene obtained from SMRT sequencing were less than that of unigene
assembled from Illumina RNA-Seq reads, whereas, the mean length of SMRT gene reached up to
1175 and 1337 nt in ‘Zihonglong’ and ‘Jinghonglong’, respectively, which are much longer than
that of unigene assembled from Illumina RNA-Seq reads (681 nt in ‘Zihonglong’ and 696 nt in
‘Jinghonglong’). Regarding the assembled transcripts from RNA-seq reads, the percentage of bases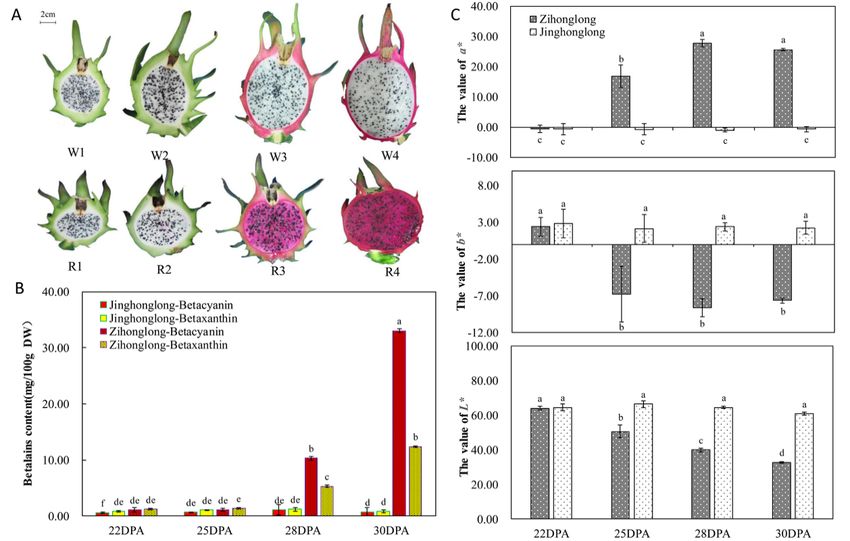
Int. J. Mol. Sci. 2020, 21, 3288 5 of 17
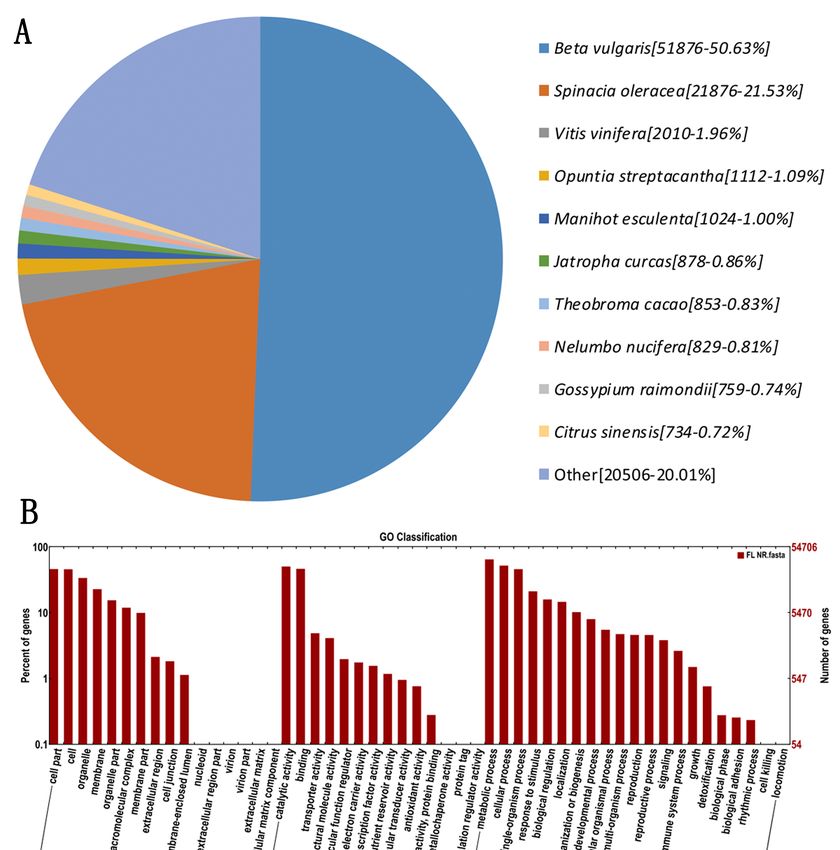
The homologous species of Hylocereus were predicted by sequence alignment on the basis of
the NR database. Of all the genes hits to NR plant proteins from BLASTx, the pitaya genes gave
the highest number of hits to the Beta vulgaris (51,879 hits), followed by Spinacia oleraces (21,876 hits),
and Vitis vinifere (2010 hits) (Figure 2A). Most hits found in Beta vulgaris were probably due to pitaya and
Beta vulgaris belonging to Caryophyllales, and the Beta vulgaris database being better annotated than
those of other species. As shown in Figure 2B, the molecular function (MF, 62,439 FLNCs) was more
abundant than biological process (BP, 142,635 FLNCs) and cellular component (CC, 104,215 FLNCs).
Within these functional groups, the highest number of sequences were annotated with the metabolic
process (35,263 sequences, 11.40%), cellular process (28,379 sequences, 9.18%), and catalytic activity
(27,507 sequences, 8.89%). A total of 117 pathways with 28,796 genes were annotated by KEGG,
associated with 23.88% of the whole annotated dataset (120,640 genes). Among these, 237 genes
were identified in phenylalanine, tyrosine, and tryptophan biosynthesis pathway; however, a KEGG
pathway involved
Int. J. Mol. Sci. 2019,in
20,betalain biosynthesis
x FOR PEER REVIEW was not found. 6 of 18
Figure 2. The distribution features of annotated genes. (A), Homologous species distribution of
Figure 2. The distribution features of annotated genes. (A), Homologous species distribution of
pitaya annotated
pitaya annotatedin the NRNR
in the database.
database.(B),
(B),Gene
Gene Ontology (GO)functional
Ontology (GO) functional annotation
annotation of pitaya
of pitaya genes.genes.
The x-axis represents
The x-axis GO GO
represents categories, the the
categories, y-axis (right)
y-axis represents
(right) thethe
represents number
numberofofgenes,
genes,and
andthe
they-axis
(left) y-axis
represents the percentage
(left) represents of genes.of genes.
the percentage
2.6. SSR and lncRNA Prediction
A total of 31,169 SSRs were identified in 24,889 genes (38.10%) from ‘Zihonglong’, of which
11,885 genes contained more than one SSR, and the number of SSRs present in compound
formation was 4472. A total of 53,024 SSRs were identified in 39,793 genes (43.42%) from
‘Jinghonglong’, of which 18,725 genes contained more than one SSR, and the number of SSRs
present in compound formation was 8868 (Figure 3A). In both cases, the most abundant motifs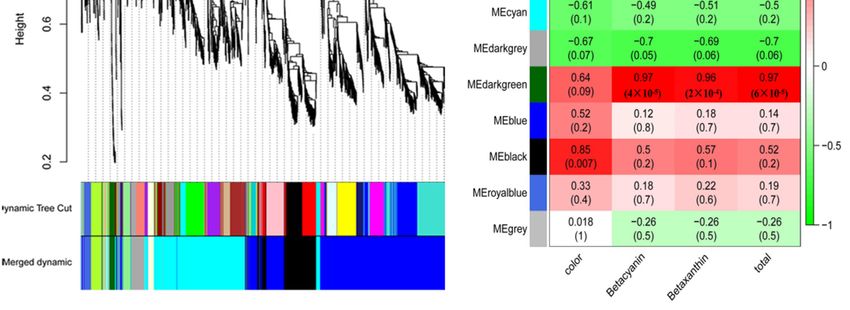
Int. J. Mol. Sci. 2020, 21, 3288                                                                      6 of 17

     2.6. SSR and lncRNA Prediction
              A total of 31,169 SSRs were identified in 24,889 genes (38.10%) from ‘Zihonglong’, of which 11,885
        genes contained more than one SSR, and the number of SSRs present in compound formation was
        4472. A total of 53,024 SSRs were identified in 39,793 genes (43.42%) from ‘Jinghonglong’, of which
       18,725 genes contained more than one SSR, and the number of SSRs present in compound formation was
        8868 (Figure 3A). In both cases, the most abundant motifs detected was mono–nucleotides, accounting
        for 41.72% and 40.58% of the total SSRs in ‘Zihonglong’ and ‘Jinghonglong’, respectively, and 4883
       (15.67%) and 6204 (11.70%) di-nucleotides were detected from ‘Zihonglong’ and ‘Jinghonglong’,
Int. J. respectively.    Wexobtained
         Mol. Sci. 2019, 20,  FOR PEER11,650
                                       REVIEWand 11,113 lncRNAs from 65,317 and 91,638 genes in ‘Zihonglong’    7 of 18
        and ‘Jinghonglong’, respectively (Figure 3B). Four of these lncRNAs were up to 3000 nt in ‘Zihonglong’,
       while 18 up to
‘Jinghonglong’,             3000of
                         most   nt which
                                   were investigated  from ‘Jinghonglong’,
                                           were single-isoform               most
                                                                    transcripts   of which were
                                                                                presenting        single-isoform
                                                                                              in both  samples. The
        transcripts   presenting in both samples. The functions
functions of these lncRNAs need to be further characterized.    of these lncRNAs need to be further characterized.

           Figure 3. SSRs and lncRNAs of pitaya pulp. (A), The distribution characteristics of SSRs motifs.
Figure 3. SSRs and lncRNAs of pitaya pulp. (A), The distribution characteristics of SSRs motifs. (B), Venn
          (B), Venn diagram of the number of lncRNAs predicted by Coding-Non-Coding Index (CNCI), pfam,
diagram of the number of lncRNAs predicted by Coding-Non-Coding Index (CNCI), pfam, Plek, and
          Plek, and Coding Potential Calculator (CPC). Note, the number in Figure 3B represents the amount
Coding Potential   Calculator (CPC). Note, the number in Figure 3B represents the amount of lncRNAs.
          of lncRNAs.

     2.7. Genes
2.7. Genes      Involved
            Involved     in Betalain
                      in Betalain    Biosynthesis
                                   Biosynthesis
          Taking
      Taking   intointo  accountthe
                      account      thedifferent
                                        different expression
                                                  expression levels
                                                              levelsofofgenes between
                                                                          genes        ‘Zihonglong’
                                                                                 between             and and
                                                                                           ‘Zihonglong’
    ‘Jinghonglong’, the genes from PacBio sequel were used as the reference dataset. It was shown
‘Jinghonglong’, the genes from PacBio sequel were used as the reference dataset. It was shown that
     that 44,109 differentially expressed genes (DEGs) were found between ‘Zihonglong’ and ‘Jinghonglong’
44,109 differentially expressed genes (DEGs) were found between ‘Zihonglong’ and ‘Jinghonglong’
     during four development stages, among which, most DEGs were investigated in R2_vs_W2, containing
during four development stages, among which, most DEGs were investigated in R2_vs_W2,
containing 11,317 up-regulated and 4788 down-regulated DEGs respectively (Figure 4A). The heat
map of all DEGs in both ‘Zihonglong’ and ‘Jinghonglong’ was created, and the four developmental
stages of ‘Zihonglong’ and ‘Jinghonglong’ were clustered, in both cultivars. The stage of 22 DPA
and the 25 DPA were grouped together, and the stage of the 28 DPA and the 30 DPA were grouped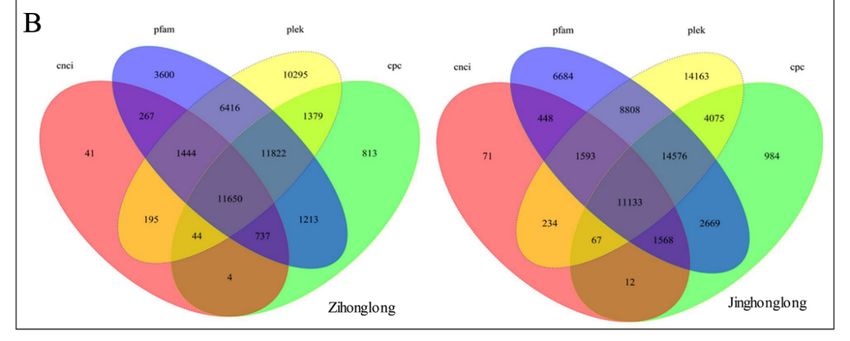
Int. J. Mol. Sci. 2020, 21, 3288                                                                            7 of 17

       11,317 up-regulated and 4788 down-regulated DEGs respectively (Figure 4A). The heat map of all
       DEGs in both ‘Zihonglong’ and ‘Jinghonglong’ was created, and the four developmental stages of
      ‘Zihonglong’ and ‘Jinghonglong’ were clustered, in both cultivars. The stage of 22 DPA and the 25 DPA
       were grouped together, and the stage of the 28 DPA and the 30 DPA were grouped together (Figure 4B).
       A total of 13,794 non-redundant DEGs with more than one Fragments Per Kilobase of transcript per
       Million mapped reads (FPKM) value above 10 were used to evaluate the candidate genes involved in
       betalain biosynthesis, and 10 modules were formed through weighted gene co-expression network
       analysis (WGCNA) (Figure 4C–E). Analysis of module-trait relationships revealed that the dark green
       and black modules containing 173 genes (Table S3) were highly correlated with the phenotypic traits of
Int. J.pitaya  fruit.
        Mol. Sci. 2019, 20, x FOR PEER REVIEW                                                               8 of 18

          Figure 4. The identification of DEGs (A), Map of the number of differentially expressed genes;
     Figure
          (B), 4. The identification
               Cluster                 of DEGs
                       map of differentially      (A), Map
                                             expressed       of(C),
                                                         genes; theVisualizing
                                                                    number ofthedifferentially
                                                                                  gene networkexpressed    genes; (B),
                                                                                                 using a heatmap
     Cluster
          plot.mapThe of differentially
                      heatmap            expressed
                                depicts the           genes;
                                            topological       (C), matrix
                                                          overlap  Visualizing
                                                                          (TOM)the geneallnetwork
                                                                                among      genes inusing   a heatmap
                                                                                                     the analysis.
     plot.(D),
           TheModule-trait
                  heatmap depicts   the topological
                              associations. Each rowoverlap     matrix
                                                        corresponds  to a(TOM) among
                                                                          module       all genes
                                                                                 characteristic   in the
                                                                                                gene     analysis. (D),
                                                                                                     (eigengene),
          and each column
     Module-trait            corresponds
                      associations.  Eachtorow
                                             a trait.
                                                 corresponds to a module characteristic gene (eigengene), and
     each column corresponds to a trait.

     To validate the Illumina RNA-Seq transcriptome results, DEGs involved in the biosynthesis of
betalain as well as DEGs annotated in Nr or Nt and expressed highly in red pulp but with an FPKM
value less than 1 in white pulp were selected from the 173 DEGs as a candidate gene. Subsequently,
the 10 DEGs (Table 2) were selected for measurement of transcript levels by qRT-PCR. Furthermore,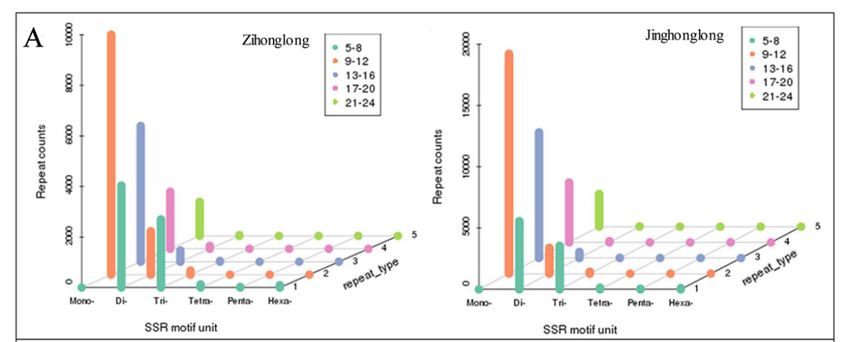
Int. J. Mol. Sci. 2020, 21, 3288                                                                              8 of 17

       To validate the Illumina RNA-Seq transcriptome results, DEGs involved in the biosynthesis of
 betalain as well as DEGs annotated in Nr or Nt and expressed highly in red pulp but with an FPKM
value less than 1 in white pulp were selected from the 173 DEGs as a candidate gene. Subsequently,
 the 10 DEGs (Table 2) were selected for measurement of transcript levels by qRT-PCR. Furthermore,
 a comparison between the value of qRT-PCR and that of FPKM was conducted. As illustrated in
 Figure 5, in general, the quantitative analysis results of the HpDODA1, HpDODA2, HpCYP76AD4,
HpNAC, HpGSTs, and HpCYP704C1 were consistent with that of the FPKM values. The expression
 level of HpDODA1, HpDODA2, HpCYP76AD4, HpNAC, HpGSTs, and HpCYP704C1 in the pulp of
‘Zihonglong’ increased dramatically at the coloring stage. The qRT-PCR value of HpDODA1 in
‘Zihonglong’ pulp was 14.16 to 936.34 times than that in ‘Jinghonglong’, and that of HpDODA2,
HpCYP704C1, and HpGSTs were a 23.95 to 1146.59, 0.80 to 3.48-fold change, and 3.56 to 42.74 times
 than in ‘Jinghonglong’, respectively. Moreover, the amount of change in the 4 genes increased with the
 development of the fruit. The qRT-PCR values of HpBPE in ‘Zihonglong’ pulp were higher than that in
‘Jinghonglong’, and the changes were 4.00 to 1.25-fold. The qRT-PCR value of HpBPE in ‘Jinghonglong’
pulp exhibited a significant increase tendency with the development of the fruit, while the FPKM values
 of all four developmental stages were zero. For HpCYP76AD4, the qRT-PCR value in ‘Zihonglong’
was 0.99 to 2997.21 times than that in ‘Jinghonglong’ and the maximal value change appeared at 25
 DPA, at the pulp color-broken stage. The qRT-PCR value of HpNAC in ‘Zihonglong’ pulp was 7.92
 to 10.52 times that of ‘Jinghonglong’. Compared to ‘Jinghonglong’, the qRT-PCR value of HpFAR
 in the pulp of ‘Zihonglong’ was 0.01 to 0.13 times during 22 to 25 DPA. However, this increased
 significantly, and became higher than that in ‘Jinghonglong’ pulp from 28 to 30 DPA; the value was
1.50–2.12 times. The qRT-PCR values of HpSTK and HpVPP1 in pulp of ‘Zihonglong’ were lower than
 that of ‘Jinghonglong’ at the four development stages; the former was 0.29 to 0.77 and the latter was
 0.48 to 0.72 times, respectively, which was inconsistent with the variation of FPKM value.

                                       Table 2. The list of 10 DEGs used for qRT-PCR.

               Gene                        Gene ID                  Gene                  Gene ID
          HpDODA1                  i1_LQ_R_c96099/f1p0/1004       HpNAC           i1_HQ_R_c77544/f11p0/1295
          HpDODA2                   i1_HQ_R_c9184/f4p0/1375     HpCYP704C1         i1_LQ_R_c24611/f1p0/1636
         HpCYP76AD4                i1_HQ_R_c13003/f5p0/1979       HpFAR            i1_HQ_R_c76874/f3p0/1664
           HpGSTs                  i1_LQ_R_c13451/f1p0/1160       HpSTK             i2_HQ_R_c697/f6p0/2233
           HpBPE                    i1_LQ_R_c9617/f1p0/1492       HpVPP1            i2_HQ_R_c679/f4p0/2556
Int. J. Mol. Sci. 2020, 21, 3288 9 of 17
Int. J. Mol. Sci. 2019, 20, x FOR PEER REVIEW 10 of 18
Figure 5. qRT-PCR of candidate gene involved in betalain biosynthesis. (A), HpDOD1; (B), HpDODA2;
Figure 5. qRT-PCR of candidate gene involved in betalain biosynthesis. (A), HpDOD1; (B),
(C), HpCYP76AD4; (D), HpGSTs; (E), HpBPE; (F), HpNAC; (G), HpCYP704C1; (H), HpFAR; (I), HpSTK;
HpDODA2; (C), HpCYP76AD4; (D), HpGSTs; (E), HpBPE; (F), HpNAC; (G), HpCYP704C1; (H),
(J), HpVPP1. Note,
HpFAR; (I), the colors
HpSTK; in the graph
(J), HpVPP1. Note, indicate theinmagnitude
the colors the graph of gene expression
indicate in the
the magnitude ofsample.
gene
Red indicates that the gene is highly expressed in the sample, yellow indicates that the gene expression
is middle, and the blue indicates that the gene expression is low.Int. J. Mol. Sci. 2020, 21, 3288 10 of 17
3. Discussion
Fruit is a major source of plant-derived pigments, and the formation of pigment is closely related
to the process of fruit development. The L* values decreased and the a*, b* values increased with apple
fruit development. A high anthocyanin content may lead to a decrease in fruit brightness [29]. In the
present work, the appearance of pigments in ‘Zihonglong’ pulps and the variation characteristic of color
parameter was consistent with that of apple [29]. Notably, the color parameters varied predominantly
at 25 DPA in the red pup cultivar while the fruit pulp was in the color initiation stage, suggesting that
the stage was a crucial period for the accumulation of red pigment.
The proportion of full-length transcripts from Illumina RNA-Seq assembly is very small,
and inaccuracy in gene structure characterization resulting from mis-assembly is a common problem,
which is exacerbated in the species without a reference genome sequence for the prediction of gene
models [30]. Recently, SMRT sequel as a new third-generation sequencing (TGS) platform was carried
out by PacBio sequencing. Non-assembled long-read transcripts with low error rate (10%) can be
generated by SMRT sequel, and the error rate can be overcome by correction of Illumina RNA-Seq [31].
For example, the mapping rate of long reads in maize can be increased from 11.6 to 99.1% after
correction with Illumina read [22]. However, thus far, there has been no report of reference genome
sequence or SMRT sequence on pitaya. In the present case, 65,312 and 91,638 genes (non-redundant
reads) were generated by SMRT from pooled-stage pulp and corrected by Illumina RNA-Seq. The mean
length of the SMRT gene is much longer than that of unigene assembled from Illumina RNA-Seq
reads. The pitaya genes had the highest number of hits to the B. vulgaris (50.63%), and the species
distribution with the greatest number of H. polyrhizus was Vitis vinifera (50.1%) by Illumina RNA-Seq [6].
Both pitaya and B. vulgaris belong to the Caryophyllales order. Therefore, the result illustrates that
SMRT data are of higher quality than data from Illumina RNA-Seq.
Transcriptome reconstruction and annotation has been improved significantly with the
development of sequencing techniques [30]. Long-read sequencing can provide an efficient reference
sequence for plants without a reference genome [17]. Different transcription isoforms in pitaya pulp
were detected without a reference genome. A total of 17.42% and 16.97% of genes in the red and
white pulp were identified, respectively, including more than 10 isoforms in red pulp (516, 0.79%) in
comparison with that of the white pulp (767, 0.84%). SSR markers were considered as an efficient
approach to identify genetic diversity in pitaya germplasms and were employed to determine the
genetic relationships among pitaya species [32]. The identified SSRs from the SMRT data can facilitate
the identification of genetic diversity in pitaya.
LncRNAs are key regulatory molecules that regulate gene expression and have become a hot topic
in biology [33,34]; 11,046 lncRNAs were predicted in Salvia miltiorrhiza [21]. In maize, 867 transcripts
with a mean length of 1.1 kb were identified as novel high-confidence lncRNAs [22]. A total of 417 and
531 lncRNAs were identified in sweet potato and I. trifida, respectively [33], 223 and 205 lncRNAs were
obtained in the leaf and root of Astragalus membranaceus, respectively [30], 2426 transcript sequences
including 1220 non-ORF transcript sequences candidate lncRNAs were identified in sugarcane [25].
In the present work, 11,650 and 11,113 lncRNAs were identified with four analytical methods informing
the red and white pulp, respectively, which is more than from other documented species. However,
their functions require further investigations.
Compared with many other analysis methods, WGCNA has the advantages of summarizing
and standardizing the methods and functions of integrated R packages [35]. Moreover, combining
the WGCNA method and RNA-Seq data can be used to better mine the genes and transcription
factors related to the traits [36]. In this study, the WGCNA method was used for the first time in
pitaya fruit, and the modules related to pigmentation traits were identified. Betelain, an important
pigment in most Caryophyllales plants, can be used as a natural colorant in food [37], cosmetics,
and pharmaceuticals [38]. Intensive attempts have been focused on the betalain biosynthesis and
genes function, and much more betalain-related candidate genes, such as TYR [39,40], BvMYB1 [15],Int. J. Mol. Sci. 2020, 21, 3288 11 of 17
CYP76AD1 [10], and BvDODA1 [13] were identified. Even so, research regarding betalain-related
genes, especially for pitaya, has thus far been limited.
Betalamic acid is the chromophore molecule of both betacyanins and betaxanthins, and cDOPA as
well as its derivatives are essential to produce betacyanin [41]. The formation of betalamic acid and
cDOPA are crucial in betacyanin synthesis; the absence of betalamic acid may block the production
of betalain. In white pulp cultivar, neither red betacyanins nor yellow betaxanthins were detected in
the pulp. Hence, we hypothesized that CYP76AD and DODA were crucial genes to the formation of
betalain. The expression level of HpCYP76AD4, HpDODA1, and HpDODA2 were remarkably higher in
the red pulp than that in the white pulp. Meanwhile, another cytochrome p450, HpCYP704C1 was
identified, and both the expression level and change variation between the two samples was less
than that of HpCYP76AD4. At all of the four development stages, the expression level in the pulp
of ‘Zihonglong’ was significantly higher than that of ‘Jinghonglong’. Therefore, the three genes may
facilitate the biosynthesis of betalain in pitaya pulp.
BvMYB1 is currently the only known betalain-related transcription factor, which has an essential
role as a positive regulator of betalain biosynthesis through activation of the CYP76AD1 and BvDODA1
genes [7]. In apple, two NAC TF of MdNAC029 and MdNAC52 were confirmed to be participating in
anthocyanin biosynthesis. MdNAC029 may positively regulate anthocyanin accumulation by directly
promoting the expression of MdMYB1 gene [42]. MdNAC52 binds to the promoters of MdMYB9 and
MdMYB11 to promote anthocyanin and PA biosynthesis, and directly regulates LAR to modulate PA
metabolism [43]. MdGSTF6 was an anthocyanin transporter, and the knockdown of MdGSTF6 by
RNA interference inhibited anthocyanin accumulation in apple seedlings [44]. These TF and genes
involved in the biosynthesis of anthocyanin were verified in apple. The expression level of HpNAC
and HpGSTs were consistent with the variation of color in pitaya pulp; therefore, they may participate
in the biosynthesis of betalain in pitaya pulp.
In summary, full-length transcripts of pitaya pulp that are generated from SMRT with Illumina
RNA-seq provide an efficient process to the research of genes and facilitate the identification of additional
betalain-related genes. HpCYP76AD4, HpDODA1, HpDODA2, and HpCYP76AD4 involved in betalain
biosynthesis were identified in pitaya fruit, and HpNAC and HpGSTs might participate in the regulation
of betalain in pitaya fruit. Furthermore, HpNAC may play a role in the regulation of betalain synthesis in
coordination Int.
with MYB TF (Figure 6), which provides new insights into betalain synthesis
J. Mol. Sci. 2019, 20, x FOR PEER REVIEW
in pitaya.
13 of 18
Figure 6. The putative betalain biosynthesis pathway from pitaya fruit. Note, the genes identified in
Figure 6. The putative betalain biosynthesis pathway from pitaya fruit. Note, the genes identified in red
red words were derived from our pitaya pulp data. The solid line arrows represent the common
words were derived frompathway
biosynthetic our pitaya pulpand
of betalain, data. The solid
the dotted line arrows
line arrows designaterepresent
reactions of the common biosynthetic
an alternative
pathway of betalain, and the dotted line arrowspathway. designate reactions of an alternative pathway.
4. Material and Methods
4.1. Plant Materials
The seedlings of H. polyrhizus cv. Zihonghlong and H. undatus cv. Jinghonglong, cultivated in
Langdang fruit professional cooperative (Luodian, Guizhou province, China.), were used in this
study. All plants were planted in 2009. Three hundred flowers blooming on the same day wereInt. J. Mol. Sci. 2020, 21, 3288 12 of 17
4. Material and Methods
4.1. Plant Materials
The seedlings of H. polyrhizus cv. Zihonghlong and H. undatus cv. Jinghonglong, cultivated in
Langdang fruit professional cooperative (Luodian, Guizhou province, China.), were used in this study.
All plants were planted in 2009. Three hundred flowers blooming on the same day were marked
with tags in 2016, and thirty labelled healthy fruits of each four developmental stages from 29th June
to 7th July (22nd, 25th, 28th, and 30th after anthesis) were collected randomly from different plants
(Figure 1A). All samples intended for RNA extraction were fresh-frozen in liquid nitrogen immediately
after collection and stored at −80 ◦ C until use.
4.2. Measurements of Color and Betalain
For color analyses, L*, a*, and b* of pitaya pulp were measured with CR-10 Chromaportable
colorimeter (Konica Minolta Sensing, Inc., Osaka, Japan). All determinations were performed in
duplicate. L* value represented the relative lightness of colors ranging from 0 (black) to 100 (white).
Values of a* and b* ranged from −60 to 60, where a* was negative for green color and positive for red
color, and b* was negative for blue and positive for yellow [29,45]. The concentration of betacyanin
and betaxanthin was detected according to Wu et al. [46].
4.3. RNA Sample Preparation
Total RNA was isolated using the RNeasy Plus Mini Kit (Qiagen, Valencia, CA, USA), respectively.
The purity and concentration of RNA were measured using the NanoDrop ND-1000 spectrophotometer
(NanoDrop Technologies, Rockland, DE, USA) with an OD260/280 reading. The integrity of the RNA
was determined on agarose gel electrophoresis with the Agilent 2100 Bioanalyzer (Agilent Technologies,
CA, USA).
4.4. Library Preparation and SMRT Sequencing
The libraries were produced and sequenced by Shanxi Breeding Biotechnologies Technology Co.,
Ltd. First, mRNA was enriched by Oligo (dT) magnetic beads, then the enriched mRNA was reverse
transcribed into full length 1st strand cDND using Clontech SMARTer PCR cDNA Synthesis Kit. PCR
cycle optimization was used to determine the optimal amplification cycle number for the downstream
large-scale application. The optimized cycle number was used to generate double-stranded cDNA,
followed optional size (>4 kb) selection using the BluePippinTM for combined SMRT bell library.
Full length cDNAs were performed, DNA damage repaired, end repaired, and ligated to sequencing
adapters, and then digested with exonuclease. Qualified libraries were sequenced on the PacBio Sequel
(Pacific Bio-science Inc., CA, USA) platform according to the effective concentration and data output
requirements of the library.
4.5. Preprocessing of SMRT Reads
The subreads were acquired from raw sequencing reads using the SMRT Link v5.0 (minLength = 200,
minReadScore = 0.75) pipeline supported by Pacific Biosciences, and CCS reads were extracted out of subreads’
BAM file. Through RS_IsoSeq (minPasses = 1, minPredicted Accuracy = 0.8), CCS reads were classified
into full-length non-chimeric (FLNC), non-full-length (NFL) based on cDNA primers and polyA tail signal.
Subsequently, the FLNC reads were clustered by Iterative Clustering for Error Correction (ICE) software to
generate the cluster consensus isoforms [47]. Then, NFL reads were used to polish the above obtained cluster
consensus isoforms by Quiver (www.pacbiodevnet.com/Quiver) to finally obtain the FLNC high quality
polished consensus sequences (accuracy ≥99%). After being corrected by SGS using LoRDEC, non-redundant
high-quality full-length transcripts were generated by CD-HIT (c = 0.99) for further analysis [48].Int. J. Mol. Sci. 2020, 21, 3288 13 of 17
4.6. Functional Annotation of Genes
Non-redundant transcript sequence as genes obtained after CD-HIT deduplication were grouped
and mapped to nine protein and nucleic acid database to obtain the annotation information of the gene.
These databases included NR, Nt, Swissprot [49], GO [50], COG [51], KOG, Pfam [52], TrEMBL [49],
and KEGG [53]. GO annotation was analyzed by Blast2GO software with Nr annotation results of
genes. Genes ranking the first 20 highest score and no shorter than 33 HSPs (High-Scoring Segment
Pair) hits were selected to conduct Blast2GO analysis. Then, functional classification of genes was run
using WEGO software.
4.7. SSR Detection
The MicroSAtellite identification tool (MISA; http://pgrc.ipk-gatersleben.de/misa/) was employed
for microsatellite mining in the whole transcriptome. Mononucleotide, dinucleotide, trinucleotide,
tetranucleotide, pentanucleotide, hexanucleotide, and compound SSR were identified by analyzing
transcript sequences.
4.8. lncRNAs Prediction
The coding potential of transcripts were predicted by predictor of long non-coding RNAs and
messenger RNAs based on an improved k-mer scheme (PLEK) [54] and Coding-Non-Coding Index
(CNCI) [55]. Then, transcriptional sequences predicted from PLEK and CNCI were blasted with the
known protein database using Coding Potential Calculator (CPC) [56]. The transcriptional sequences
predicted by PLEK, CNCI, and CPC software underwent hmmscan homologous search with Pfam [52]
database, and finally the LncRNA sequences were obtained.
4.9. Next Generation Sequencing
Total RNA (5µg) was digested by using DNase I (NEB, Frankfurt, Germany). The sample was
purified with Agencourt RNAClean XP Beads and fragmented into 130–170 nt. First-strand cDNA
was generated by First Strand Master Mix and Super Script II reverse transcription (Invitrogen).
Then second-strand cDNA was synthesized using Second Strand Master Mix. After end repairing,
adding A and adaptor ligation, several rounds of PCR amplification with PCR Primer Cocktail and
PCR MasterMix were performed to enrich the cDNA fragments. The final library is quantitated by
using the Agilent 2100 bioanalyzer instrument. The qualified libraries were sequenced pair-end on the
Illumina HiSeq 4000 System.
4.10. Identification of DEGs Involved in Betalain Biosysthensis
Data from Illumina RNA-Seq were mapped to the non-redundant SMRT reference by RSEM
software. The expression abundance of unigene was represented as value of FPKM, and differential
expression gene (FDRInt. J. Mol. Sci. 2020, 21, 3288 14 of 17
concentrations, as well as for significant analysis of color parameters, followed by a Duncan’s multiple
range test at the 5% level (p ≤ 0.05) in SPSS17.0 (SPSS Inc., Chicago, IL, USA).
Supplementary Materials: Supplementary materials can be found at http://www.mdpi.com/1422-0067/21/9/3288/
s1.
Author Contributions: Y.W. analyzed the data and wrote the paper. J.X. provided assistance in conceived and
designed the experiments. X.H. and G.Q. performed the experiment and analyzed the data. K.Y. and Z.W.
provided assistance in data analysis and submission. X.W. reviewed the manuscript and supervised the whole
project. All the authors contributed to discussion and revision of the manuscript. All authors have read and
agreed to the published version of the manuscript.
Funding: The work was funded by the National Natural Science Foundation of China (31760566), as well as
the 2016 Open Foundation from Key Laboratory of Plant Resource Conservation and Germplasm Innovation
in Mountainous Region (Ministry of Education), Our thanks are also extended to the partial grant from the
open funds of the Construction Program of Biology First-class Discipline in Guizhou (GNYL [2017] 009) and
Key Laboratory of Horticulture Plant Biology (MOE).
Acknowledgments: For the access to experimental materials we would like to thank Luodian county Langdang fruit
professional cooperative in Guizhou Province, China, for providing pitaya fruit for the experiment. For the technical
assistance, we would like to thank Biobreeding Biotechnology Corporation (Shanxi, China). Likewise, we would
like to express great gratitude to the anonymous peer review and critical revise for the manuscript improvement.
Conflicts of Interest: The authors declare no conflict of interest. The funding bodies had no role in the design of
the study and no role in the collection, analysis, and interpretation of data or in writing the manuscript
References
1. Suh, D.H.; Lee, S.; Heo, D.Y.; Kim, Y.S.; Cho, S.M.; Lee, S.; Lee, C.H. Metabolite profiling of red and white
pitayas (Hylocereus polyrhizus and Hylocereus undatus) for comparing betalain biosynthesis and antioxidant
activity. J. Agric. Food Chem. 2014, 62, 8764–8771. [CrossRef]
2. Bellec, F.L.; Vaillant, F.; Imbert, E. Pitahaya (Hylocereus spp.): A new fruit crop, a market with a future. Fruits
2006, 61, 237–250. [CrossRef]
3. Stintzing, F.C.; Schieber, A.; Carle, R. Betacyanins in fruits from red-purple pitaya, Hylocereus polyrhizus
(Weber) Britton & Rose. Food Chem. 2002, 77, 101–106.
4. Polturak, G.; Heining, U.; Grossman, N.; Battat, M.; Leshkowitz, D.; Malisky, S.; Rogachev, I.; Aharoni, A.
Transcriptome and Metabolic Profiling Provides Insights into Betalain Biosynthesis and Evolution in
Mirabilis jalapa. Mol. Plant. 2018, 11, 189–204. [CrossRef] [PubMed]
5. Gandiaherrero, F.; Cabanes, J.; Escribano, J.; Garciacarmona, F.; Jimenezatienzar, M. Encapsulation of the
Most Potent Antioxidant Betalain in Edible Matrixes as Powders of Different Colors. J. Agric. Food Chem.
2013, 61, 4294–4302. [CrossRef]
6. Hua, Q.Z.; Chen, C.J.; Chen, Z.; Chen, P.K.; Ma, Y.W.; Wu, J.Y.; Zheng, J.; Hu, G.B.; Qin, Y.H. Transcriptomic
Analysis Reveals Key Genes Related to Betalain Biosynthesis in Pulp Coloration of Hylocereus polyrhizus.
Front. Plant Sci. 2016, 6, 1179.
7. Polturak, G.; Aharoni, A. “La Vie en Rose”: Biosynthesis, sources and applications of betalain pigments.
Mol. Plant. 2018, 11, 7–22. [CrossRef]
8. Gandiaherrero, F.; Garciacarmona, F. Biosynthesis of betalains: Yellow and violet plant pigments.
Trends Plant Sci. 2013, 18, 334–343. [CrossRef]
9. Sunnadeniya, R.; Bean, A.; Brown, M.; Akhavan, N.; Hatlestad, G.; Gonzalez, A.; Symonds, V.V.; Lloyd, A.M.
Tyrosine Hydroxylation in Betalain Pigment Biosynthesis Is Performed by Cytochrome P450 Enzymes in
Beets (Beta vulgaris). PLoS ONE 2016, 11, e0149417.
10. Hatlestad, G.J.; Sunnadeniya, R.; Akhavan, N.; Gonzalez, A.; Goldman, I.L.; Mcgrath, J.M.; Lloyd, A.M.
The beet R locus encodes a new cytochrome P450 required for red betalain production. Nat. Genet. 2012, 44,
816–820. [CrossRef]
11. Girod, P.A.; Zryd, J.P. Biogenesis of betalains-purification and partial characterization of dopa 4,5-dioxygenase
from Amanita muscaria. Phytochemistry 1991, 30, 169–174. [CrossRef]
12. Christinet, L.; Burdet, F.R.X.; Zaiko, M.; Hinz, U.; Zryd, J.P. Characterization and functional identification of
a novel plant 4,5-extradiol dioxygenase involved in betalain pigment biosynthesis in Portulaca grandiflora.
Plant Physiol. 2004, 134, 265–274. [CrossRef] [PubMed]Int. J. Mol. Sci. 2020, 21, 3288 15 of 17
13. Chung, H.H.; Schwinn, K.E.; Ngo, H.M.; Lewis, D.H.; Massey, B.; Calcott, K.E.; Crowhurst, R.; Joyce, D.C.;
Gould, K.S.; Davies, K.M.; et al. Characterisation of betalain biosynthesis in Parakeelya flowers identifies
the key biosynthetic gene DOD as belonging to an expanded LigB gene family that is conserved in
betalain-producing species. Front. Plant Sci. 2015, 6, 499. [CrossRef] [PubMed]
14. Sasaki, N.; Adachi, T.; Koda, T.; Ozeki, Y. Detection of UDP-glucose: Cyclo-DOPA 5-O-glucosyltransferase
activity in four o’clocks (Mirabilis jalapa L.). FEBS Lett. 2004, 568, 159–162. [CrossRef] [PubMed]
15. Hatlestad, G.J.; Akhavan, N.A.; Sunnadeniya, R.M.; Elam, L.; Cargile, S.; Hembd, A.; Gonzalez, A.;
McGrath, J.M.; Lloyd, A.M. The beet Y locus encodes an anthocyanin MYB-like protein that activates the
betalain red pigment pathway. Nat. Genet. 2015, 47, 92–96. [CrossRef]
16. Polturak, G.; Breitel, D.; Grossman, N.; Sarrionperdigones, A.; Weithorn, E.; Pliner, M.; Orzaez, D.; Granell, A.;
Rogachev, I.; Aharoni, A. Elucidation of the first committed step in betalain biosynthesis enables the
heterologous engineering of betalain pigments in plants. New Phytologist. 2016, 210, 269–283. [CrossRef]
17. Ning, G.G.; Chen, X.; Luo, P.; Liang, F.; Wang, Z.; Yu, G.L.; Li, X.; Wang, D.P.; Bao, M.Z. Hybrid sequencing
and map finding (HySeMaFi): Optional strategies for extensively deciphering gene splicing and expression
in organisms without reference genome. Sci. Rep. 2017, 7, 43793. [CrossRef]
18. Chen, S.Y.; Deng, F.L.; Jia, X.B.; Li, C.; Lai, S.J. A transcriptome atlas of rabbit revealed by PacBio
single-molecule long-read sequencing. Sci. Rep. 2017, 7, 7648. [CrossRef]
19. Rhoads, A.; Au, K.F. PacBio sequencing and its applications. Genom. Proteom. Bioinf. 2015, 213, 278–289.
[CrossRef]
20. Steijger, T.; Abril, J.F.; Engström, P.G.; Kokocinski, F.; Consortium, T.R.; Hubbard, T.J.; Guigó, R.; Harrow, J.;
Bertone, P. Assessment of transcript reconstruction methods for RNA-seq. Nat. Methods 2013, 10, 1177–1184.
[CrossRef]
21. Xu, Z.C.; Peters, R.J.; Weirather, J.L.; Luo, H.M.; Liao, B.S.; Zhang, X.; Zhu, Y.J.; Ji, A.J.; Zhang, B.; Hu, S.N.;
et al. Full-length transcriptome sequences and splice variants obtained by a combination of sequencing
platforms applied to different root tissues of Salvia miltiorrhiza and tanshinone biosynthesis. Plant J. 2015,
82, 951–961. [CrossRef] [PubMed]
22. Wang, B.; Tseng, E.; Regulski, M.; Clark, T.A.; Hon, T.; Jiao, Y.P.; Lu, Z.Y.; Olson, A.; Stein, J.C.; Ware, D.
Unveiling the complexity of the maize transcriptome by single-molecule long-read sequencing. Nat. Commun.
2016, 7, 11708. [CrossRef] [PubMed]
23. Abdelghany, S.E.; Hamilton, M.; Jacobi, J.L.; Ngam, P.; Devitt, N.P.; Schilkey, F.D.; Benhur, A.; Reddy, A.S.
A survey of the sorghum transcriptome using single-molecule long reads. Nat. Commun. 2016, 7, 11706.
[CrossRef] [PubMed]
24. Wang, T.T.; Wang, H.Y.; Cai, D.W.; Gao, Y.B.; Zhang, H.X.; Wang, Y.S.; Lin, C.T.; Ma, L.Y.; Gu, L.F.
Comprehensive profiling of rhizome-associated alternative splicing and alternative polyadenylation in moso
bamboo (Phyllostachys edulis). Plant J. 2017, 91, 684–699. [CrossRef]
25. Hoang, N.V.; Furtado, A.; Mason, P.J.; Marquardt, A.; Kasirajan, L.; Thirugnanasambandam, P.P.; Botha, F.C.;
Henry, R.J. A survey of the complex transcriptome from the highly polyploid sugarcane genome using
full-length isoform sequencing and de novo assembly from short read sequencing. BMC Genom. 2017, 18, 395.
[CrossRef]
26. Li, Y.P.; Wei, W.; Feng, J.; Luo, H.F.; Pi, M.Y.; Liu, Z.C.; Kang, C.Y. Global identification of alternative splicing
via comparative analysis of SMRT- and Illumina based RNA-seq in strawberry. Plant J. 2017, 90, 164–176.
[CrossRef]
27. Li, Y.P.; Dai, C.; Hu, C.G.; Liu, Z.C.; Kang, C.Y. Genome re-annotation of the wild strawberry Fragaria vesca
using extensive Illumina- and SMRT-based RNA-seq datasets. DNA Res. 2018, 25, 61–70. [CrossRef]
28. Ma, J.E.; Jiang, H.Y.; Li, L.M.; Zhang, X.J.; Li, H.M.; Li, G.Y.; Mo, D.Y.; Chen, J.P. SMRT sequencing of the
full-length transcriptome of the Sunda pangolin (Manis javanica). Gene 2019, 692, 208–216. [CrossRef]
29. Liu, Y.L.; Che, F.; Wang, L.X.; Meng, R.; Zhang, X.J.; Zhang, Z.Y. Fruit Coloration and Anthocyanin
Biosynthesis after Bag Removal in Non-Red and Red Apples (Malus×domestica Borkh). Molecules 2013, 18,
1549–1563. [CrossRef]
30. Li, J.; Harata-Lee, Y.; Denton, M.D.; Feng, Q.J.; Rathjen, J.R.; Qu, Z.P.; Adelson, D.L. Long read reference
genome-free reconstruction of a full length transcriptome from Astragalus membranaceus reveals transcript
variants involved in bioactive compound biosynthesis. Cell Discov. 2017, 3, 17031. [CrossRef]Int. J. Mol. Sci. 2020, 21, 3288 16 of 17
31. An, D.; Cao, H.X.; Li, C.S.; Humbeck, K.; Wang, W.Q. Isoform Sequencing and State-of-Art Applications for
Unravelling Complexity of Plant Transcriptomes. Genes 2018, 9, 43. [CrossRef] [PubMed]
32. Pan, L.M.; Fu, J.X.; Zhang, R.; Qin, Y.H.; Lu, F.; Jia, L.L.; Hu, Q.L.; Liu, C.M.; Haung, L.F.; Liang, G.D. Genetic
diversity among germplasms of Pitaya based on SSR markers. Sci. Hortic. 2017, 225, 171–176. [CrossRef]
33. Luo, Y.H.; Ding, N.; Shi, X.; Wu, Y.X.; Wang, R.Y.; Pei, L.Q.; Xu, R.Y.; Cheng, S.; Lian, Y.Y.; Gao, J.Y.; et al.
Generation and comparative analysis of full-length transcriptomes in sweet potato and its putative wild
ancestor I. trifida. BioRxiv 2017, 30, 112425.
34. Jia, D.; Wang, Y.X.; Liu, Y.H.; Hu, J.; Guo, Y.Q.; Gao, L.L.; Ma, R.Y. SMRT sequencing of full-length
transcriptome of flea beetle Agasicles hygrophila (Selman and Vogt). Sci. Rep. 2018, 8, 2197. [CrossRef]
35. Langfelder, P.; Horvath, S. Wgcna: An R package for weighted correlation network analysis. BMC Bioinform.
2008, 9, 559. [CrossRef]
36. Yuan, Y.D.; Zhang, B.; Tang, X.G.; Zhang, J.C.; Jie Lin, J. Comparative Transcriptome Analysis of Different
Dendrobium Species Reveals Active Ingredients-Related Genes and Pathways. Int. J. Mol. Sci. 2020, 21, 861.
[CrossRef]
37. Wybraniec, S.; Michalowski, T. New Pathways of Betanidin and Betanin Enzymatic Oxidation. J. Agric. Food Chem.
2011, 59, 9612–9622. [CrossRef]
38. Esatbeyoglu, T.; Wagner, A.E.; Schinikerth, V.B.; Rimbach, G. Betanin-A food colorant with biological activity.
Mol. Nutr. Food Res. 2015, 59, 36–47. [CrossRef]
39. Steiner, U.; Schliemann, W.; BoÈhm, H.; Strack, D. Tyrosinase involved in betalain biosynthesis of higher
plants. Planta 1999, 208, 114–124. [CrossRef]
40. Lopeznieves, S.; Yang, Y.; Timoneda, A.; Wang, M.M.; Feng, T.; Smith, S.A.; Brockington, S.F.; Maeda, H.
Relaxation of tyrosine pathway regulation underlies the evolution of betalain pigmentation in Caryophyllales.
New Phytol. 2018, 217, 896–908. [CrossRef]
41. Tanaka, Y.; Sasaki, N.; Ohmiya, A. Biosynthesis of plant pigments: Anthocyanins, betalain and carotenoids.
Plant J. 2008, 54, 733–749. [CrossRef] [PubMed]
42. An, J.P.; Song, L.Q.; Zhao, L.L.; You, C.X.; Wang, X.F.; Hao, Y.J. Overexpression of MdNAC029 Promotes
Anthocyanin Accumulation in Apple Calli. Acta Hortic. Sinica 2019, 45, 845–854.
43. Sun, Q.G.; Jiang, S.H.; Zhang, T.L.; Xu, H.F.; Fang, H.C.; Zhang, J.; Su, M.Y.; Wang, Y.C.; Zhang, Z.Y.;
Wang, N.; et al. Apple NAC transcription factor MdNAC52 regulates biosynthesis of anthocyanin and
proanthocyanidin through MdMYB9 and MdMYB11. Plant Sci. 2019, 289, 110286. [CrossRef] [PubMed]
44. Jiang, H.S.; Chen, M.; He, N.B.; Chen, X.L.; Wang, N.; Sun, Q.G.; Zhang, T.L.; Xu, H.F.; Fang, H.C.; Wang, Y.C.;
et al. MdGSTF6, activated by MdMYB1, plays an essential role in anthocyanin accumulation in apple.
Hortic. Res. 2019, 6. [CrossRef]
45. McGuire, R.G. Reporting of objective color measurements. HortScience 1992, 27, 1254–1255. [CrossRef]
46. Wu, Y.W.; Xu, J.; He, Y.Z.; Shi, M.Y.; Han, X.M.; Li, W.Y.; Zhang, X.W.; Wen, X.P. Metabolic Profiling of Pitaya
(Hylocereus polyrhizus) during Fruit Development and Maturation. Molecules 2019, 24, 1114. [CrossRef]
47. Salmela, L.; Rivals, E. LoRDEC: Accurate and efficient long read error correction. Bioinformatics 2014, 30,
3506–3514. [CrossRef]
48. Fu, L.M.; Niu, B.F.; Zhu, Z.W.; Wu, S.T.; Li, W.Z. CD-HIT: Accelerated for clustering the next-generation
sequencing data. Bioinformatics 2012, 28, 3150. [CrossRef]
49. Amos, B.; Rolf, A. The SWISS-PROT protein sequence database and its supplement TrEMBL in 2000.
Nucleic Acids Res. 2000, 28, 45–48.
50. Ashburner, M.; Ball, C.A.; Blake, J.A.; Botstein, D.; Butler, H.; Cherry, J.M.; Davis, A.D.; Dolinski, K.;
Dwight, S.S.; Eppig, J.T.; et al. Gene Ontology: Tool for the unification of biology. Nat. Genet. 2000, 25, 25–29.
[CrossRef]
51. Tatusov, R.L.; Fedorova, N.D.; Jackson, J.D.; Jacobs, A.R.; Kiryutin, B.; Koonin, E.V.; Krylov, D.M.;
Mazumder, R.; Mekhedov, S.L.; Nikolskaya, A.N.; et al. The COG database: An updated version includes
eukaryotes. BMC Bioinform. 2003, 4, 41. [CrossRef] [PubMed]
52. Finn, R.D.; Coggill, P.; Eberhardt, R.Y.; Eddy, S.R.; Mistry, J.; Mitchell, A.L.; Potter, S.C.; Punta, M.; Qureshi, M.;
Sangrador-Vegas, A.; et al. The Pfam protein families database: Towards a more sustainable future.
Nucleic Acids Res. 2016, 44, 279–285. [CrossRef] [PubMed]
53. Kanehisa, M.; Goto, S.; Kawashima, S.; Okuno, Y.; Hattori, M. The KEGG resource for deciphering the
genome. Nucleic Acids Res. 2004, 32. [CrossRef] [PubMed]Int. J. Mol. Sci. 2020, 21, 3288 17 of 17
54. Li, A.M.; Zhang, J.Y.; Zhou, Z.Y. PLEK: A tool for predicting long non-coding RNAs and messenger RNAs
based on an improved k-mer scheme. BMC Bioinform. 2014, 15, 311. [CrossRef]
55. Sun, L.; Luo, H.T.; Bu, D.; Zhao, G.G.; Yu, K.T.; Zhang, C.H.; Liu, Y.N.; Chen, R.S.; Zhao, Y. Utilizing sequence
intrinsic composition to classify protein-coding and long non-coding transcripts. Nucleic Acids Res. 2013, 41,
e166. [CrossRef] [PubMed]
56. Kong, L.; Zhang, Y.; Ye, Z.Q.; Liu, X.Q.; Zhao, S.Q.; Wei, L.P.; Gao, G. CPC: Assess the protein-coding potential
of transcripts using sequence features and support vector machine. Nucleic Acids Res. 2007, 36, 345–349.
[CrossRef]
57. Leng, N.; Dawson, J.A.; Thomson, J.A.; Ruotti, V.; Rissman, A.I.; Smits, B.M.G.; Haag, J.D.; Gould, M.N.;
Stewart, R.M.; Kendziorski, C. EBSeq: An empirical Bayes hierarchical model for inference in RNA-seq
experiments. Bioinformatics 2013, 29, 1035–1043. [CrossRef]
58. Nie, Q.; Gao, G.L.; Fan, Q.J.; Qiao, G.; Wen, X.P.; Liu, T.; Peng, Z.J.; Cai, Y.Q. Isolation and characterization of
a catalase gene “HuCAT3” from pitaya (Hylocereus undatus) and its expression under abiotic stress. Gene
2015, 563, 63–71. [CrossRef]
© 2020 by the authors. Licensee MDPI, Basel, Switzerland. This article is an open access
article distributed under the terms and conditions of the Creative Commons Attribution
(CC BY) license (http://creativecommons.org/licenses/by/4.0/).You can also read