Effect of Almond Shell Waste on Physicochemical Properties of Polyester-Based Biocomposites - MDPI
←
→
Page content transcription
If your browser does not render page correctly, please read the page content below
polymers
Article
Effect of Almond Shell Waste on Physicochemical
Properties of Polyester-Based Biocomposites
Marina Ramos 1 , Franco Dominici 2 , Francesca Luzi 2 , Alfonso Jiménez 1 ,
Maria Carmen Garrigós 1, * , Luigi Torre 2 and Debora Puglia 2, *
 1   Department of Analytical Chemistry, Nutrition & Food Sciences, University of Alicante, San Vicente del
     Raspeig, ES-03690 Alicante, Spain; marina.ramos@ua.es (M.R.); alfjimenez@ua.es (A.J.)
 2   Department of Civil and Environmental Engineering, University of Perugia, 05100 Terni, Italy;
     francodominici1@gmail.com (F.D.); francesca.luzi@unipg.it (F.L.); luigi.torre@unipg.it (L.T.)
 *   Correspondence: mc.garrigos@ua.es (M.C.G); debora.puglia@unipg.it (D.P.)

 Received: 15 March 2020; Accepted: 1 April 2020; Published: 6 April 2020

 Abstract: Polyester-based biocomposites containing INZEA F2® biopolymer and almond shell
 powder (ASP) at 10 and 25 wt % contents with and without two different compatibilizers, maleinized
 linseed oil and Joncryl ADR 4400® , were prepared by melt blending in an extruder, followed by
 injection molding. The effect of fine (125–250 m) and coarse (500–1000 m) milling sizes of ASP was
 also evaluated. An improvement in elastic modulus was observed with the addition of< both fine
 and coarse ASP at 25 wt %. The addition of maleinized linseed oil and Joncryl ADR 4400 produced
 some compatibilizing effect at low filler contents while biocomposites with a higher amount of ASP
 still presented some gaps at the interface by field emission scanning electron microscopy. Some
 decrease in thermal stability was shown which was related to the relatively low thermal stability and
 disintegration of the lignocellulosic filler. The added modifiers provided some enhanced thermal
 resistance to the final biocomposites. Thermal analysis by differential scanning calorimetry and
 thermogravimetric analysis suggested the presence of two different polyesters in the polymer matrix,
 with one of them showing full disintegration after 28 and 90 days for biocomposites containing 25 and
 10 wt %, respectively, under composting conditions. The developed biocomposites have been shown
 to be potential polyester-based matrices for use as compostable materials at high filler contents.

 Keywords: almond shell waste; reinforcing; polyester-based biocomposites; physicochemical
 properties; disintegration

1. Introduction
     Almond is characterized by its high nutritional value, although information reported so far mainly
concerns its edible kernel or meat. Other parts also present in the almond fruit are the middle shell,
outer green shell cover or almond hull and a thin leathery layer known as brown skin of meat or
seed coat [1]. Almonds are used as a fruit in snack foods and as ingredients in a variety of processed
foods, especially in bakery and confectionery products. However, almond production generates
large amounts of almond by-products since the nutritional and commercial relevance of almonds
is restricted to the kernel. In particular, almond shell is the name given to the ligneous material
forming the thick endocarp or husk of the almond (Prunus amygdalus L.) tree fruit. It is principally
composed of cellulose (ranging from 29.8 to 50.7 wt %), hemicellulose (from 19.3 to 29.0 wt %) and
lignin (from 20.4 to 50.7 wt %) [1]. This by-product is normally incinerated or dumped without control,
which results in the production of large amounts of waste and pollution [2]. Several researchers
have focused on different alternatives for using almond shell wastes based on their potential uses
as biomass to produce renewable energy [3]; as a source of organic biopesticides [4], heavy metal

Polymers 2020, 12, 835; doi:10.3390/polym12040835                              www.mdpi.com/journal/polymers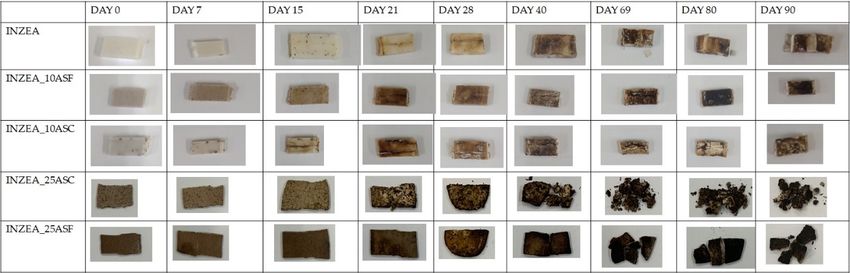
Polymers 2020, 12, 835                                                                              2 of 17

adsorbents [5], dye adsorbents [6], growing media [7], the preparation of activated carbons [8] and
xylo-oligosaccharides [9], antioxidants [10] or as additives in eco-friendly composites [11–13].
      The development of eco-friendly composites arises from the need for reducing environmental
problems generated by industrial processes. In this scenario, agricultural waste utilization has become
a potential option for the development of eco-friendly composites. This powerful area of interest presents
several benefits such as biodegradability in combination with bio-based or natural polymers, light
weight, low cost and easy processing [14,15]. Among the wide variety of lignocellulosic wastes, almond
shell powder has been already considered as filler for commodity plastics, such as polypropylene [16–20],
polyethylene [21], poly(methyl methacrylate) [22] and toughened epoxies [23,24].
      Looking at a more environmentally friendly use, the role of ASP has been recently studied in
enhancing the mechanical performance of some melt compounded biopolymers [25–27]. Nonetheless,
due to the lack of miscibility between hydrophobic polymer matrices and highly hydrophilic almond
shell fillers, the obtained green composites usually presented poor ductility and low thermal stability.
In order to increase the interaction between them, several solutions have been proposed, such as
silanization, acetylation and maleic anhydride modification [28]. Plasticizers could also act as internal
lubricants, thus allowing chain mobility, which enhances processability and improves thermal stability
and ductility. Recently, vegetable oils have been proposed as environmentally friendly compatibilizers
as an alternative to conventional petroleum-based ones [29]. Specifically, maleinized linseed oil (MLO)
has been used as a compatibilizer in biopolymer/ASP composites [11,30,31]. In these works, authors
discussed plasticization and compatibilization effects provided by MLO due to the interaction between
succinic anhydride polar groups contained in MLO and hydroxyl groups in ASP (hydroxyl groups in
cellulose). The compatibilizing effect was obtained by melt grafting for the formation of new carboxylic
ester bonds through the reaction of maleic anhydride functionalities present in MLO with the hydroxyl
groups of both the polyester terminal chains and cellulose on the ASP surface. On the other hand,
the possibility of improving the stress transfer between the filler and the polymer can be realized by
reactive processing with chain extenders [32].
      The main aim of the present work is the development and characterization of new biocomposites
prepared using a commercial INZEA® biopolymer (mainly composed of a polyester-based matrix)
containing almond shell powder at 10 and 25 wt % contents. The effect of adding two different
milling sizes (125–250 µm and 500–1000 µm) in the biocomposites preparation was also evaluated.
In addition, the potential of maleinized linseed oil as a compatibilizer was studied. The effect of this
vegetable-oil-derived compatibilizer was also compared with a conventional epoxy styrene-acrylic
oligomer (Joncryl ADR 4400) in terms of mechanical properties, thermal stability and blend morphology.
Biocomposites containing 10 and 25 wt % of ASP at two grinding levels were submitted to
a disintegration test in order to verify the effectiveness of the developed polyester/ASP composites to
be used as compostable materials.

2. Materials and Methods

2.1. Materials
      INZEA® biopolyester commercial grade, with a density of 1.23 g cm−3 measured at 23 ◦ C,
a moisture content
Polymers 2020, 12, 835 3 of 17
of linseed oil, supplied as Veomer Lin by Vandeputte (Mouscron, Belgium, viscosity of 10 dPa s at
20 ◦ C and an acid value of 105–130 mg KOH g−1 ).
2.2. Biocomposites Preparation
Biocomposite materials were obtained using the melt blending method by mixing the biopolymer
matrix with the almond particles, obtained by grinding and sieving the almond shells as previously
described and the additives according to the proportions shown in Table 1. A co-rotating twin-screw
extruder, Xplore 5 & 15 Micro Compounder by DSM, was used by mixing at a rotating speed of
90 rpm for 3 min and setting a temperature profile of 190–195–200 ◦ C in the three heating zones from
feeding section to die. A Micro Injection Molding Machine 10 cc by DSM, coupled to the extruder
and equipped with adequate molds, was used to produce samples for flexural tests according to the
standards. An appropriate pressure/time profile was used for the injection of each type of sample,
while the temperatures of the injection barrel and the molds were set, respectively, at 210 and 30 ◦ C.
Table 1. Formulations obtained in this work and their codification.
Biopolymer Milled
Formulation Grain Size * J44 (wt %) MLO (wt %)
(wt %) ASP (wt %)
INZEA 100.00
INZ_10ASF 90.00 10 F
INZ_10ASC 90.00 10 C
INZ_25ASF 75.00 25 F
INZ_25ASC 75.00 25 C
INZ_10ASF_1J 89.10 10 F 0.90
INZ_10ASC_1J 89.10 10 C 0.90
INZ_25ASF_1J 74.25 25 F 0.75
INZ_25ASC_1J 74.25 25 C 0.75
INZ_10ASF_5MLO 85.50 10 F 4.50
INZ_10ASC_5MLO 85.50 10 C 4.50
INZ_25ASF_5MLO 71.25 25 F 3.75
INZ_25ASC_5MLO 71.25 25 C 3.75
* Fine grain (F): 125–250 µm; coarse grain (C): 500–1000 µm. J44: Joncryl ADR 4400; MLO: maleinized linseed oil.
2.3. Almond and Biocomposites Characterization
2.3.1. Field Emission Scanning Electron Microscopy
Morphological characterization of ASP was carried out using a field emission scanning electron
microscope (FESEM), Supra 25 by Zeiss (Oberkochen, Germany). The surfaces and the fractures of
biocomposites were analyzed with a FESEM Merlin VP Compact by ZEISS. In both cases, micrographs
were taken using an accelerating voltage of 5 kV at different magnifications. Samples were previously
gold-sputtered with an Automatic Sputter Coater, B7341 by Agar Scientific (Stansted, Essex, UK),
operating with a vacuum atmosphere (0.1–0.005 mbar) and low current (0–50 mA) to provide
electric conductivity.
2.3.2. Thermal Characterization
Thermogravimetric analysis of ASP was performed with thermogravimetric analysis (TGA; (Seiko
Exstar 6300, Tokyo, Japan). Approximately 5 mg of samples were heated from 30 to 600 ◦ C at 10 ◦ C
min−1 under nitrogen atmosphere (flow rate 200 mL min−1 ).
Differential scanning calorimetry (DSC) tests were conducted for the determination of thermal
events by using a DSC (Q1000, TA Instruments, New castle, DE, USA) under a nitrogen atmosphere
(50 mL min−1 ). A 3 mg amount of samples were introduced in aluminum pans (40 µL) and they werePolymers 2020, 12, 835 4 of 17
submitted to the following thermal program: −30 ◦ C to 250 ◦ C at 10 ◦ C min−1 , with two heating and
one cooling scans.
The thermal degradation behavior of biocomposites in composting conditions was evaluated by
thermogravimetric analysis (TGA/SDTA851e/SF/1100, Mettler Toledo, (Schwarzenbach, Switzerland).
Around 5 mg of samples were used to perform dynamic tests in a nitrogen atmosphere (200 mL min–1 )
from 30 ◦ C to 700 ◦ C at 10 ◦ C min−1 .
2.3.3. Mechanical Properties
Flexural tests were carried out by using a universal test machine LR30K (Lloyd Instruments
Ltd., Bognor Regis, UK) at room temperature. A minimum of five different samples was tested using
a 0.5 kN load cell, setting the crosshead speed to 2 mm min−1 for three points bending test, as suggested
by ISO 178 Standard.
2.3.4. Disintegrability in Composting Conditions
Disintegration tests in composting conditions were performed, in triplicate, by following the ISO
20200 Standard method using a commercial compost with a certain amount of sawdust, rabbit food,
starch, oil and urea [33]. Tested samples were obtained from the previously prepared dog-bone-shaped
bars, which were cut in pieces (5 × 10 × 2 mm3 ), buried at a 5 cm depth in perforated boxes and
incubated at 58 ◦ C. The aerobic conditions were guaranteed by mixing the compost softly and by the
periodical addition of water according to the standard requirements.
Different disintegration times were selected to recover samples from burial and further tested: 0,
4, 7, 15, 21, 28, 40, 69 and 90 days. Samples were immediately washed with distilled water to remove
traces of compost extracted from the container and further dried at 40 ◦ C for 24 h before gravimetric
analysis. The disintegrability value for each material at different times was obtained by normalizing
the sample weight with the value obtained at the initial time.
The evolution of disintegration was monitored by taking photographs of recovered samples for
visual evaluation of physical alterations with disintegration time. In addition, thermal (DSC, TGA)
properties upon disintegrability tests were also studied.
2.4. Statistical Analysis
Statistical analysis of experimental data was performed by one-way analysis of variance (ANOVA)
using SPSS 15.0 (IBM, Chicago, IL, USA) and expressed as means ± standard deviation. Differences
between average values were assessed based on the Tukey test at a confidence level of 95% (p < 0.05).
3. Results
3.1. Characterization of Almond Shell Powder
3.1.1. Morphological Analysis
Low-magnification FESEM micrographs of almond shell waste at the two different studied sizes
(125–250 µm, fine, and 500–1000 µm, coarse), reported in Figure 1, showed a general view typical of
fillers obtained after grinding and sieving processes. Almond shell was shown to have a sheet-like
structure. In addition, a series of 1 µm pores were observed on the almond surface (see inserts) [34].
Most of the particles were characterized by a spherical shape, though some aggregates, as well as
flat and long rod-like particles, were also observed. A detail of the particle surface can be seen in
the high-magnification FESEM images. The micrographs revealed that the particles were irregular
in shape and presented a rough surface, more likely resulting from the crushing process due to the
high hardness of this type of filler. Some granular features can also be observed, which resemble the
original grainy and wavy structure of almond shell [35].Polymers 2020, 12, x FOR PEER REVIEW 5 of 17
Polymers
Polymers 2020,
2020, 12,12,
835x FOR PEER REVIEW 5 of517
of 17
Figure1.1.FESEM
Figure FESEMimages
FESEM imagesof
images offine
of fine (a)
fine (a) and coarse
coarse (b)
(b)almond
almondshell
shellpowders.
powders.
3.1.2.
3.1.2. Thermal
3.1.2. Properties
Thermal
Thermal Properties
Properties
TGTG
TG and
andandderivative
derivative
derivative DTG
DTGprofiles
DTG profilesobtained
profiles obtainedfor
obtained forASP
for ASP(coarse
ASP (coarsesize)
(coarse size)under
size) underthe
under the nitrogen
thenitrogen
nitrogenatmosphere
atmosphere
atmosphere at
a at a heating
heating rate rate
of 10of◦C10 °C
min −1
min, −1, reported in Figure 2, showed the typical thermal degradation profile
reported in Figure 2, showed the typical thermal degradation profile for
at a heating rate of 10 °C min−1, reported in Figure 2, showed the typical thermal degradation profile
forfor biomasses
biomasses withwith
biomasses withthree
three threewell-demarked
well-demarked
well-demarked steps forsteps for moisture
moisture
steps for release, release,
moisture release, devolatilization
devolatilization and charand
devolatilization andchar
formation.
char
formation.
Weight loss Weight
in the loss intemperature
lower the lower temperature
region canregion
be can be attributed
attributed to the to the
loss ofloss of moisture,
moisture, while while
major
formation. Weight loss in the lower temperature region can be attributed to the loss of moisture, while
majorloss
weight weight
waslossloss wasatobserved
observed temperatures at temperatures
ranging fromranging225 to 365from◦ C,225
over towhich
365 °C, over which
major weight was observed at temperatures ranging from 225 to 365hemicellulose
°C, over which and
hemicellulose
cellulose and
decomposition cellulose
occurs,decomposition
leading to occurs,
the leading
formation of to the
pyrolysisformation
products of pyrolysis
(volatiles,products
gases and
hemicellulose and cellulose decomposition occurs, leading to the formation of pyrolysis products
(volatiles,
primary gases[36].
biochar) and This
primary biochar) [36].
phenomenon This
wasThis phenomenon
followed by a slow was followed
weight loss by a slow◦weight
until loss
(volatiles, gases and primary biochar) [36]. phenomenon was followed by a600slowC,weight
which was
loss
until 600
attributable °C, which was attributable to the continuous devolatilization of biochar caused by a further
until 600 °C,to the continuous
which devolatilization
was attributable of biochar
to the continuous caused by a further
devolatilization breakdown
of biochar caused by of aC–C and
further
breakdown of C–C and C–H bonds.
C–H bonds.
breakdown of C–C and C–H bonds.
100 0,010
100 TG 0,010
355 °C
DTG
TG
355 °C
80 DTG
80
Residual Mass (%)
296°C
60
DTG (%/°C)
Residual Mass (%)
296°C
60
DTG (%/°C)
0,005
40 0,005
40
20 mf@600°C= 25%
20 mf@600°C= 25%
0 0,000
100 200 300 400 500 600
0 Temperature (°C) 0,000
100 200 300 400 500 600
Temperature
Figure 2. TGA analysis (°C)
of almond coarse shell powder.
TGA analysis
Figure 2. TGA analysis of
of almond
almond coarse
coarse shell
shell powder.
powder.
3.2. Characterization of ASP Biocomposites
3.2. Characterization
3.2. Characterization of of ASP
ASP Biocomposites
Biocomposites
3.2.1. Flexural Tests
3.2.1. Flexural Tests
FlexuralTests
tests provided information on the effect of the amount and size of ASP incorporated in
3.2.1. Flexural
theFlexural
composite, testsasprovided
well as on the effect ofonadding
information the of
the effect studied compatibilizing
the amount and size of additives. In general, in
ASP incorporated
Flexural tests provided information on the effect of the amount and size of ASP incorporated in
theresults show that
composite, the addition
as well as on theofeffect
the filler did notthe
of adding improve thecompatibilizing
studied maximum strength or strain In
additives. at break
general,
thewith
composite,
respectthatas
to thewell as on the effect of adding the studied compatibilizing additives. In general,
results show thereference
additionpolymer matrix
of the filler did(Table 2). The elastic
not improve modulus of
the maximum the biocomposites
strength or strain atwas
break
results showonly
improved that in
theformulations
addition of containing
the filler did
25 not%improve
wt of both the maximum
fine and coarse strength
filler. The or strain at break
comparison of
with respect to the reference polymer matrix (Table 2). The elastic modulus of the biocomposites was
with respect
flexural to for
tests the formulations
reference polymerwith 10matrix
wt % of (Table 2). The2 elastic
ASP (Table modulus
and Figure of thethat
3) showed biocomposites was
the size of the
improved only in formulations containing 25 wt % of both fine and coarse filler. The comparison
improved onlygives
coarse grain in formulations containing
greater rigidity 25 wt
than the fine % of
grain byboth fine and
increasing coarseand
strength filler. The comparison
modulus but slightly of
of flexural tests for formulations with 10 wt % of ASP (Table 2 and Figure 3) showed that the size
flexural testselongation.
reducing for formulations with
In fact, the 10 wt %ofof10ASP
presence wt %(Table
of fine2 filler
and Figure 3) showed thatbiocomposite
in the INZEA_10ASF the size of the
of the coarse grain gives greater rigidity than the fine grain by increasing strength and modulus
coarse grain gives greater rigidity than the fine grain by increasing strength and modulus but slightly
but slightly reducing elongation. In fact, the presence of 10 wt % of fine filler in the INZEA_10ASF
reducing elongation. In fact, the presence of 10 wt % of fine filler in the INZEA_10ASF biocompositePolymers 2020, 12, 835 6 of 17
biocomposite produced a maximum strength value of 44 MPa with a flexural modulus of 1473 MPa,
lower than the biocomposite with the coarse filler INZEA_10ASC, which showed σmax = 47 MPa and
E = 1699 MPa values. Nabinejad et al. [37] reported that the surface roughness and high surface area of
coarse powder particles could have a positive effect on the mechanical performance of composites,
being able to restrict the polymer chain mobility. Porosity and roughness of the hydrophilic surface
for coarse almond shell powder would be expected to increase its wettability by the polymer matrix.
So, as a result, the INZEA_10ASC composite showed high stiffness values compared to composites
containing fine filler (INZEA_10ASF) with low surface roughness and porosity. Additionally, results
from Zaini et al [38] confirmed that composites filled with a larger-sized filler showed higher modulus,
tensile and impact strengths, particularly at high filler loadings.
Polymers 2020,
Table 2.12, x FOR PEER
Flexural REVIEW
parameters for almond shell powder (ASP)-based biocomposites (mean ± SD, n = 5).
7 of 17
When increasing the Formulation
quantity of filler toσ25maxwt(MPa) ε(%) at σin
%, an increase E (MPa)
the rigidity
max of the biocomposites
was obtained. The result isINZEA a general increase in 66 flexural
±2 strength
7.9 ± 0.2and moduli,
1913 ±which
13 corresponds to
a reduction in deflection. INZEA_10ASF
Even in formulations44with ± 2 a higher ± 0.4
4.4content of 1473 ± 16
the natural filler, MLO did
INZEA_10ASF_5MLO 36 ± 1 4.9 ± 0.3 1170 ± 15
not produce any other effects than those already shown in the set with 10 wt % of ASP. The flexural
INZEA_10ASF_1J 48 ± 2 5.5 ± 0.6 1414 ± 8
strength of the biocomposite containing 25 wt 50
INZEA_25ASF % ±of1fine particle
3.0 ± (INZEA_25ASF)
0.2 2537 ± 35rises to 50 MPa (44
MPa for INZEA_10ASF), while the INZEA_25ASC
INZEA_25ASF_5MLO 44 ± 1composite 4.0maintains
± 0.2 the
1838same
± 22 value of 47 MPa as
10 wt % of filler, highlighting the achievement 56
INZEA_25ASF_1J of ±the2 plateau3.5
of ±the
0.1coarse2555
grain± reinforcement.
61 In the
case of the higher amount INZEA_10ASC 47 ± 2
of ASP, the compatibilizing 4.0of± Joncryl
effect 0.3 1699 ± 32even more evident,
appears
INZEA_10ASC_5MLO 38 ± 2 5.4 ± 0.6 1300 ± 33
since a better interface bonding between the matrix and the filler was achieved. INZEA_25ASF_1J
INZEA_10ASC_1J 47 ± 2 4.2 ± 0.4 1653 ± 24
showed a further increase in flexural strength reaching
INZEA_25ASC 47 ± 2 56 MPa,
3.0 ±with
0.2 an improvement
2392 ± 77 in modulus to
2555 MPa and without excessively
INZEA_25ASC _5MLO reducing the flexural
35 ± 1 deflection.
3.5 ± 0.1 In addition,
1732 ± 7 INZEA_25ASC_1J
with Joncryl showed INZEA_25ASC
an improvement _1J in strength 53 ± 1going up3.7 ± 0.2
from 47 to 532394
MPa,± 25but in this case, the
compatibilizing effect of J44strength;
σmax : flexural was lessε atevident,
σmax : strainbecause it occurred
at maximum on a Modulus.
stress; E: Young’s smaller interface surface,
compared to fine-grain-sized biocomposites, due to the larger particle size [13].
70 70
65 65
60 60
55 55
50 50
45 45
Stress (MPa)
Stress (MPa)
40 40
35 35 INZEA
INZEA
30 30 INZEA_25ASF
INZEA_10ASF
25 25 INZEA_25ASF_5MLO
INZEA_10ASF_5MLO
20 20 INZEA_25ASF_1J
INZEA_10ASF_1J
15 INZEA_25ASC
INZEA_10ASC 15
10 INZEA_10ASC_5MLO 10 INZEA_25ASC_5MLO
5 INZEA_10ASC_1J INZEA_25ASC_1J
5
0
0
0 5 10 15 20
0 5 10 15 20
Strain (%)
Strain (%)
Figure 3. Stress–strain curves of polyester-based biocomposites containing 10 and 25 wt % of ASP at
two grinding levels (F,
(F, C),
C), with
with or
or without
without compatibilizers.
compatibilizers.
3.2.2.The addition of and
Morphological 5 wtThermal
% of MLO in the biocomposite formulation produced a compatibilizing
Analysis
effect lower than expected. In fact, the improvement in deformability moved from 4.4% to 4.9% of
In Figure 4, FESEM
INZEA_10ASF_5MLO images
and of fractured
from 4.0% to 5.4% surfaces for INZEA/ASP composites
of INZEA_10ASC_5MLO (uncompatibilized
in the formulations with MLO
and compatibilized biocomposites) are reported. As it can be observed, in the case of the unmodified
and 10 wt % ASP fine and coarse, respectively, with a consistent reduction in both flexural strength and
matrix, the polymer‒particle
flexural modulus. If the modestadhesion
plasticizingwas very
effect poor, both
is excluded, the at
MLOlowdidandnothigh ASPimprovements
produce contents, so
important gaps can
of the interface be found
strength between
between the the particles
natural fillerand
andthe surrounding
the biopolymerpolyester
matrix. matrix [11]. This
Effectiveness of
morphological observation correlates with the above-described mechanical performance
maleinized linseed oil has been demonstrated in composites based on lignin fillers and, specifically, of the
unmodified
from groundINZEA
almond composites,
shells and in which
some the presencepolymers,
biodegradable of ASP didsuch
not as
contribute to an
poly(lactic improvement
acid) (PLA) and
in mechanical performance. The addition of 5 wt % MLO provides some interaction
lignin. In this case, the poor result obtained with the INZEA matrix should be attributed as the gap seems
to the
to be reduced, indicating a limited but good compatibilizing effect of MLO modifier, but at the same
time, the presence of microsized voids in the matrix compatibilized with 5 wt % of MLO was visible
[30]. In the presence of a styrene-acrylic-based compatibilizer and oligomeric agent, an improvement
in the interface with ASF and ASC was noted at higher contents (25 wt %), even if biocomposites
containing the higher amount presented some gaps at the interface. So, it can be concluded the chainPolymers 2020, 12, 835 7 of 17
particular composition of the commercial biopolymer used (a bio-based blend mainly composed
of a polyester matrix) [30,39,40]. Joncryl ADR 4400 added to the formulation with fine particles
INZEA_10ASF_1J produced an increase in flexural strength from 44 to 48 MPa. This improvement is
due to the compatibilizing effect of the polymer chain extender, which improves the adhesion between
the matrix and the particles allowing a greater deflection. This effect is highlighted by the perfect
overlap between the σ−ε curve of the unmodified INZEA_10ASF and the INZEA_10ASF_1J curve
which, thanks to the J44, extends up to 5.5% increasing the flexural strength [41]. The effect of Joncryl
was negligible on biocomposites with coarse grain, since the compatibilization effect at the interface
between the matrix and the filler was much lower (about 6%) than biocomposites with fine particles.
In fact, when simplifying the particles as spherical and calculating the ratios between coarse and fine
surfaces, with the same wt % content, an area ratio of 0.0625 was obtained.
When increasing the quantity of filler to 25 wt %, an increase in the rigidity of the biocomposites
was obtained. The result is a general increase in flexural strength and moduli, which corresponds to
a reduction in deflection. Even in formulations with a higher content of the natural filler, MLO did
not produce any other effects than those already shown in the set with 10 wt % of ASP. The flexural
strength of the biocomposite containing 25 wt % of fine particle (INZEA_25ASF) rises to 50 MPa
(44 MPa for INZEA_10ASF), while the INZEA_25ASC composite maintains the same value of 47 MPa
as 10 wt % of filler, highlighting the achievement of the plateau of the coarse grain reinforcement. In the
case of the higher amount of ASP, the compatibilizing effect of Joncryl appears even more evident,
since a better interface bonding between the matrix and the filler was achieved. INZEA_25ASF_1J
showed a further increase in flexural strength reaching 56 MPa, with an improvement in modulus to
2555 MPa and without excessively reducing the flexural deflection. In addition, INZEA_25ASC_1J
with Joncryl showed an improvement in strength going up from 47 to 53 MPa, but in this case, the
compatibilizing effect of J44 was less evident, because it occurred on a smaller interface surface,
compared to fine-grain-sized biocomposites, due to the larger particle size [13].
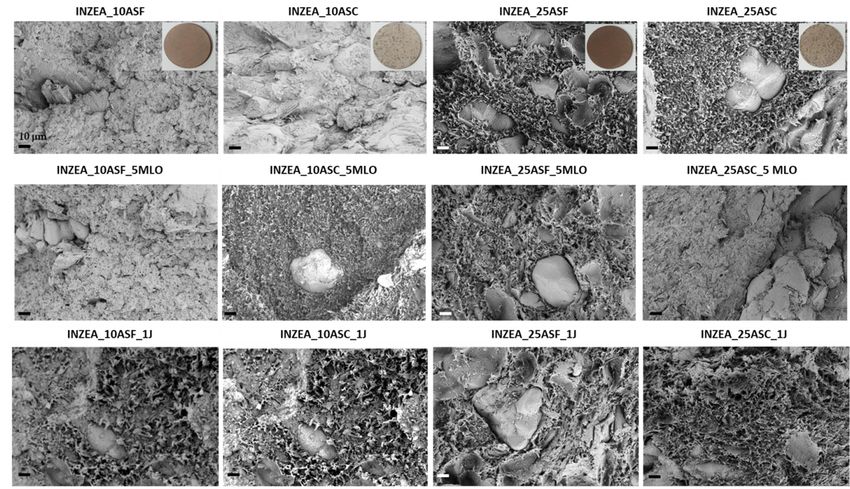
3.2.2. Morphological and Thermal Analysis
In Figure 4, FESEM images of fractured surfaces for INZEA/ASP composites (uncompatibilized
and compatibilized biocomposites) are reported. As it can be observed, in the case of the unmodified
matrix, the polymer-particle adhesion was very poor, both at low and high ASP contents, so important
gaps can be found between the particles and the surrounding polyester matrix [11]. This morphological
observation correlates with the above-described mechanical performance of the unmodified INZEA
composites, in which the presence of ASP did not contribute to an improvement in mechanical
performance. The addition of 5 wt % MLO provides some interaction as the gap seems to be reduced,
indicating a limited but good compatibilizing effect of MLO modifier, but at the same time, the presence
of microsized voids in the matrix compatibilized with 5 wt % of MLO was visible [30]. In the presence
of a styrene-acrylic-based compatibilizer and oligomeric agent, an improvement in the interface with
ASF and ASC was noted at higher contents (25 wt %), even if biocomposites containing the higher
amount presented some gaps at the interface. So, it can be concluded the chain extender was effective
at both filler contents [42].
Figure 5a,b shows the TG/DTG thermograms of the INZEA matrix with the addition of 25 wt %
ASP at the two different grinding sizes. Only the trends in thermal behavior for the biocomposites
containing the higher ASP content have been reported, being the ones at 10 wt % essentially inline
(data not shown). The presence of a double degradation peak for the INZEA neat matrix gives us an
indication of a material that degrades in two steps around 350 and 400 ◦ C, that could match with the
possible degradation temperatures of PLA and poly(butylene succinate) (PBS) polyesters. It is also
important to note that at 900 ◦ C, even the unmodified INZEA matrix maintains a residual mass of
ca. 5 wt %, which is increased by the presence of the fillers. This is in accordance with the possible
presence of an inorganic filler in the formulation of the commercial product.Polymers 2020, 12, 835 8 of 17
Polymers2020,
Polymers 2020,12,
12,xxFOR
FORPEER
PEERREVIEW
REVIEW 88 of
of 17
17
Figure 4.
Figure
Figure 4. FESEM
4. FESEM images
FESEMimages
imagesof of INZEA-based biocomposites
ofINZEA-based
INZEA-based biocomposites with
biocompositeswith 10
with10 and
10and 25
and25 wt %
25wt
wt % of
% of ASP
of ASP at
ASP at the
at the two
the two
two
grinding
grinding levels
grinding levels (fine,
levels (fine, coarse),
(fine, coarse), with
coarse), with or
with or without compatibilizers.
or without compatibilizers.
100 0.020
100 0.020
INZEA INZEA
INZEA INZEA
INZEA_25ASF INZEA_25ASF
INZEA_25ASF INZEA_25ASF
INZEA_25ASC INZEA_25ASC
80 INZEA_25ASC INZEA_25ASC
80
0.015
0.015
(%)
Mass(%)
60
(%/°C)
60
DTG(%/°C)
ResidualMass
0.010
0.010
40
Residual
DTG
40
0.005
0.005
20
20
a)
a) b)
b)
0 0.000
0 0.000
200 400 600 800 200 400 600 800
200 400 600 800 200 400 600 800
Temperature(°C)
Temperature (°C) Temperature(°C)
Temperature (°C)
100 0.020
100 0.020
INZEA
INZEA INZEA
INZEA
INZEA_25ASF_5MLO
INZEA_25ASF_5MLO INZEA_25ASF_5MLO
INZEA_25ASF_5MLO
INZEA_25ASF_1J
INZEA_25ASF_1J INZEA_25ASF_1J
80
80 INZEA_25ASF_1J
INZEA_25ASC_5MLO
INZEA_25ASC_5MLO 0.015 INZEA_25ASC_5MLO
0.015 INZEA_25ASC_5MLO
INZEA_25ASC_1J
INZEA_25ASC_1J INZEA_25ASC_1J
INZEA_25ASC_1J
(%)
Mass(%)
60
(%/°CC) )
60
ResidualMass
DTG(%/°
0.010
0.010
Residual
DTG
40
40
0.005
0.005
20
20
0
c)c) 0.000
d)
d)
0 0.000
200 400 600 800 200 400 600 800
200 400 600 800 200 400 600 800
Temperature(°C)
Temperature (°C) Temperature(°C)
Temperature (°C)
Figure5.
Figure
Figure 5.TG/DTG
5. TG/DTGcurves
TG/DTG curvesof
curves ofINZEA-based
of INZEA-basedbiocomposites
INZEA-based biocompositeswith
with25
25wt wt% ofASP
% of
of ASPat
ASP atthe
at thetwo
the twogrinding
two grinding
grinding
levels (a,b)
levels (a,b)
levels and
(a,b) and INZEA
and INZEA biocomposites
INZEA biocomposites with 25 wt
biocomposites with 25 wt %
wt % of
% of ASP
of ASP in
ASP in the
in the presence
the presence of
presence of MLO
of MLO or
MLO or Joncryl
or Joncryl
Joncryl
compatibilizers
compatibilizers (c,d).
(c,d).
compatibilizers (c,d).
Figure5a,b
Figure 5a,bshows
showsthe
theTG/DTG
TG/DTGthermograms
thermogramsof ofthe
theINZEA
INZEAmatrix
matrixwith
withthe
theaddition
additionofof25
25wt
wt%%
ASP at the two different grinding sizes. Only the trends in thermal behavior for the biocomposites
ASP at the two different grinding sizes. Only the trends in thermal behavior for the biocomposites
containingthe
containing thehigher
higherASP
ASPcontent
contenthave
havebeen
beenreported,
reported,being
beingthe
theones
onesat
at10
10wt
wt%%essentially
essentiallyinline
inlinePolymers 2020, 12, 835 9 of 17
The TG curves corresponding to INZEA/ASP composites showed an evident decrease at the
onset degradation temperature from 324 ◦ C for neat INZEA to 275 ◦ C and 280 ◦ C, respectively,
for INZEA_25ASC and INZEA_25ASF (Table 3). This behavior is essentially due to the relatively
low thermal stability of the lignocellulosic filler, which initiated its degradation at 198 ◦ C (Figure 2),
and negatively contributed to the reduction of the global thermal stability of the INZEA-based
biocomposites, in agreement with previous studies on the same bio-based reinforcement [17,20].
The introduction of the ASP filler mainly affected the thermal stability of the polyester component
with the lower Tpeak temperature (maximum mass loss rate): in detail, Tpeak1 moved from 351 ◦ C
to 311 ◦ C and 334 ◦ C for INZEA_25ASF and INZEA_25ASC, respectively, while the temperature for
the second peak (Tpeak2 ) remained practically unchanged for all the different composites (Table 3).
This behavior was related to the higher amount of ASP incorporated and its degradation over this
temperature range. According to other authors, cellulose, hemicelluloses and lignin show a broad
temperature range starting at about 250 ◦ C and ending at 450 ◦ C in a progressive weight loss process,
and this degradation can reduce the thermal stability of biopolyesters [43–45]. Similar findings were
reported by Liminana et al. [31] who observed a decrease of 11.2 ◦ C in thermal stability of PBS with the
addition of 30 wt % of almond shells.
Table 3. Tonset and Tpeak values of INZEA-based biocomposites with 25 wt % of ASP at the two grinding
levels with and without MLO or Joncryl compatibilizers (mean ± SD, n = 3).
Formulation Tonset (◦ C) Tpeak1 (◦ C) Tpeak2 (◦ C)
INZEA 324 ± 1 351 ± 2 385 ± 1
INZEA_25ASF 280 ± 2 311 ± 2 391 ± 2
INZEA_25ASF_5MLO 285 ± 2 328 ± 2 388 ± 3
INZEA_25ASF_1J 285 ± 1 329 ± 1 390 ± 2
INZEA_25ASC 275 ± 2 334 ± 1 390 ± 2
INZEA_25ASC _5MLO 275 ± 3 341 ± 3 392 ± 4
INZEA_25ASC _1J 291 ± 3 339 ± 2 390 ± 3
Tonset : initial degradation temperature; Tpeak1 and Tpeak2 : first and second maximum degradation temperatures,
respectively.
The addition of MLO (Figure 5c,d) exerted a limited positive effect on the overall thermal
stability of the biocomposites (Table 3). Specifically, the onset degradation temperature increased to
285 ◦ C for INZEA_25ASF_5MLO and substantially remained unchanged for INZEA_25ASC_5MLO
(if compared to uncompatibilized matrices). On the other hand, the temperature of Tpeak1 was
significantly improved, in comparison with the unmodified ASP biocomposites, at the two grinding
sizes. In particular, Tpeak1 was delayed up to 328 ◦ C for the INZEA_25ASF_5MLO material and 341 ◦ C
for the INZEA_25ASC_5MLO material. This increase in thermal stability could be directly related to
the chemical interaction achieved by MLO, due to the establishment of covalent bonds between the
lignocellulosic fillers and the polyester matrix. In addition, MLO could also provide a physical barrier
that obstructs the removal of volatile products produced during decomposition. A similar effect on
thermal stability was recently reported for PLA and epoxidized palm oil blends [46].
It has been also reported that the reactive extrusion of aliphatic polyesters, such as PLA, with
styrene-epoxy acrylic oligomers can provide an increase in thermal stability due to the branching effect
obtained during the extrusion process. As it has been found in our case (Figure 5c,d), the presence of
Joncryl provided enhanced thermal resistance for the low Tpeak polyester phase, moving this value
from 311 ◦ C and 334 ◦ C (INZEA_25ASF and INZEA_25ASC), respectively, to 329 ◦ C and 339 ◦ C for
INZEA_25ASF_1J and INZEA_25ASC_1J (Table 3). This effect was already observed by Lascano et al
in poly(lactic acid)/poly(butylene succinate-co-adipate) blends containing Joncryl [47].Polymers 2020, 12, x FOR PEER REVIEW 10 of 17
339 °C
Polymers for12,INZEA_25ASF_1J
2020, 835 and INZEA_25ASC_1J (Table 3). This effect was already observed10by
of 17
Lascano et al in poly(lactic acid)/poly(butylene succinate-co-adipate) blends containing Joncryl [47].
3.3.3.3.
Disintegration Tests
Disintegration Tests
According
According totothe
thecharacterization
characterizationresults
results previously obtained,the
previously obtained, thedisintegrability
disintegrabilityof of polyester-
polyester-
based
basedbiocomposites
biocomposites with
with1010and
and25 25wt
wt% %ofof ASP
ASP at two grinding
grindinglevels
levels(F,
(F,C)
C)was
wasstudied
studied toto evaluate
evaluate
their degradation
their degradation inin
natural
naturalenvironments.
environments. Formulations includingthe
Formulations including thetwo
twostudied
studiedcompatibilizing
compatibilizing
agents
agents were
were notnot included
included in in this
this study,
study, since
since the
the maingoal
main goalofofthis
thischaracterization
characterizationwas
wasthetheanalysis
analysis of
ASP of size
ASPandsize content
and content on disintegration
on disintegration behavior
behavior of the
of the reference
reference matrix.
matrix.
TheThe visual
visual evaluation
evaluation of of
allall samples
samples at at different
different degradation
degradation timeswas
times wascarried
carriedout
outand
andresults
resultsare
shown in Figure 6. Some changes in sample surfaces submitted to composting conditions werewere
are shown in Figure 6. Some changes in sample surfaces submitted to composting conditions clearly
clearly appreciable,
appreciable, showing all showing
samplesallconsiderable
samples considerable modifications
modifications in color and inmorphology
color and morphology after
after 15 treatment
15 treatment
days. days. These
These modifications canmodifications
be associatedcan be associated
to the beginning to the polymer
of the beginning of thedegradation,
matrix polymer matrixwhich
can be related to the direct contact of biocomposites with the compost, by a graduallycompost,
degradation, which can be related to the direct contact of biocomposites with the by a
microorganism
gradually microorganism erosion from the surface to the bulk and to the moisture absorption, as it
erosion from the surface to the bulk and to the moisture absorption, as it has been reported in the
has been reported in the literature [45]. After 69 days of study, samples with 25 wt % of ASP have
literature [45]. After 69 days of study, samples with 25 wt % of ASP have completely lost their
completely lost their morphology, and small fragments can be observed (in particular for
morphology, and small fragments can be observed (in particular for INZEA_25ASC). In addition,
INZEA_25ASC). In addition, differences in color could be observed between samples with different
differences in color could be observed between samples with different amounts of ASP. Formulations
amounts of ASP. Formulations with 10 wt % of ASP showed disintegration behavior similar to that
withof 10 wt %neat
INZEA of ASP showed
during disintegration
all the study. behavior similar to that of INZEA neat during all the study.
Figure 6. Visual appearance of INZEA-based biocomposites with 10 and 25 wt % of ASP at two grinding
Figure 6. Visual appearance of INZEA-based biocomposites with 10 and 25 wt % of ASP at two
levels (F, C) at different testing days at 58 ◦ C.
grinding levels (F, C) at different testing days at 58 °C.
Figure 7 shows the evolution of disintegrability values (%) as a function of testing time for all
Figure 7 shows the evolution of disintegrability values (%) as a function of testing time for all
biomaterials.
biomaterials. According
According to to
dede
Olivera
Oliveraet et
al.al.
[48], thethe
[48], first stage
first ofof
stage thethe
biodegradation
biodegradationmechanism
mechanismisisthe
release of enzymes that can cause the hydrolysis of the polymer matrix and
the release of enzymes that can cause the hydrolysis of the polymer matrix and break of polymer break of polymer chains,
creating
chains,functional groups capable
creating functional groupsofcapable
improving hydrophilicity
of improving and the microorganism’s
hydrophilicity adhesion
and the microorganism’s
on adhesion
the surface of the polymer matrix. The results obtained at longer times
on the surface of the polymer matrix. The results obtained at longer times suggestedsuggested that physical
that
degradation progressed progressed
physical degradation slowly withslowly
burial with
time,burial
indicating
time,that microorganisms
indicating required more
that microorganisms time to
required
produce
more timesuitable enzymessuitable
to produce capableenzymes
to breakcapable
down polymer
to breakchains, resultingchains,
down polymer in an incomplete
resulting inloss an of
theincomplete
initial morphology
loss of theand general
initial rupture and
morphology aftergeneral
90 daysrupture
for formulations
after 90 dayswith
for10 wt % of ASP
formulations and10the
with
INZEA
wt % control.
of ASP andFormulations
the INZEA with 25 Formulations
control. wt % of ASP significantly
with 25 wt % increased their disintegrability
of ASP significantly increased their ratio
disintegrability
compared ratio compared
to formulations with 10towtformulations
% of ASP and with 10 wt control
INZEA % of ASP and28
after INZEA
days ofcontrol
study,after 28 days
probably due
of study,
to the higherprobably
amount of due to the
ASP, higher
which amount
enhances theofhigh
ASP,biodegradability
which enhancesof the high biodegradability
lignocellulosic residues, of and
lignocellulosic residues, and to the poor fiber/matrix adhesion allowing
to the poor fiber/matrix adhesion allowing and facilitating microorganisms attack and biodegradation and facilitating
ratemicroorganisms attack andand
by promoting biofouling biodegradation
the adhesionrate by promoting biofouling
of microorganisms and[49].
to the surface the Moreover,
adhesion of this
microorganisms to the surface [49]. Moreover, this increase in the disintegrability
increase in the disintegrability rate of the polymer matrix could be due to the presence of hydroxyl rate of the polymer
matrix
groups incould be due
ASP [49], to thecould
which presence
playofahydroxyl
catalyticgroups
role oninthe ASP [49], which
hydrolysis ofcould play a catalytic
the polymer, inducing rolean
on the hydrolysis of the polymer, inducing an acceleration of polymer weight loss due to the higher
acceleration of polymer weight loss due to the higher filler addition [50]. Similar results were found by
filler addition [50]. Similar results were found by Wu [51] and de Oliveira et al. [48] when studying
Wu [51] and de Oliveira et al. [48] when studying the biodegradation of composites obtained with
poly(butylene adipate-co-terephthalate) and different natural fillers. The authors observed that the
biodegradation rate of the composites increased with filler content. In this sense, the presence of high
amounts of ASP can be related to a greater discontinuity in the polymer matrix which could facilitatePolymers 2020, 12, x FOR PEER REVIEW 11 of 17
the biodegradation of composites obtained with poly(butylene adipate-co-terephthalate) and
different natural fillers. The authors observed that the biodegradation rate of the composites
Polymers 2020, 12, 835 11 of 17
increased with filler content. In this sense, the presence of high amounts of ASP can be related to a
greater discontinuity in the polymer matrix which could facilitate water penetration into the
biocomposites
water penetration producing a huge modification
into the biocomposites producingof the surface
a huge and generating
modification a natural
of the surface andenvironment
generating
aconducive to the growth
natural environment of microorganisms
conducive to the growth[48]. After 90 days of[48].
of microorganisms study, almost
After 50%ofofstudy,
90 days the materials
almost
were
50% ofdisintegrated
the materials under composting conditions.
were disintegrated However,
under composting lower weight
conditions. loss ratios
However, lowerwere obtained
weight loss
with were
ratios lowerobtained
amountswith of ASP.
lowerThis behavior
amounts suggests
of ASP. that the suggests
This behavior disintegration rate
that the is more influenced
disintegration rate is
and dependent
more influenced on andthe polymer on
dependent matrix being slower
the polymer matrixat being
lower slower
ASP contents.
at lower ASP contents.
60
Inzea INZ_10ASF INZ_10ASC INZ_25ASF INZ_25ASC
50
40
% Disintegrability
30
20
10
0
0 7 15 21 28 40 69 80 90
Testing time (Days)
Figure 7. Disintegrability (%) of INZEA-based biocomposites with 10 and 25 wt % of ASP at two
Figure 7. Disintegrability (%) of INZEA-based biocomposites with 10 and 25 wt % of ASP at two
grinding levels (F, C) as a function of degradation time under composting conditions at 58 ◦ C (mean ±
grinding levels (F, C) as a function of degradation time under composting conditions at 58 °C (mean
SD, n = 3).
± SD, n = 3).
Figure 8 shows the DSC thermograms obtained during the second heating scan for all formulations
Figure 8 shows the DSC thermograms obtained during the second heating scan for all
as a function of composting time (0, 28 and 90 days). Two different peaks were observed at day
formulations as a function of composting time (0, 28 and 90 days). Two different peaks were observed
0, around 110 and 170 ◦ C, indicating the presence of two main polyesters in the polymer matrix,
at day 0, around 110 and 170 °C, indicating the presence of two main polyesters in the polymer matrix,
in agreement with the behavior previously observed by TGA (Section 3.2.2). A similar DSC profile
in agreement with the behavior previously observed by TGA (Section 3.2.2). A similar DSC profile
for the first and second peaks was described by Liminana et al. and Quiles-Carrillo et al. for the
for the first and second peaks was described by Liminana et al. and Quiles-Carrillo et al. for the
characterization of PBS-based and PLA-based composites reinforced with similar amounts of almond
characterization of PBS-based and PLA-based composites reinforced with similar amounts of almond
shells, respectively [12,52]. Both melting peak temperatures remained practically invariable after the
shells, respectively [12,52]. Both melting peak temperatures remained practically invariable after the
addition of ASP at the two studied contents, 10 and 25 wt % (Table 4), showing a slight modification
addition of ASP at the two studied contents, 10 and 25 wt % (Table 4), showing a slight modification
which could be related to the formation of more perfect crystals into the polymer matrix. Similar
which could be related to the formation of more perfect crystals into the polymer matrix. Similar
behavior was observed by Quiles-Carrillo et al. for PLA-based composites with 25 wt % of almond
behavior was observed by Quiles-Carrillo et al. for PLA-based composites with 25 wt % of almond
shell [12]. A slight decrease in the melting enthalpy of the first peak was observed with the addition
shell [12]. A slight decrease in the melting enthalpy of the first peak was observed with the addition
of ASP which was more pronounced at 25 wt % This effect could be related to the nucleating effect
of ASP which was more pronounced at 25 wt % This effect could be related to the nucleating effect
exerted by the lignocellulosic filler on semicrystalline polymers acting the cellulose crystals of the
exerted by the lignocellulosic filler on semicrystalline polymers acting the cellulose crystals of the
almond shells as nucleating points [11].
almond shells as nucleating points [11].
Regarding the disintegration study, the DSC melting temperature of the second endothermic peak
Regarding the disintegration study, the DSC melting temperature of the second endothermic
moved from 168.4 ± 3.7 ◦ C for INZEA at day 0 to 142.4 ± 0.8 ◦ C at day 90 (Table 4). Formulations
peak moved from 168.4 ± 3.7 °C for INZEA at day 0 to 142.4 ± 0.8 °C at day 90 (Table 4). Formulations
with ASP did not show significant differences at day 0 compared to the values obtained for INZEA
control. This decrease in around 26 ◦ C was related to a rapid molecular mass reduction, implying thatPolymers 2020, 12, x FOR PEER REVIEW 12 of 17
Polymers 2020, 12, 835 12 of 17
with ASP did not show significant differences at day 0 compared to the values obtained for INZEA
control. This decrease in around 26 °C was related to a rapid molecular mass reduction, implying that
small and imperfect crystals disappeared with degradation time [53,54].[53,54]. INZEA and formulations
with 10 wt % of ASP did not show significant differences in DSC values at the same disintegration
time, maintaining
maintaining similar
similar values
valuesthroughout
throughoutthe
thewhole
wholestudy.
study.InInthis
thissense,
sense,the addition
the of of
addition 1010
wtwt
% of
%
ASP could
of ASP couldnot bebe
not enough
enough totoachieve
achieveananacceptable
acceptableweight
weightloss
lossratio
ratiointo
into the
the disintegration
disintegration process
under composting conditions.
INZEA_25ASF INZEA_25ASF
INZEA_25ASC INZEA_25ASC
INZEA_10ASF INZEA_10ASF
INZEA_10ASC INZEA_10ASC
INZEA INZEA
Heat Flow (mW)
Heat Flow (mW)
Exo Up Exo Up
0 50 100 150 200 0 50 100 150 200
Temperature (ºC) Temperature (ºC)
(a) (b)
INZEA_25ASF
INZEA_25ASC
INZEA_10ASF
INZEA_10ASC
INZEA
Heat Flow (mW)
Exo Up
0 50 100 150 200
Temperature (ºC)
(c)
Figure 8. DSC
DSC thermograms
thermograms of of INZEA-based
INZEA-based biocomposites
biocomposites with with 10
10 and
and 25
25 wt
wt %% of
of ASP at two
grinding levels (F, C) after different
different degradation
degradation times
times ((a):
((a): 00 days, (b): 28 days, (c): 90 days) at 58 ◦°C
days, (b): C
◦
during the first heating scan (10 °C −1
C min ).).
-1
Under composting conditions, a different behavior was observed for formulations with 25 wt wt %%
◦
of ASP versus time, as the second DSC peak initially appearing around 170 °C C started to disappear
after 28 days of study (Figure 8). After After 9090 days,
days, the
the appearance
appearance of of the
the thermogram
thermogram suggested that this
polyester-based polymer
polyester-based polymerwas wastotally disintegrated
totally by disappearing
disintegrated by disappearing the corresponding glass transition
the corresponding glass
temperature (around 50 ◦ C) and melting peak around 170 ◦ C (Table 4). This result was also related
transition temperature (around 50 °C) and melting peak around 170 °C (Table 4). This result was also
to the final
related appearance
to the and percentage
final appearance of disintegrability
and percentage achieved
of disintegrability in samples
achieved after 90 after
in samples days.90On the
days.
other hand, ◦
On the otherthe observed
hand, peak around
the observed peak110 aroundC remained unchanged
110 °C remained after 90 days
unchanged of 90
after study,
dayswith slight
of study,
modifications
with on its profile,
slight modifications onindicating
its profile,that this polymer
indicating was
that this not degraded
polymer was notyet.
degraded yet.
This behavior was also confirmed by TGA analysis (Table 4). The obtained results demonstrated
that after
Table284. days of study
Thermal the maximum
parameters degradation
of INZEA-based temperature
biocomposites with 10 ofand
the 25
first
wtpolymer
% of ASPpeak,
at twoTpeak1 ,
grinding
decreased levels (F,
around ◦ Cafter
70 C) different
respect to daydegradation times at 58
0, disappearing °Cdegradation
this (mean ± SD, npeak = 3). from the TGA curve
after
Day 40 days under composting TGA conditions. These results confirmDSC those
(2ndobtained
Heating) by DSC where some
modification of the thermal
Tpeak1 (°C)
profile was
Tpeak2 (°C)
observed
Tm1 (°C)*
due to the
ΔHm1
disintegration
Tm2 (°C)**
of one
ΔHm2
main polyester
Tg (°C)
component of the polymer matrix. (J/g)* (J/g)**
INZEA 353.7 ± 390.7 ± 1.5a 112.3 ± 0.5a 35.0 ± 0.9a 168.4 ± 3.7a 9.3 ± 1.8a 47.2 ± 0.6a
A
D
4.0abPolymers 2020, 12, 835 13 of 17
Table 4. Thermal parameters of INZEA-based biocomposites with 10 and 25 wt % of ASP at two grinding levels (F, C) after different degradation times at 58 ◦ C
(mean ± SD, n = 3).
TGA DSC (2nd Heating)
Day
Tpeak1 (◦ C) Tpeak2 (◦ C) Tm1 (◦ C) * ∆Hm1 (J/g) * Tm2 (◦ C) ** ∆Hm2 (J/g) ** Tg (◦ C)
INZEA 353.7 ± 4.0 ab 390.7 ± 1.5 a 112.3 ± 0.5 a 35.0 ± 0.9 a 168.4 ± 3.7 a 9.3 ± 1.8 a 47.2 ± 0.6 a
INZEA_10ASF 355.7 ± 1.2 a 392.7 ± 0.6 a 113.6 ± 0.3 b 30.3 ± 0.5 bc 170.2 ± 0.2 a 12.6 ± 0.2 bc 45.3 ± 0.1 a
DAY 0 INZEA_10ASC 339.9 ± 6.0 cd 381.7 ± 11.3 a 113.3 ± 0.1 b 33.6 ± 1.5 ab 170.2 ± 0.1 a 13.5 ± 0.5 c 45.2 ± 0.6 a
INZEA_25ASF 331.0 ± 2.0 d 388.7 ± 0.6 a 113.7 ± 0.2 b 25.6 ± 1.7 d 169.8 ± 0.2 a 10.7 ± 0.2 ab 45.8 ± 0.3 a
INZEA_25ASC 345.0 ± 1.0 bc 393.3 ± 1.2 a 114.0 ± 0.1 b 28.9 ± 2.0 dc 170.2 ± 0.2 a 11.3 ± 1.0 abc 45.9 ± 0.4 a
INZEA 290.7 ± 1.5 ab 394.3 ± 2.1 a 113.6 ± 0.3 a 37.5 ± 1.1 a 165.9 ± 0.7 a 10.0 ± 0.3 a 50.0 ± 0.2 a
INZEA_10ASF 297.5 ± 5.2 b 393.3 ± 0.7 a 113.7 ± 0.2 a 35.6 ± 0.2 ab 164.3 ± 2.0 a 9.8 ± 1.2 a 45.2 ± 0.2 a
DAY 15 INZEA_10ASC 293.3 ± 1.5 ab 394.0 ± 1.0 a 113.7 ± 0.2 a 38.2 ± 1.1 a 166.5 ± 0.2 a 10.3 ± 0.5 a 44.9 ± 0.3 a
INZEA_25ASF 306.0 ± 5.6 c 388.7 ± 0.6 b 113.3 ± 0.1 a 29.6 ± 0.3 c 159.9 ± 0.9 ab 5.5 ± 0.7 b 45.4 ± 0.2 a
INZEA_25ASC 286.0 ± 1.0 a 391.7 ± 1.5 ab 112.7 ± 0.1 b 31.3 ± 3.6 bc 150.0 ± 0.4 c 4.5 ± 0.5 b 45.4 ± 0.2 a
INZEA 300.3 ± 0.6 a 393.3 ± 0.6 a 113.6 ± 0.1 a 41.4 ± 0.8 a 166.1 ± 0.6 a 5.2 ± 3.3 a 45.2 ± 0.2 a
INZEA_10ASF 287.3 ± 1.2 b 391.8 ± 1.3 ab 113.7 ± 0.2 a 37.6 ± 0.4 a 166.2 ± 0.4 a 4.5 ± 0.6 a 45.5 ± 0.3 ab
DAY 28 INZEA_10ASC 299.7 ± 1.2 a 393.3 ± 0.6 a 113.8 ± 0.3 a 39.9 ± 0.6 a 166.3 ± 0.8 a 6.2 ± 2.4 a 45.5 ± 0.3 ab
INZEA_25ASF 271.3 ± 5.8 c 394.0 ± 1.0 a 110.9 ± 0.7 b 50.2 ± 2.1 b n.d. n.d. 44.9 ± 0.2 a
INZEA_25ASC 275.3 ± 2.1c 389.7 ± 0.6 b 112.0 ± 0.2 c 40.0 ± 4.0 a n.d. n.d. 45.9 ± 0.2 b
INZEA 298.0 ± 3.6 a 394.3 ± 2.1 a 113.6 ± 0.2a 44.1 ± 0.1 a 166.6 ± 0.2 a 13.4 ± 0.6 a 44.3 ± 0.2 a
INZEA_10ASF 287.3 ± 3.2 b 393.3 ± 0.6 a 113.2 ± 0.1 ab 41.1 ± 0.3 a 167.0 ± 2.8 a 4.5 ± 2.9 b 46.6 ± 0.1 b
DAY 40 INZEA_10ASC 287.7 ± 3.2 b 392.7 ± 0.6 a 113.3 ± 0.1 ab 40.9 ± 2.9 a 166.9 ± 2.6 a 5.5 ± 1.0 b 45.0 ± 0.1 c
INZEA_25ASF n.d. 382.7 ± 1.2 b 112.9 ± 0.3 b 38.7 ± 1.1 a n.d. n.d. n.d.
INZEA_25ASC n.d. 389.0 ± 1.0 c 112.3 ± 0.3 c 44.6 ± 5.3 a n.d. n.d. n.d.
INZEA 292.3 ± 6.7 a 392.7 ± 2.1 a 111.5 ± 0.4 ab 47.4 ± 3.0 a 144.8 ± 2.1 a 4.1 ± 1.3 a 44.8 ± 0.3 a
INZEA_10ASF 286.3 ± 2.5 a 392.3 ± 1.5 a 110.9 ± 0.3 a 42.0 ± 0.8 a 151.7 ± 4.7 a 3.9 ± 0.6 a 44.5 ± 0.3 a
DAY 69 INZEA_10ASC 283.3 ± 3.8 a 391.0 ± 1.7 a 111.7 ± 0.7 a 50.0 ± 7.2 a 144.9 ± 2.6 a 4.0 ± 0.6 a 45.0 ± 0.2 a
INZEA_25ASF n.d. 382.3 ± 0.6 b 111.1 ± 0.1 ab 39.5 ± 0.4 a n.d. n.d. n.d.
INZEA_25ASC n.d. 391.7 ± 1.5 a 112.6 ± 0.1 b 45.6 ± 7.4 a n.d. n.d. n.d.
INZEA 284.7 ± 4.7 a 392.3 ± 1.2 a 108.9 ± 0.9 a 46.0 ± 0.8 a 142.4 ± 0.8 a 5.4 ± 0.3 a 44.8 ± 0.1 a
INZEA_10ASF 281.7 ± 1.2 a 388.7 ± 0.6 a 110.6 ± 0.5 ab 42.8 ± 4.4 ab n.d. n.d. n.d.
DAY 90 INZEA_10ASC 276.7 ± 3.2 a 392.7 ± 0.6 a 109.7 ± 1.5 ab 35. ± 3.4 bc n.d. n.d. n.d.
INZEA_25ASF n.d. 374.3 ± 0.6 b 110.6 ± 0.3 ab 32.0 ± 2.5 c n.d. n.d. n.d.
INZEA_25ASC n.d. 384.3 ± 6.4 a 111.8 ± 0.3 b 40.9 ± 5.6 abc n.d. n.d. n.d.
DSC: * and ** correspond to the first and second melting peaks appearing in Figure 8, respectively. Different superscripts (a, b, c, ab, abc) within the same day of study indicate statistically
significant different values (p < 0.05). Tpeak1 and Tpeak2 : first and second maximum degradation temperatures, respectively; Tm1 and Tm2 : first and second melting temperatures,
respectively; ∆Hm1 and ∆Hm2 : First and second enthalpies of fusion, respectively; Tg : glass transition temperature.You can also read


