Weighted gene co expression network analysis identifies modules and functionally enriched pathways in the lactation process
←
→
Page content transcription
If your browser does not render page correctly, please read the page content below
www.nature.com/scientificreports
OPEN Weighted gene co‑expression
network analysis identifies
modules and functionally enriched
pathways in the lactation process
Mohammad Farhadian1*, Seyed Abbas Rafat1, Bahman Panahi2 & Christopher Mayack3
The exponential growth in knowledge has resulted in a better understanding of the lactation process
in a wide variety of animals. However, the underlying genetic mechanisms are not yet clearly known.
In order to identify the mechanisms involved in the lactation process, various mehods, including
meta-analysis, weighted gene co-express network analysis (WGCNA), hub genes identification, gene
ontology (GO), and Kyoto Encyclopedia of Genes and Genomes (KEGG) pathway enrichment at before
peak (BP), peak (P), and after peak (AP) stages of the lactation processes have been employed. A
total of 104, 85, and 26 differentially expressed genes were identified based on PB vs. P, BP vs. AP,
and P vs. AP comparisons, respectively. GO and KEGG pathway enrichment analysis revealed that
DEGs were significantly enriched in the “ubiquitin-dependent ERAD” and the “chaperone cofactor-
dependent protein refolding” in BP vs. P and P vs. P, respectively. WGCNA identified five significant
functional modules related to the lactation process. Moreover, GJA1, AP2A2, and NPAS3 were defined
as hub genes in the identified modules, highlighting the importance of their regulatory impacts on
the lactation process. The findings of this study provide new insights into the complex regulatory
networks of the lactation process at three distinct stages, while suggesting several candidate genes
that may be useful for future animal breeding programs. Furthermore, this study supports the notion
that in combination with a meta-analysis, the WGCNA represents an opportunity to achieve a higher
resolution analysis that can better predict the most important functional genes that might provide a
more robust bio-signature for phenotypic traits, thus providing more suitable biomarker candidates
for future studies.
Lactation is a key process for the secretion of milk from the mammary glands. It is a complex and dynamic bio-
logical process, which is an essential part of the mammalian reproduction system1,2. The milk production rate
in most mammalians follows a dynamic curve. After an initial increase in milk yield during early lactation, the
lactation rate reaches a peak point. Then, production slowly decreases gradually until the end of the lactation
process3. Therefore, the lactation process can be divided into three distinct stages; namely, before peak (BP),
peak (P), and after peak (AP) phases of lactation. The last step of the process is known as lactation persistency4.
It has been proposed that an increase in production persistency is an alternative approach which can be used to
increase total milk production3.
Detailed knowledge of lactation biology at the molecular level is inevitable for the identification of direct
causative genes responsible for milk production in livestock breeding programs5. The different milk composition
at each lactation step can be determined by measuring the transcriptional regulation of the underlying g enes3.
Different metabolic and regulatory pathways that produce fatty acids, amino acids, and carbohydrates are also
involved in the lactation process, and they may determine the nutritional quality of the produced milk3. For
instance, casein and whey protein genes are highly expressed throughout all lactation stages in cattle. It has been
reported that during the lactation process, transcriptionally-regulated genes are mostly enriched in terms of
1
Department of Animal Science, Faculty of Agriculture, University of Tabriz, Tabriz, Iran. 2Department of Genomics,
Branch for Northwest & West Region, Agricultural Biotechnology Research Institute of Iran (ABRII), Agricultural
Research, Education and Extension Organization (AREEO), Tabriz, Iran. 3Molecular Biology, Genetics, and
Bioengineering, Faculty of Engineering and Natural Sciences, Sabancı University, Istanbul 34956, Turkey. *email:
Mohammad.farhadian@tabrizu.ac.ir
Scientific Reports | (2021) 11:2367 | https://doi.org/10.1038/s41598-021-81888-z 1
Vol.:(0123456789)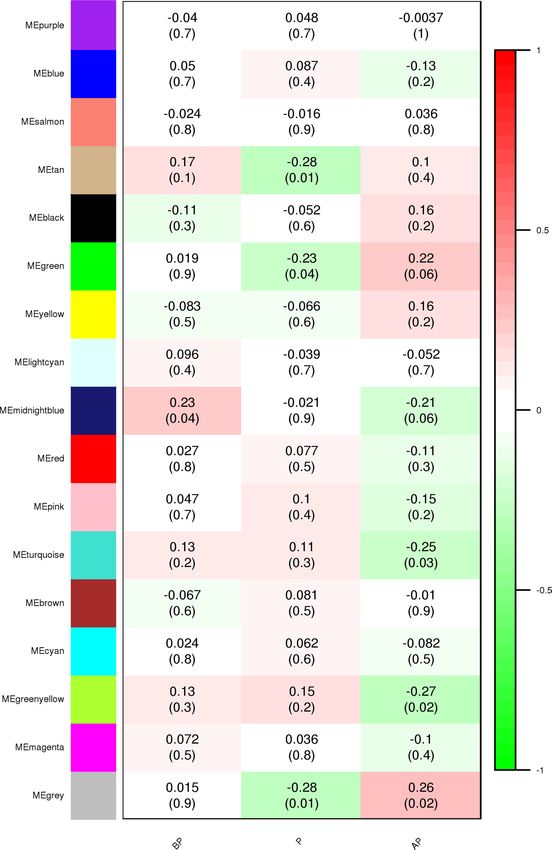
www.nature.com/scientificreports/
Fisher method Invnorm method
Common genes DEG DE IDD Loss DE IDD Loss UP DOWN
BP vs. P 14,122 104 103 10 0 73 10 30 78 26
BP vs. AP 13,738 85 83 10 0 57 8 24 21 64
P vs. AP 13,738 26 24 9 0 10 9 11 9 17
Table 1. Results of meta-analysis of RNA-Seq data using Fisher and Invorm methods. DE: corresponds to the
number of differentially expressed genes. IDD: Integration Driven discoveries (the number of genes that are
declared DE in the meta-analysis that were not identified in any of the individual studies). Loss: the number of
genes that are identified DE in individual studies but not in meta-analysis.
receptor activity, catalytic activity, and signal transducer activity6. Moreover, the regulatory impacts of JAK-STAT
, p38 MAPK, and the PI3 kinase pathway on lactation processes have been previously r eported6.
High-throughput whole-transcriptome sequencing technologies, such as microarray and RNA-Seq, pro-
duce an efficient and comprehensive description of the gene expression profiles in a given tissue over time7–10.
The RNA-seq technology has been applied for studying different mammals, e.g., in Assad and Churra s heep11,
Ghezel sheep12, Holstein c attle13, Jersey and Kashmiri c attle6, Buffalo14,15, humans16, Holstein and Jersey c ows17
and goats18. However, analyses typically focuses on differentially expressed gene screening, while the degree
of interconnection between the involved genes has not yet been investigated. Because the genes with similar
expression patterns may be related in term of function, identifying genes with correlated expression can shed
more light on their possible f unctions19. The weighted gene co-expression network can be constructed using
the WGCNA algorithm20,21. The WGCNA has been used to dissect the feed efficiency of dairy cattle22, the milk
transcriptome of buffalos15, and the liver and muscle transcriptome of lambs23, thereby highlighting the power
of the co-expression networks to provide deep insights into these complex processes. In our previous study,
involving the meta-analysis of milk microarray data from Rat, Wallaby, and Bos Taurus, we identified 31 genes
involved in the lactation process4. Overall, we found that the candidate genes frequently enhanced cell immunity
and growth systems4.
In the current study, we first performed a transcripotme meta-analysis to identifiy master-key responsive
genes involved at the three stages of the lactation process. Then, the results of the meta-analysis were integrated
into system biology approaches, i.e., weighted gene co-expression network analysis, and machine learning models
to identify functional modules along with hub genes in each module.
Results
Meta‑analysis. A number of studies related to the lactation process were selected. Our objective was to
identify differentially-expressed genes (DEGs) to explain the transcriptome variation across different lactation
stages. Therefore, we performed a meta-analysis of differentially expressed genes. A total of five studies, covering
79 samples, were selected for the meta-analysis. The samples were divided into BP, P, and AP to identify DEGs;
each period included 26, 24, and 29 samples, respectively. The range of raw sequence reads per sample was 22.9
to 60.4 million (Supplementary Table S1). Meta-analysis provided information on the number of DEGs, the
number of genes that are declared DEG in the meta-analysis that were not identified in any of the individual
studies or integration driven discoveries (IDD), and the number of genes that are identified as DEG in individual
studies but not in the meta-analysis (loss genes). The results of the meta-analysis performed using two methods
are presented in Table 1.
Table 1 indicates that the p value technique combined with Fisher and inverse normal methods for BP vs. P,
BP vs. AP, and P vs. AP comparisons give 103 and 73, 83 and 57, 24 and 10 DEGs, respectively. The number of
new DEGs (IDD) identified using Fisher and inverse methods were 10:10, 10:8, and 9:9, respectively. A total of
104 DEGs (78 up-regulated and 26 down-regulated), 85 DEGs (21 up-regulated and 64 down-regulated), and
26 DEGs (9 up-regulated and 17 down-regulated) were found in BP vs. P, BP vs. AP, and P vs. AP comparisons.
The list of DEGs in BP vs. P, BP vs. AP, and P vs. AP comparisons is presented in Supplementary Files 1–3,
respectively.
Functional analysis of meta‑genes. The ubiquitin-dependent ERAD and chaperone cofactor-depend-
ent protein refolding terms were frequently enriched in the BP vs. P and P vs. AP comparisons, respectively
(Fig. 1). Enrichment analysis also highlighted ‘protein processing in endoplasmic reticulum’ and ‘response to
endoplasmic reticulum stress’ in the BP vs. P comparison. This is while in the P vs. AP meta-analysis, ‘protein
refolding’ was the only enriched term for a biological process. Regarding the molecular function category, ‘glu-
tamate receptor binding’ and ‘protein processing in endoplasmic reticulum’ were the enriched terms in the P vs.
AP, and BP vs. P meta-analysis, respectively.
The ‘protein processing in endoplasmic reticulum’ is the most important common pathway between associ-
ated modules and the DEGs.
Co‑expressed modules related to the lactation process. A total of 13,591 meta-genes were identi-
fied from the datasets across three species (i.e., Bos Taurus, Ovis aries, and Bubalus bubalis) (Supplementary
File 4). To identify genes that have a strong correlation among the meta-genes, a weighted gene co-expression
network analysis (WGCNA) was performed. Using the dynamic tree cutting algorithm, the meta-genes were
Scientific Reports | (2021) 11:2367 | https://doi.org/10.1038/s41598-021-81888-z 2
Vol:.(1234567890)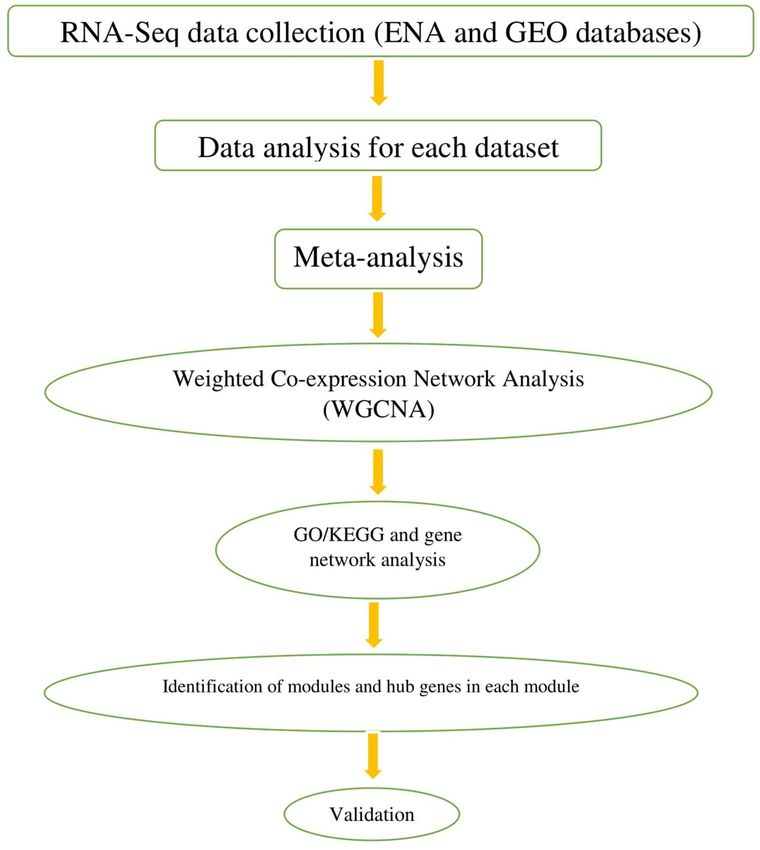
www.nature.com/scientificreports/
Figure 1. Network visualization of enriched pathways (GO/KEGG)24 in the gene signature was performed by
ClueGO analysis. (A) BP vs. P and (B) P vs. AP.
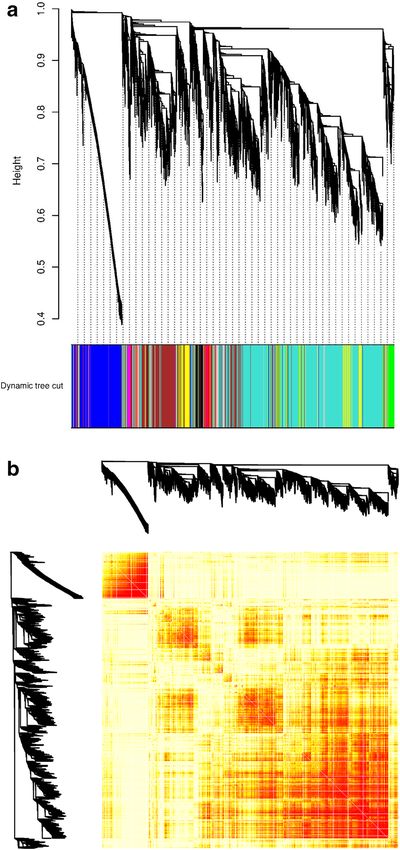
grouped into 17 modules, which ranged in size from 30 to 5815 genes per modules (Fig. 2A). The hierarchical
clustering of the meta-genes, from the three different species across the three different periods of lactation using
the topological overlap matrix (TOM), is presented in Fig. 2B.
A total of 17 modules were identified (Fig. 3). We show that the three major modules in the co-expresion
network include turquoise (n = 5818 genes), blue (n = 1915 genes), and brown (n = 1854 genes).
The 17 functional modules along with their correlation and p values are depicted in Fig. 4. It can be observed
that the midnight-blue; green, tan; green–yellow, and turquoise modules were specifically significant in BP, P, and
AP periods of lactation, respectively. The correlation coefficient and p value between the midnight-blue module
and the BP period of lactation were 0.26 and 0.04, respectively. The correlation coefficient and p value between
the green and tan modules and the P period of lactation were − 0.23 (0.04) and − 0.28 (0.01), respectively. Both
of these significant modules had a negative correlation with the P period of lactation. The correlation coefficient
and p value between the green–yellow and turquoise modules in the AP period of lactation were − 0.27 (0.02)
and − 0.25 (0.03), respectively.
The gene network visualization of the gene signatures for the meta-genes in groups BP vs. P, BP vs. AP, and P
vs. AP are presented in Fig. 5A–C, respectively. The value of the Betweenness Centrality (BC) is between 0 and
1. The node size in the networks represents the centrality of the corresponding nodes. The significance level for
the hub genes is set at BC ≥ 0.1.
Estimated parameters for BP vs. P, BP vs. AP, and P vs. AP networks are presented in Supplementary Files
5, 6, and 7, respectively. Based on the BC values in the BP vs. P comparison, the HSPA13, YWHAZ, PDIA3,
TM9SF3, and CUL3 genes were the top five genes. The RNASEL, MAPK4, SPI1, MYBL2, and MYBL1 genes were
determined as hubs in the BP vs. AP network. In the P vs. AP network, the HSPA8, ND5, ABCA2, GATA1, and
CYTB genes were the top five hub genes, having the highest value of the BC index.
The overlapping DEGs identified through the meta-analysis and the WGCNA (significant modules)
approaches are presented in Fig. 6 and Supplementary File 8. Results show that 116 meta-genes involved in sig-
nificant modules were identified by the WGCNA analysis. Additionally, the hypergeometric test was performed to
evaluate the certainty and probability of overlapping between the two approaches, resulting in a value of 0.9839.
Functional impacts of co‑expressed modules. A WGCNA was performed to identify genes that are
highly correlated among all meta-genes across different stages of lactation. To perform the functional enrich-
ment of the identified modules, we assigned all the top significant modules in each period of lactation into the
Scientific Reports | (2021) 11:2367 | https://doi.org/10.1038/s41598-021-81888-z 3
Vol.:(0123456789)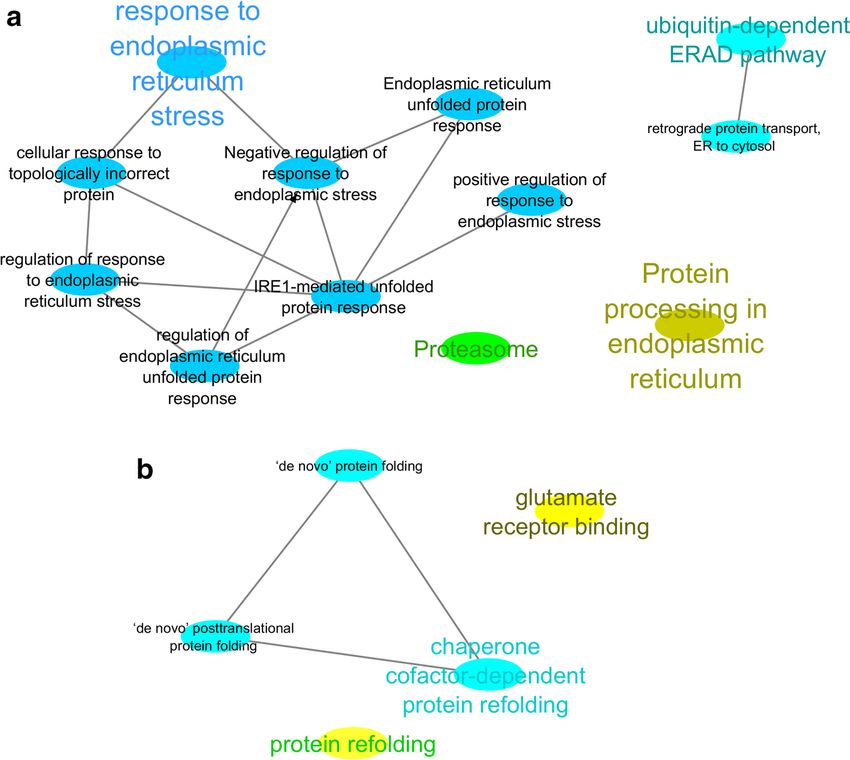
www.nature.com/scientificreports/

                                            Figure 2.  Weighted gene co-expression network analysis (WGCNA) of (A) the hierarchical cluster tree of
                                            13,591 meta-genes between the three species. The branches and color bands represent the assigned module; and
                                            (B) co-expression network modules. In the Topological Overlap Matrix (TOM) plot, the light color represents
                                            low overlap and the progressively darker red color represents higher overlap between the genes.

                                            ClueGO plugin in the Cytoscape software. The pathway enrichment analysis within the top significant modules
                                            indicated that the ‘primary bile acid biosynthesis’, ‘tight junction’, ‘Hippo signaling’, ‘adherens junction’, ‘Rap1
                                            signaling’, ‘phototransduction’, ‘metabolic fatty acid degradation’, and ‘fatty acid metabolism pathways’ were sig-
                                            nificantly enriched at BP, P, and AP stages, respectively.

                                            Hub genes identification and validation in co‑expressed modules. Five hub genes were extracted
                                            for each module (Supplementary File 9). The hub genes identified for each significant module are presented in
                                            Table 2.
                                                To validate the identified hub genes, supervised machine learning models were used. Decision Tree (DT) mod-
                                            els identified gene bio-signatures that can discriminate different temporal points of lactation. The classification

          Scientific Reports |   (2021) 11:2367 |                https://doi.org/10.1038/s41598-021-81888-z                                                   4

Vol:.(1234567890)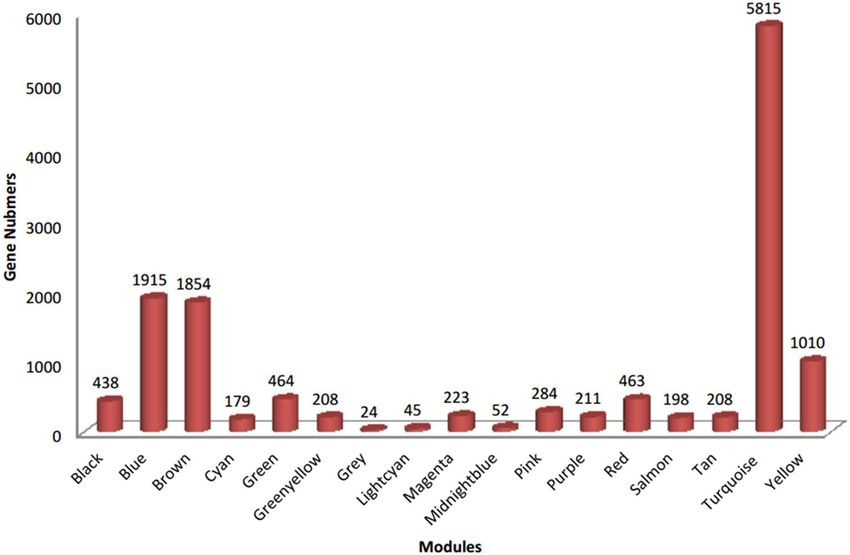
www.nature.com/scientificreports/
Figure 3. The 17 modules identified by the weighted co-expression analysis (WGCNA) along with the number
of genes in each module.
accuracy of the constructed models, based on four criteria, i.e., Information Gain Ratio, Information Gain, Gini
Index, and Accuracy, are presented in Table 3.
Results show that DT with the information gain criterion gained the highest (79%) accuracy (Fig. 7). The
DT highlighted the role of the top-ranked genes in the classification of different lactation stages based on the
expression value of meta-genes25. As shown in Fig. 7, the GJA1 gene has the potential to be considered as a bio-
marker for the lactation process as it is located at the root of the constructed tree. When the value of the GJA1
gene was greater than 8.687, and the value of AP2A2 gene was greater than 10.144, the samples fell into the AP
stage. Moreover, if the last feature was equal or lower than 10.144, and the value of the FBXW9 gene was greater
than 6.483, the sample would fall into the P stage. If the last feature was equal or greater than 6.483, samples
would fall into the AP stage.
The importance of the GJA1, AP2A2, FBXW9, NPAS3, INTS1, CDKN2C, HOXC9, and SFI1 in turquoise,
turquoise, tan, green, turquoise, turquoise, tan, and turquoise modules, respectively, were confirmed using the
DT models, highlighting the critical roles of these hubs in the lactation process.
Discussion
Lactation is known to be associated with a number of physiological and metabolic changes. To gain new insights
into the expression and connections of master-key regulatory genes during the lactation process, we analyzed the
milk RNA-Seq transcriptome profiling data at different lactation stages using a meta-analysis. Then, we integrated
the meta-analysis results into the WGCNA approach. Using the above-mentioned integrative computational
and systems biology approach, a set of components responsible for different phases of the lactation process
were identified, enabling us to determine which genes play a major role in each period of lactation. Overall,
the meta-analysis detected 104, 85, and 26 DEGs for the BP vs. P, BP vs. AP, and P vs. AP comparisons, 73.5%,
25.5%, and 34.6% of which were categorized as up-regulated, while 26.4%, 74.4%, and 65.3% were categorized
as down-regulated in BP vs. P, BP vs. AP, and P vs. AP comparisons, respectively.
The ‘response to endoplasmic reticulum stress’ GO term was enriched in BP vs. P periods within the meta-
analysis. Milk fat depression studies in laboratory a nimals26 suggest that endoplasmic reticulum (ER) stress
plays a role in the regulation of lipogenic pathways in mammary epithelial cells in m ice27,28. Meta-genes of the
P vs. AP comparison indicated that there was an enrichment in the protein refolding biological process term,
and that casein is a well-known major component of milk protein29. The role of chaperone-like activity30 and
the aggregation inhibitor function31 for casein have been proved to affect other types of milk protein, including
b-lactoglobulin32,33, a-lactalbumin32, and milk whey p roteins34. Therefore, casein is important for the stabiliza-
30
tion of milk whey p rotein . One of the main functions of the glutamate receptor in rats involves the regulation
of the growth h ormone35. The endoplasmic reticulum synthesizes almost all lipids, including phospholipids
and cholesterol. The endoplasmic reticulum (ER) is a critical site for protein, lipid, and glucose metabolism,
lipoprotein secretion, and calcium h omeostasis36. Previous research has demonstrated that intracellular triglyc-
eride droplets, known as cytoplasmic lipid droplets, are secreted into milk as plasma membrane bilayer-coated
structures (i.e., milk fat globules)37.
Scientific Reports | (2021) 11:2367 | https://doi.org/10.1038/s41598-021-81888-z 5
Vol.:(0123456789)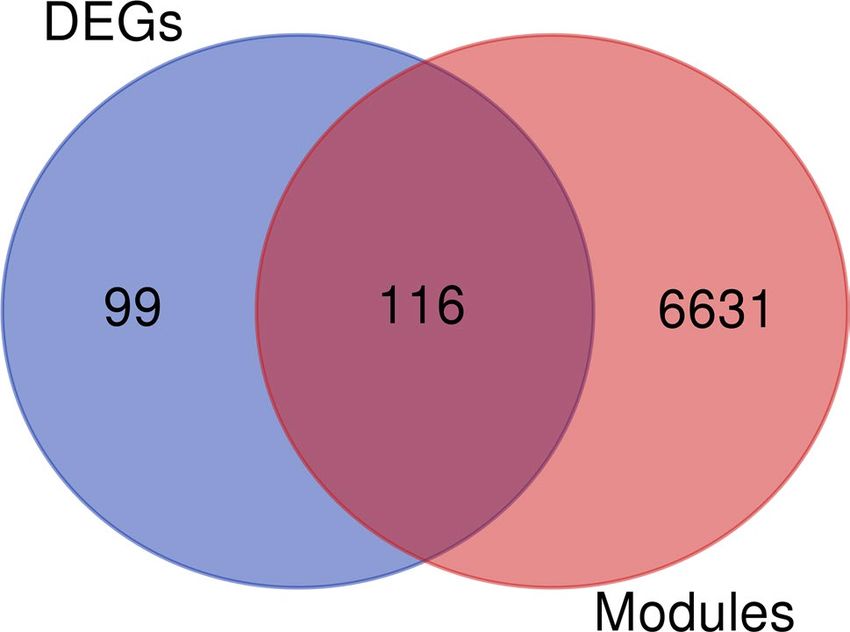
www.nature.com/scientificreports/

                                            Figure 4.  The module trait relationship (p value) for identified modules (y-axis) in relation with traits (x-axis).
                                            X-axis legend: BP = before peak; P = Peak; AP = after peak.

          Scientific Reports |   (2021) 11:2367 |                https://doi.org/10.1038/s41598-021-81888-z                                                        6

Vol:.(1234567890)
www.nature.com/scientificreports/
Figure 5. Gene networks for DEGs involved in the lactation process. (A) BP vs. P; (B) BP vs. AP; and (C) P vs.
AP comparisons are shown. The mapping strategy of using low parameter values corresponding to bright colors
was used for node coloring. The brightest color is green and the darkest color is red. The default middle color is
yellow.
Scientific Reports | (2021) 11:2367 | https://doi.org/10.1038/s41598-021-81888-z 7
Vol.:(0123456789)www.nature.com/scientificreports/
Figure 6. The Venn diagram representing the number of DEGs selected by the meta-analysis and the number
of genes selected by the significant modules in the weighted co-expression analysis.
Lactation stages
BP P AP
Module Modules Modules
Midnight-blue Green Tan Green–yellow Turquoise
FUZ YAP1 CAMSAP3 P2RX3 EIF1AX
ZNF32 TOM1L1 SIX5 IQCA1 MAGOH
ACOT8 ESRP1 ARHGEF16 FAM71F2 BAG6
WDR18 TEAD1 TMEM120B CATSPERD POMP
KLHDC3 SOWAHB GPRC5B LIM2 CAPZB
Table 2. Hub genes in significant modules at BP, P and AP stages of lactation.
Criteria Accuracy
Information gain 79.03
Information gain ratio 50.63
Gini index 67.85
Accuracy 78.35
Table 3. Comparison of classification accuracy of constructed Decision Tree (DT) models using different
criteria.
Co-expression network analysis of meta-genes identified 17 co-expressed modules across all three stages of
lactation. The significant modules identified included 1 (midnight-blue), 2 (green, tan), and 2 (green–yellow and
turquoise) modules for BP, P, and AP periods of lactation, respectively.
Primary bile acid biosynthesis is the only enriched pathway found in the midnight-blue module during the
BP period of lactation. Bile acids are steroid carboxylic acids derived from cholesterol in vertebrates38. It has
been demonstrated that cholesterol esters, glycerides, and phospholipids of milk are all made from fatty acids
within the mammary g land38. Bile acids play an important role in animal husbandry because they promote the
digestion and absorption of fat and fat-soluble substances, saving the energy of the animal, promoting animal
growth, and thereby improving carcass quality of l ivestock39.
Two significant modules in the P period of lactation are associated with the activation of four pathways,
i.e., the tight junction, Hippo signaling, Adherens junction, and the Rap1 signaling pathway. In the mammary
gland, during lactation, the tight junctions of the alveolar epithelial cells are impermeable, and, consequently,
they allow milk to be stored between nursing periods without leakage of milk components from the lumen.
Nonetheless, mammary epithelial tight junctions are dynamic, and a number of stimuli can regulate them40.
Systemic factors such as progesterone, prolactin, and glucocorticoids along with local factors, such as TGF-beta
intra-mammary and pressure play a crucial role in the regulation of mammary tight junctions. On the other
Scientific Reports | (2021) 11:2367 | https://doi.org/10.1038/s41598-021-81888-z 8
Vol:.(1234567890)www.nature.com/scientificreports/
Figure 7. Graphical model of decision tree using Information Gain criterion based on hub genes in three
different stages of lactation (Before Peak (BP), Peak (P), and After Peak (AP)).
hand, the tight junction activation has a negative correlation with milk s ecretion40. The next enriched pathway
in the P period of lactation is the Hippo signaling pathway. This pathway plays an important role in the control
of organ size of animals, and it operates through the regulation of cell apoptosis and proliferation41. Moreover, it
has been reported that this pathway has a direct impact on the mammary gland development and the lactation
process42. Furthermore, cell proliferation and cell differentiation can sustain the growth of the mammary gland
and contribute to milk production4,43. The adherence junction is another activated pathway found in the P period
of lactation. Previous research has confirmed that the proteins of this pathway are involved in breast cancer44.
This pathway includes a number of intracellular components, such as p120-catenin, β-catenin, and α-catenin45.
Previous studies have demonstrated that the adherence junction in the epithelial cells aid in their survival dur-
ing lactation46. The last significant pathway in the P period is the Rap1 signaling pathway. Previous research has
found that the Rap1 pathway is a pivotal element in mammary epithelial cells47. All these enriched pathways
in the P period are involved in cell differentiation and proliferation of the mammary gland, and, consequently,
they influence milk production.
Two significant modules enriched four pathways (i.e., phototransduction, metabolic pathway, fatty acid deg-
radation, and fatty acid metabolism) in the AP period of lactation. Phototransduction is the conversion of light
into a change in the electrical potential across the cell membrane. This process activates some signals, leading to
the opening or closing of ion channels in the cell m embrane48. On the other hand, milk contains many mineral
ions, which are regulated by the ion channel control49. Three remain as activated pathways, including the meta-
bolic pathways, fatty acid degradation, and fatty acid metabolism, all of which contribute to fat metabolism. In
general, metabolic pathways are associated with a series of chemical reactions, such as fat metabolism. In most
cases of metabolic pathways, the product of one enzyme acts as the substrate for the next50. These enzymes
often require dietary minerals, vitamins, and other cofactors to function. In addition, milk components such
as proteins (whey 20% and casein 80%), carbohydrates, coated lipid droplets, water, and ions are synthesized
and secreted by the mammary g land51. Milk fat is considered as one of the most important factors in the quality
of dairy product in the dairy industry51,52. The main lipid-associated metabolic pathways include the following
steps: fatty acid transport, de novo fatty acid (FA) synthesis, FA synthesis, milk lipid synthesis, and finally droplet
formation and s ecretion51–53. Fat production and milk FA composition depend on the stages of lactation and
Scientific Reports | (2021) 11:2367 | https://doi.org/10.1038/s41598-021-81888-z 9
Vol.:(0123456789)www.nature.com/scientificreports/
No. of samples
Accession ID Species Reference BP P AP RNA source
SRP064718 Bos Taurus (Holestian-high milk production) Yang, et al. (2014) 3 3 – MFGs1
SRP125676 Bos Taurus Bhat SA, et al. (2019) 3 2 3 MECs2
SRP065967 Ovis aries Suárez-Vega, A., et al. (2016) 4 4 7 MSCs3
SRP144268 Bubalus bubalis (water buffalo) Arora R., et al. (2019) 4 4 4 Milk
SRP153744 Bubalus bubalis (Murrah buffaloes) Deng T., et al. (2019) 2 2 4 Biopsy
Table 4. Data set ID, species, and number of samples selected for meta-analysis. 1 MFGs = milk fat globules.
2
Mammary epithelial cells = MECs. 3 Milk Somatic Cells = MSCs.
the level of milk production52,54,55. In general, most pathways enriched in the AP period of lactation contributed
toward fat metabolism.
In addition, a number of key hub genes were identified in each module in the BP, P, and AP periods of lacta-
tion. In the P period, the FUZ gene had a higher intra-modular connectivity in the midnight-blue module, and
this gene is involved in the hedgehog signaling p athway56. This pathway is known to be involved in the develop-
ment process. Therefore, the regulation of the hedgehog pathway is necessary for the normal development of
the offspring56.
Two different modules were significantly correlated with the P period, i.e., the green and tan modules. The
main hub gene in the green module was the YAP1 gene. Based on the co-expression network results of previous
studies, the YAP1 gene is involved in the module which is related to milk lactose57. In the tan module, the CAM-
SAP3 gene was identified as the main hub gene. Previous genome-wide association studies (GWAS) on bovine
populations highlighted the contribution of this gene in mastitis c haracterization58. Mastitis is recognized by a
high cell count in the milk, which also happens to be one of the most important issues in the dairy industry in
terms of economic l osses58.
The main hub gene in the green–yellow module was the P2RX3 gene. It has been proposed that P2RX3 plays
an important role in the immune s ystem59. Prior studies have also confirmed that milk production results in a
better functioning immune system4. The gene EIF1AX was identified as a main hub gene in the turquoise module,
and we now know that this gene contributes to the synthesis of milk protein60.
Materials and methods
Data collection. The RNA-Seq datasets related to the lactation process were downloaded from the Gene
Expression Omnibus (GEO) and European Nucleotide Archive (ENA) databases. Five RNA-Seq datasets for
three different species, i.e., Bos Taurus, Ovis aries, and Bubalus bubalis (Table 4), were included in our study.
Detailed information on the datasets is presented in Supplementary Table S1.
The first dataset (SRP064718) had 12 biological samples from six Chinese Holstein cows, which were divided
into two groups, i.e., a high production group and a low production group. Samples in this dataset were collected
at 10 days (n = 3) and 70 days (n = 3) after lactation, which were used as before peak and peak samples in the
meta-analysis, respectively. The second dataset (SRP125676) covers mammary epithelial cells (MECs) at differ-
ent stages of lactation (15, 90, and 250 days) from both Jersey and Kashmiri cattle. In this dataset, the samples
from day 15 were included as before peak (Jersey = 3 and Kashmiri = 3 samples), from day 90 as peak (Jersey = 2
and Kashmiri = 3 samples), and from day 250 as the after peak group (Jersey = 3 and Kashmiri = 3 samples). The
third dataset (SRP065967) covers milk somatic cells (MECs) from two dairy sheep breeds, i.e., Churra and Assaf.
Milk samples were collected at the 10th, 50th, 120th, and 150th day of lactation. The samples obtained from
each breed were treated as a separate dataset. Samples from the entire dataset were divided into three groups,
i.e., before peak (day 10), peak (day 50), and after peak (days 120 and 150). The SRP153744 dataset consisted of
samples from Murrah buffaloes at four different stages of lactation, i.e., the 4th, 50th, 140th, and 280th day of
lactation. The samples from day 4 were considered to be before peak lactation, day 50 samples were considered to
be peak samples, and samples from the 140th and 280th days were considered to be in the after peak group. The
fifth dataset (SRP144268) consisted of samples from buffalo milk. Four buffaloes were in each group (early, mid,
and late lactation). The early, mid, and late stage samples were collected at 30–54, 117–136, and 250–273 days
postpartum, respectively. All the steps of data collection and downstream analysis are presented in Fig. 8.
RNA‑Seq data processing. The quality of the raw data was assessed using FastQC (v 0.11.5) s oftware61
and low quality reads were trimmed using the Trimmomatic (v 0.32) software62. The clean and trimmed read of
sheep, cow, and buffalo were mapped onto the Ovis aries (Oar_v4.0), Bos Taurus (Btau_5.0.1), Bubalus bubalis
(UOA_WB_1) reference genomes (available at www.ncbi.gov/genome), respectively, using Tophat (version2)63.
Subsequently, The mapped reads from the BAM files were counted and assigned to each gene using the HTSeq-
count64. To make an accurate comparison of gene expression between groups, the count values were first nor-
malized. Then, differentially-expressed genes (DEGs) were screened using D ESeq265 (version 1.28.1) in R, using
the Bioconductor package with default parameters. In this study, we used library size, size factor normalization
factors, and group as covariate. The DESeq2 model internally corrects for library size; therefore, transformed or
normalized values, such as counts scaled by library size, should not be used as input. The variance stabilizing
transformations (VST)66–68 function was used to estimate the sample differences65. The VST function does not
Scientific Reports | (2021) 11:2367 | https://doi.org/10.1038/s41598-021-81888-z 10
Vol:.(1234567890)www.nature.com/scientificreports/
Figure 8. Flowchart of the performed meta-analysis and WGCNA analysis of the lactation process using the
RNA-Seq datasets.
remove variation that can be associated with batch or other covariates. So, we used the “removeBatchEffect”
function for remove batch v ariations65. Since it is not necessary to re-estimate the dispersion values, we used the
blind = False option. The library size and other normalization factors have been normalized through this trans-
formation. The samples belong each study were normalized together, means each dataset normalized separately.
The PCA plot for before and after normalization modes are presented in the Supplementary Table S2. The
cutoff for differential expression was set at a fold change ≥|2| along with a corrected p value of ≤ 0.0569.
Since we used the gene lists for weighted co-express analysis using WGCNA packages which is designed for
clustering genes based on their expression profiles. So, we filter genes which has a counts less than 10 in more
than 90% of samples because these low expressed genes tend to reflect noise and correlations based on counts
that are mostly zero aren’t really meaningful.
Meta‑analysis. In order to identify key genes in the lactation process, a meta-analysis was performed for the
three stages of the lactation process. As data originally came from three different species, to check the effects of
heterogeneous data sources on DEGs, ten attribute weighting algorithms were applied and the results showed the
type of organism had no or little effect on the selected gene list4. First, BLAST pipeline was employed to identify
the orthologous across three species70. Then, p values of differentially expressed genes in each dataset were cal-
culated. Finally, p values were combined using the Fisher method, which was implemented in the metaRNA-Seq
bioconductor package71. The combination of individual p values into one statistical test is defined as:
S
x 2 = −2 ln(pgs )
a=1
Scientific Reports | (2021) 11:2367 | https://doi.org/10.1038/s41598-021-81888-z 11
Vol.:(0123456789)www.nature.com/scientificreports/
where pi indicates the individual p value obtained from the gene, g signifies the experiment, and S is the total
number of experiments. Based on the null hypothesis, the distribution of test statistic is x 2 with 2 degrees of
freedom. Based on Table 1, we defined three stages of lactation (i.e., BF, P, and AP); therefore, three meta-analysis
comparisons were performed as BP vs. P, BP vs. AP, and P vs. AP.
Co‑expression network construction. Meta-genes in each comparison (i.e., BP vs. P, BP vs. AP, and P
vs. AP) were determined using the direct merging approach as described in a previous s tudy72. Then, expres-
sion values of meta-genes were normalized and subjected to the WGCNA, using the Bioconductor R package
(version 3.5.1)20, for weighted co-expression network construction. In summary, the similarity matrix between
each pair of genes across all samples was calculated based on its Pearson’s correlation value. Then, the similarity
matrix was transformed into an adjacency matrix. Subsequently, the topological overlap matrix (TOM) and the
corresponding dissimilarity (1-TOM) value were computed. Finally, a dynamic tree cut (DTC) algorithm was
employed to detect gene co-expression modules. The modules were constructed with a cut height of 0.975, and
a minimum module size of 30 genes.
Protein–protein interaction (PPI) network of the identified modules was constructed based on the STRING
database (https://string-db.org/)73 as prescribed by74. To visualize the constructed networks, the Cytoscape soft-
ware (version 3.7.2)75 was used.
Gene ontology analysis of significant modules. To interpret the biological significance of the DEGs,
enrichment analysis was performed based on Gene Ontology and KEGG pathways24. ClueGO was used to illus-
trate overrepresented Gene Ontology (GO). ClueGO is a Cytoscape plug-in that visualizes the non-redundant
etwork76.
biological terms for large numbers of genes, and integrates the GO terms to create a GO/pathway n
Identification and validation of hub genes. Hub genes, defined as highly interconnected nodes
in each module, are considered as functionally-important genes77. To identify the hub genes, the moduleEi-
gengenes function was used for calculating the modules’ eigengenes, considered as the principal component of
each module. Each network has several properties, including intramolecular connectivity ( Kwithin), total connec-
tivity (Ktotal), and module membership (ME), which can be used for the identification of genes with a high degree
of connectivity within a module (i.e., hub genes)78. It is suggested that the hub genes may have a significant
biological function within their module78.
In this study, the connectivity scores within the modules were calculated using between-centrality indices.
The Cytoscape software (version 3.7.2)75 was used to visualize significant modules, and the hub genes in each
corresponding module.
In order to validate and evaluate the hub genes’ efficiency for distinguishing different stages of lactation, the
identified meta-genes with their corresponding expression values were subjected to feature (i.e., gene) selection
based on ten weighting algorithms, i.e., PCA, Uncertainty, Relief, Chi Squared, Gini Index, Deviation, Rule, Gain
Ratio, Information Gain, and Support-Vector Machines (SVM). Meta-genes with weighting values higher than
0.7 were selected for the construction of the Decision Tree (DT). The DTs were constructed using Information
Gain, Information Gain ratio, Gini index, and Accuracy criteria along with the leave-one-out cross-validation
(LOOCV) method. In this procedure, the initial dataset was split into a training set and a testing set. One sample
from the initial dataset is consecutively discarded for the testing set, while the others remain for the t raining25,79.
The PRISMA checklist is included as Supplementary Table S3.
Conclusions
In this study, we integrated a meta-analysis with the gene co-expression network analysis on RNA-Seq data to
identify the key genes involved in the Before Peak (BP), Peak (P), and After Peak (AP) stages of the lactation
process. The findings of this study highlighted the efficiency of the applied approaches for the identification of key
genes and major pathways, involved in the lactation process. Enrichment analysis of the identified meta-genes
highlighted the contribution of fat metabolism, cell differentiation, cell proliferation, milk protein production,
and immune competency to the lactation process. Interestingly, all the above-mentioned functions affect milk
quality and production. Furthermore, the findings of the current study support the notion that the WGCNA in
combination with meta-analysis can provide an opportunity to obtain a better resolution analysis, which can
better predict the most important functional genes that might provide a more robust bio-signature for phenotypic
traits, thereby possibly providing more promising biomarker candidates for future studies.
Received: 15 April 2020; Accepted: 13 January 2021
References
1. Capuco, A. V. & Akers, R. M. The origin and evolution of lactation. J. Biol. 8, 37 (2009).
2. Goldman, A. S., Chheda, S. & Garofalo, R. Evolution of immunologic functions of the mammary gland and the postnatal develop-
ment of immunity. Pediatr. Res. 43, 155 (1998).
3. Strucken, E. M., Laurenson, Y. C. & Brockmann, G. A. Go with the flow—Biology and genetics of the lactation cycle. Front. Genet.
6, 118 (2015).
4. Farhadian, M., Rafat, S. A., Hasanpur, K., Ebrahimi, M. & Ebrahimie, E. Cross-species meta-analysis of transcriptomic data in
combination with supervised machine learning models identifies the common gene signature of lactation process. Front. Genet.
9, 235 (2018).
Scientific Reports | (2021) 11:2367 | https://doi.org/10.1038/s41598-021-81888-z 12
Vol:.(1234567890)www.nature.com/scientificreports/
5. Wiggans, G. R., Cole, J. B., Hubbard, S. M. & Sonstegard, T. S. Genomic selection in dairy cattle: The USDA experience. Annu.
Rev. Anim. Biosci. 5, 309–327 (2017).
6. Bhat, S. A. et al. Comparative transcriptome analysis of mammary epithelial cells at different stages of lactation reveals wide dif-
ferences in gene expression and pathways regulating milk synthesis between Jersey and Kashmiri cattle. PLoS ONE 14, e0211773
(2019).
7. Panahi, B., Abbaszadeh, B., Taghizadeghan, M. & Ebrahimie, E. Genome-wide survey of alternative splicing in Sorghum bicolor.
Physiol. Mol. Biol. Plants 20, 323–329 (2014).
8. Panahi, B., Mohammadi, S. A., Ruzicka, K., Abbasi Holaso, H. & Zare Mehrjerdi, M. Genome-wide identification and co-expression
network analysis of nuclear factor-Y in barley revealed potential functions in salt stress. Physiol. Mol. Biol. Plants 25, 485–495
(2019).
9. Panahi, B., Mohammadi, S. A. & Ebrahimie, E. Identification of miRNAs and their potential targets in halophyte plant Thellungiella
halophila. BioTechnologia 94, 285–290 (2014).
10. Panahi, B. & Hejazi, M. A. Integrative analysis of gene expression and alternative splicing in microalgae grown under heterotrophic
condition. PLoS ONE 15, e0234710 (2020).
11. Suárez-Vega, A. et al. Characterization and comparative analysis of the milk transcriptome in two dairy sheep breeds using RNA
sequencing. Sci. Rep. 5, 18399 (2015).
12. Farhadian, M., Rafat, S. A., Panahi, B. & Ebrahimie, E. Transcriptome signature of two lactation stages in Ghezel sheep identifies
using RNA-Sequencing. Anim. Biotechnol. 1–11 (2020).
13. Yang, J. et al. Differential expression of genes in milk of dairy cattle during lactation. Anim. Genet. 47, 174–180 (2016).
14. Arora, R. et al. Buffalo milk transcriptome: A comparative analysis of early, mid and late lactation. Sci Rep. 9, 5993 (2019).
15. Deng, T. et al. Integrative analysis of transcriptome and GWAS data to identify the hub genes associated with milk yield trait in
buffalo. Front. Genet. 10, 36 (2019).
16. Lemay, D. G. et al. RNA sequencing of the human milk fat layer transcriptome reveals distinct gene expression profiles at three
stages of lactation. PLoS ONE 8, e67531 (2013).
17. Wickramasinghe, S. et al. Transcriptome profiling of bovine milk oligosaccharide metabolism genes using RNA-sequencing. PLoS
ONE 6, e18895 (2011).
18. Crisà, A., Ferrè, F., Chillemi, G. & Moioli, B. RNA-Sequencing for profiling goat milk transcriptome in colostrum and mature milk.
BMC Vet. Res. 12, 264 (2016).
19. Yuan, L. et al. Co-expression network analysis of biomarkers for adrenocortical carcinoma. Front. Genet. 9, 328 (2018).
20. Langfelder, P. & Horvath, S. WGCNA: An R package for weighted correlation network analysis. BMC Bioinform. 9, 559 (2008).
21. Panahi, B., Farhadian, M. & Hejazi, M. A. Systems biology approach identifies functional modules and regulatory hubs related
to secondary metabolites accumulation after transition from autotrophic to heterotrophic growth condition in microalgae. PLoS
ONE 15, e0225677 (2020).
22. Salleh, S., Mazzoni, G., Løvendahl, P. & Kadarmideen, H. Gene co-expression networks from RNA sequencing of dairy cattle
identifies genes and pathways affecting feed efficiency. BMC Bioinform. 19, 513 (2018).
23. Sabino, M. et al. Gene co-expression networks in liver and muscle transcriptome reveal sex-specific gene expression in lambs fed
with a mix of essential oils. BMC Genomics 19, 236 (2018).
24. Kanehisa, M., Sato, Y., Furumichi, M., Morishima, K. & Tanabe, M. New approach for understanding genome variations in KEGG.
Nucleic Acids Res. 47, D590–D595 (2019).
25. Panahi, B., Mohammadi, S. A. & Doulati-Baneh, H. Characterization of Iranian grapevine cultivars using machine learning models.
Proc. Natl. Acad. Sci. India Sect. B Biol. Sci. 90, 615–621 (2020).
26. Bobrovnikova-Marjon, E. et al. PERK-dependent regulation of lipogenesis during mouse mammary gland development and
adipocyte differentiation. Proc. Natl. Acad. Sci. 105, 16314–16319 (2008).
27. Invernizzi, G., Thering, B. J., McGuire, M. A., Savoini, G. & Loor, J. J. Sustained upregulation of stearoyl-CoA desaturase in bovine
mammary tissue with contrasting changes in milk fat synthesis and lipogenic gene networks caused by lipid supplements. Funct.
Integr. Genomics 10, 561–575 (2010).
28. Bauman, D. E., Harvatine, K. J. & Lock, A. L. Nutrigenomics, rumen-derived bioactive fatty acids, and the regulation of milk fat
synthesis. Annu. Rev. Nutr. 31, 299–319 (2011).
29. Dalgleish, D., Horne, D. & Law, A. Size-related differences in bovine casein micelles. Biochim. Biophys. Acta Gen. Subj. 991, 383–387
(1989).
30. Sakono, M., Motomura, K., Maruyama, T., Kamiya, N. & Goto, M. Alpha casein micelles show not only molecular chaperone-like
aggregation inhibition properties but also protein refolding activity from the denatured state. Biochem. Biophys. Res. Commun.
404, 494–497 (2011).
31. Bhattacharyya, J. & Das, K. P. Molecular chaperone-like properties of an unfolded protein, αs-casein. J. Biol. Chem. 274, 15505–
15509 (1999).
32. Morgan, P. E., Treweek, T. M., Lindner, R. A., Price, W. E. & Carver, J. A. Casein proteins as molecular chaperones. J. Agric. Food
Chem. 53, 2670–2683 (2005).
33. Yong, Y. H. & Foegeding, E. A. Effects of caseins on thermal stability of bovine β-lactoglobulin. J. Agric. Food Chem. 56, 10352–
10358 (2008).
34. O’Kennedy, B. T. & Mounsey, J. S. Control of heat-induced aggregation of whey proteins using casein. J. Agric. Food Chem. 54,
5637–5642 (2006).
35. Tena-Sempere, M., Pinilla, L., Gonzalez, L. & Aguilar, E. Regulation of growth hormone (GH) secretion by different glutamate
receptor subtypes in the rat. Amino Acids 18, 1–16 (2000).
36. Fu, S., Watkins, S. M. & Hotamisligil, G. S. The role of endoplasmic reticulum in hepatic lipid homeostasis and stress signaling.
Cell Metab. 15, 623–634 (2012).
37. Mather, I. H. & Keenan, T. W. Origin and secretion of milk lipids. J. Mammary Gland Biol. Neoplasia 3, 259–273 (1998).
38. Patton, S. & McCarthy, R. Structure and synthesis of milk fat. IV. Role of the mammary gland with special reference to the cho-
lesterol esters. J. Dairy Sci. 46, 396–400 (1963).
39. Govers, M. J. et al. Calcium in milk products precipitates intestinal fatty acids and secondary bile acids and thus inhibits colonic
cytotoxicity in humans. Can. Res. 56, 3270–3275 (1996).
40. Nguyen, D.-A.D. & Neville, M. C. Tight junction regulation in the mammary gland. J. Mammary Gland Biol. Neoplasia 3, 233–246
(1998).
41. Chen, Q. et al. A temporal requirement for Hippo signaling in mammary gland differentiation, growth, and tumorigenesis. Genes
Dev. 28, 432–437 (2014).
42. Do, D. N. & Ibeagha-Awemu, E. M. Non-coding RNA roles in ruminant mammary gland development and lactation. In Current
Topics in Lactation, 55–81 (2017).
43. Farhadian, M., Rafat, S. A., Hasanpur, K. & Ebrahimie, E. Transcriptome signature of the lactation process, identified by meta-
analysis of microarray and RNA-Seq data. Biotechnologia 99, 153–163 (2018).
44. Owens, M. B., Hill, A. D. & Hopkins, A. M. Ductal barriers in mammary epithelium. Tissue Barriers 1, e25933 (2013).
45. Hartsock, A. & Nelson, W. J. Adherens and tight junctions: Structure, function and connections to the actin cytoskeleton. Biochim.
Biophys. Acta Biomembr. 1778, 660–669 (2008).
Scientific Reports | (2021) 11:2367 | https://doi.org/10.1038/s41598-021-81888-z 13
Vol.:(0123456789)www.nature.com/scientificreports/
46. Shamir, E. R. & Ewald, A. J. Adhesion in mammary development: Novel roles for E-cadherin in individual and collective cell
migration. In Current Topics in Developmental Biology Vol. 112 353–382 (Elsevier, Amsterdam, 2015).
47. Itoh, M., Nelson, C. M., Myers, C. A. & Bissell, M. J. Rap1 integrates tissue polarity, lumen formation, and tumorigenic potential
in human breast epithelial cells. Can. Res. 67, 4759–4766 (2007).
48. Bradshaw, R. A. & Dennis, E. A. Handbook of Cell Signaling (Academic Press, Cambridge, 2009).
49. Kamikawa, A., Sugimoto, S., Ichii, O. & Kondoh, D. Decrease in an inwardly rectifying potassium conductance in mouse mammary
secretory cells after forced weaning. PLoS ONE 10, e0141131 (2015).
50. Papachristodoulou, D., Snape, A., Elliott, W. H. & Elliott, D. C. Biochemistry and Molecular Biology (Oxford University Press,
Oxford, 2014).
51. Bauman, D., Mather, I., Wall, R. & Lock, A. Major advances associated with the biosynthesis of milk. J. Dairy Sci. 89, 1235–1243
(2006).
52. Bionaz, M. & Loor, J. J. Gene networks driving bovine milk fat synthesis during the lactation cycle. BMC Genomics 9, 366 (2008).
53. Bauman, D. E. & Griinari, J. M. Nutritional regulation of milk fat synthesis. Annu. Rev. Nutr. 23, 203–227 (2003).
54. Bernard, L., Leroux, C., Chilliard, Y. & Bösze, Z. Bioactive Components of Milk, Advances in Experimental Medicine and Biology
(Springer Publisher, 2008).
55. Kay, J. et al. Effects of week of lactation and genetic selection for milk yield on milk fatty acid composition in Holstein cows. J.
Dairy Sci. 88, 3886–3893 (2005).
56. Hatsell, S. & Frost, A. R. Hedgehog signaling in mammary gland development and breast cancer. J. Mammary Gland Biol. Neoplasia
12, 163–173 (2007).
57. Do, D., Dudemaine, P.-L., Li, R. & Ibeagha-Awemu, E. Co-expression network and pathway analyses reveal important modules
of miRNAs regulating milk yield and component traits. Int. J. Mol. Sci. 18, 1560 (2017).
58. Chen, X., Cheng, Z., Zhang, S., Werling, D. & Wathes, D. C. Combining genome wide association studies and differential gene
expression data analyses identifies candidate genes affecting mastitis caused by two different pathogens in the dairy cow. Open J.
Anim. Sci. 5, 358 (2015).
59. Coutinho-Silva, R., Knight, G. E. & Burnstock, G. Impairment of the splenic immune system in P2X2/P2X3 knockout mice.
Immunobiology 209, 661–668 (2005).
60. Yu, C. et al. 14-3-3 γ affects eIF5 to regulate β-casein synthesis in bovine mammary epithelial cells. Can. J. Anim. Sci. 96, 478–487
(2016).
61. Andrews, S. FastQC: A quality control tool for high throughput sequence data (2010).
62. Bolger, A. M., Lohse, M. & Usadel, B. Trimmomatic: A flexible trimmer for Illumina sequence data. Bioinformatics 30, 2114–2120
(2014).
63. Kim, D. et al. TopHat2: Accurate alignment of transcriptomes in the presence of insertions, deletions and gene fusions. Genome
Biol. 14, R36 (2013).
64. Anders, S., Pyl, P. T. & Huber, W. HTSeq—A Python framework to work with high-throughput sequencing data. Bioinformatics
31, 166–169 (2015).
65. Love, M. I., Huber, W. & Anders, S. Moderated estimation of fold change and dispersion for RNA-seq data with DESeq2. Genome
Biol. 15, 550 (2014).
66. Anders, S. & Huber, W. Differential expression analysis for sequence count data. Nat. Preced. 11, R106 (2010).
67. Huber, W., von Heydebreck, A., Sültmann, H., Poustka, A. & Vingron, M. Parameter estimation for the calibration and variance
stabilization of microarray data. Stat. Appl. Genet. Mol. Biol. 2, 3 (2003).
68. Tibshirani, R. Estimating transformations for regression via additivity and variance stabilization. J. Am. Stat. Assoc. 83, 394–405
(1988).
69. Benjamini, Y. & Hochberg, Y. Controlling the false discovery rate: A practical and powerful approach to multiple testing. J. R. Stat.
Soc. Ser. B (Methodol.) 57, 289–300 (1995).
70. Martín-Durán, J. M., Ryan, J. F., Vellutini, B. C., Pang, K. & Hejnol, A. Increased taxon sampling reveals thousands of hidden
orthologs in flatworms. bioRxiv, 050724 (2016).
71. Rau, A., Marot, G. & Jaffrézic, F. Differential meta-analysis of RNA-seq data from multiple studies. BMC Bioinform. 15, 91 (2014).
72. Panahi, B., Frahadian, M., Dums, J. T. & Hejazi, M. A. Integration of cross species RNA-seq meta-analysis and machine-learning
models identifies the most important salt stress-responsive pathways in microalga dunaliella. Front. Genet. 10, 752 (2019).
73. Szklarczyk, D. et al. STRING v10: Protein–protein interaction networks, integrated over the tree of life. Nucleic Acids Res. 43,
D447–D452 (2014).
74. Panahi, B., Mohammadi, S. A., Khaksefidi, R. E., Fallah Mehrabadi, J. & Ebrahimie, E. Genome-wide analysis of alternative splicing
events in Hordeum vulgare: Highlighting retention of intron-based splicing and its possible function through network analysis.
FEBS Lett. 589, 3564–3575 (2015).
75. Shannon, P. et al. Cytoscape: A software environment for integrated models of biomolecular interaction networks. Genome Res.
13, 2498–2504 (2003).
76. Bindea, G. et al. ClueGO: a Cytoscape plug-in to decipher functionally grouped gene ontology and pathway annotation networks.
Bioinformatics 25, 1091–1093 (2009).
77. Tahmasebi, A., Ashrafi-Dehkordi, E., Shahriari, A. G., Mazloomi, S. M. & Ebrahimie, E. Integrative meta-analysis of transcriptomic
responses to abiotic stress in cotton. Prog. Biophys. Mol. Biol. 146, 112–122 (2019).
78. Degli Esposti, D. et al. Co-expression network analysis identifies gonad-and embryo-associated protein modules in the sentinel
species Gammarus fossarum. Sci. Rep. 9, 1–10 (2019).
79. Lorenzon, R. et al. Clinical and multi-omics cross-phenotyping of patients with autoimmune and autoinflammatory diseases: The
observational TRANSIMMUNOM protocol. BMJ Open 8, e021037 (2018).
Acknowledgements
The authors would like to thank the Iran National Science Foundation (INSF, Grant No. 98023162) for financial
support. This research is supported by a research grant from the University of Tabriz (Number 3421).
Author contributions
M.F. research concept and design, data analysis and interpretation, wrote the article, and final approval of the
article. S.R. and C.M. wrote the article. B.P. data analysis and interpretation, critical revision of the article, and
final approval of the article.
Competing interests
The authors declare no competing interests.
Scientific Reports | (2021) 11:2367 | https://doi.org/10.1038/s41598-021-81888-z 14
Vol:.(1234567890)www.nature.com/scientificreports/
Additional information
Supplementary Information The online version contains supplementary material available at https://doi.org/
10.1038/s41598-021-81888-z.
Correspondence and requests for materials should be addressed to M.F.
Reprints and permissions information is available at www.nature.com/reprints.
Publisher’s note Springer Nature remains neutral with regard to jurisdictional claims in published maps and
institutional affiliations.
Open Access This article is licensed under a Creative Commons Attribution 4.0 International
License, which permits use, sharing, adaptation, distribution and reproduction in any medium or
format, as long as you give appropriate credit to the original author(s) and the source, provide a link to the
Creative Commons licence, and indicate if changes were made. The images or other third party material in this
article are included in the article’s Creative Commons licence, unless indicated otherwise in a credit line to the
material. If material is not included in the article’s Creative Commons licence and your intended use is not
permitted by statutory regulation or exceeds the permitted use, you will need to obtain permission directly from
the copyright holder. To view a copy of this licence, visit http://creativecommons.org/licenses/by/4.0/.
© The Author(s) 2021, corrected publication 2021
Scientific Reports | (2021) 11:2367 | https://doi.org/10.1038/s41598-021-81888-z 15
Vol.:(0123456789)You can also read