Characterizing bulk rigidity of rigid red blood cell populations in sickle cell disease patients - Nature
←
→
Page content transcription
If your browser does not render page correctly, please read the page content below
www.nature.com/scientificreports
OPEN Characterizing bulk rigidity
of rigid red blood cell populations
in sickle‑cell disease patients
Mario Gutierrez1, Mark Shamoun2, Katie Giger Seu3, Tyler Tanski1, Theodosia A. Kalfa3 &
Omolola Eniola‑Adefeso1,4,5*
In this work, we utilized a parameterization model of ektacytometry to quantify the bulk rigidity of
the rigid red blood cell (RBC) population in sickle cell disease (SCD) patients. Current ektacytometry
techniques implement laser diffraction viscometry to estimate the RBC deformability in a whole blood
sample. However, the diffraction measurement is an average of all cells present in the measured
sample. By coupling an existing parameterization model of ektacytometry to an artificially rigid
RBC model, we formulated an innovative system for estimating the average rigidity of the rigid
RBC population in SCD blood. We demonstrated that this method could more accurately determine
the bulk stiffness of the rigid RBC populations. This information could potentially help develop the
ektacytometry technique as a tool for assessing disease severity in SCD patients, offering novel
insights into the disease pathology and treatment.
Sickle Cell Disease (SCD) is one of the most common and complex genetic blood disorders worldwide1–3. SCD
originates as a mutation of the gene encoding for the oxygen-binding protein, hemoglobin. There are multiple
genotypes of this hereditary blood disorder, all characterized by the production of mutated hemoglobin S (HbS)3.
Red blood cells (RBCs) with a high content of HbS have a significantly reduced oxygen-binding capability and a
high propensity to polymerize under hypoxic c onditions1,4. The formation of a polymer nucleus and the increased
concentration of unbound oxygen inside the RBC then induces oxidative damage on the cellular membrane,
leading to a loss in membrane deformability5. The oxidative damage to the cell membrane also makes the RBCs
prone to lyse, resulting in anemia and the release of hemoglobin into the open bloodstream, which damages the
vascular wall, i.e., upregulation of inflammation m arkers6–12. As such, SCD is characterized by extremely detri-
mental symptoms, including pulmonary hypertension, anemia, and vaso-occlusion that can cause chronic organ
damage3. These SCD symptoms are also accompanied by severe pain episodes known as “crisis” that represent a
atients3. Chronic inflammation, vaso-occlusion, and overall nega-
significantly reduced quality of life for SCD p
tive symptoms in SCD originate from increased rigidity in the RBC m embranes3,11,13.
The current understanding of SCD is focused mostly on the biochemical and genetic components of the
disease. Conversely, the increased RBC membrane rigidity—separate from the sickled crescent-shape—is often
overlooked as a significant factor in disease severity. Yet, the presence of stiff RBCs in blood was recently shown
to reduce the vascular wall adhesion of white blood cells (WBCs) drastically and increase the vascular wall
adhesion of platelet14–16. This works potentially hint at a more significant role for RBC rigidity in SCD patients’
well-being beyond instigating vaso-occlusion. The rigidity and hemoglobin composition of RBCs in SCD patients
varies highly, and a high HbS content does not necessarily correlate to an increased cellular membrane stiffness17.
For example, there can be a scenario with a large population of HbS concentrated RBCs (%S fraction) with
moderate to low cellular membrane stiffness or another situation with a small %S fraction with RBCs with high
membrane stiffness.
Thus, a full understanding of the impact of RBC rigidity in SCD symptom presentation would require the
ability to characterize this property in individual patient blood. Therefore, several methods have been explored
to characterize the mechanical properties of RBCs, including micropipette aspiration, atomic force microscopy,
microfluidic devices, and optical tweezers. However, these methods are limited since they require single RBC
1
Department of Chemical Engineering, University of Michigan, Ann Arbor, MI 48109, USA. 2Department
of Pediatric Hematology/Oncology, University of Michigan, Ann Arbor, MI 48109, USA. 3Cancer and Blood
Disease Institute, Cincinnati Children’s Hospital Medical Center, University of Cincinnati College of Medicine,
Cincinnati, OH, USA. 4Department of Biomedical Engineering, University of Michigan, Ann Arbor, MI 48109,
USA. 5Macromolecular Science and Engineering Program, University of Michigan, Ann Arbor, MI 48109,
USA. *email: lolaa@umich.edu
Scientific Reports | (2021) 11:7909 | https://doi.org/10.1038/s41598-021-86582-8 1
Vol.:(0123456789)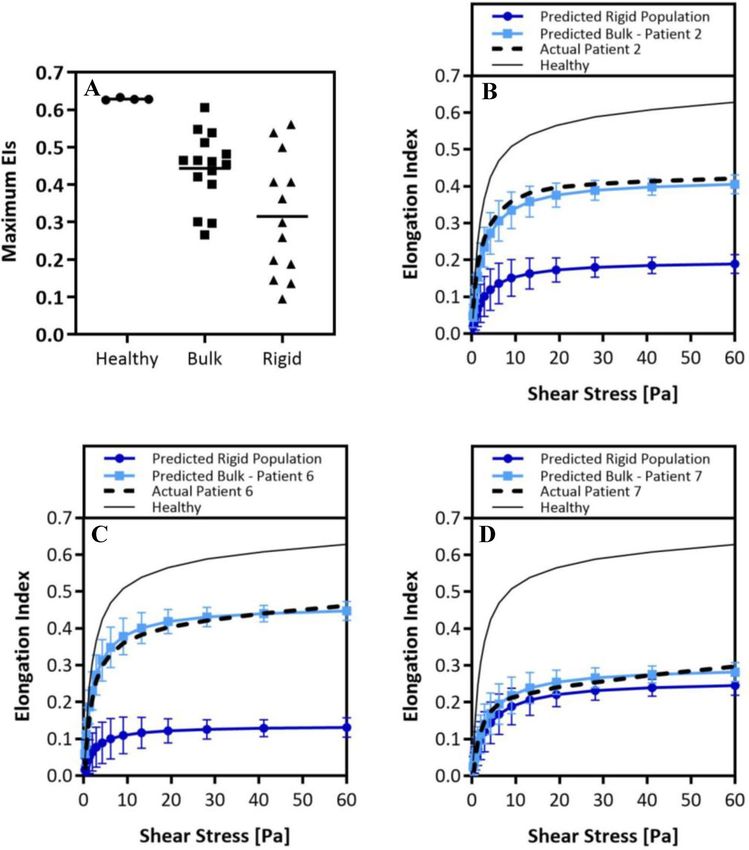
www.nature.com/scientificreports/
isolation and are static t echniques18. For one, the design and fabrication of robust microfluidic devices can be
highly labor-intensive19–21. Conversely, traditional ektacytometry, or laser diffractometry, is more convenient and
precise than other methods and thus has been adopted as a promising technique for testing RBC d eformability18.
Ektacytometry was initially developed and successfully used to screen for RBC membrane disorders such as
hereditary spherocytosis22. This method in recent decades has been repurposed for the investigation of SCD23.
Ektacytometry principally works by inducing controlled shear stress on a suspension of RBCs in diluted
blood. The resulting deformation from the applied shear stress is captured by shining a laser onto the sample,
which creates a single diffraction pattern. The general technique can make three different types of measurements:
(1) an Osmoscan which holds cells at constant shear stress while varying osmolality, (2) a deformability scan
which keeps cells at a fixed osmolality while changing the shear stress, (3) an Oxygenscan which varies both the
shear and oxygen gradient24–26. Cellular deformability, i.e., elongation, is then reported as an Elongation Index—
a ratio of the difference between the major and minor axes in the cellular diffraction patterns over their sum.
However, most works using ektacytometry to evaluate how RBC rigidity impact disease severity in SCD have
focused on osmoscans27,28, which may not entirely recreate the in vivo setting. RBCs in blood flow are exposed
to a relatively fixed in vivo osmolality (~ 290 mOsmol/kg) and varying shear as they transport through different
blood vessels. Alternatively, measurements that employ analysis of RBC elongation in response to changes in
shearing stresses at a fixed osmolality may offer a better description of RBC stiffness in S CD23. Oxygensans, the
other form of shear-based analysis, are a robust method recently developed, which can measure the maximum
RBC elongation at normal oxygen conditions and minimum RBC elongation under hypoxic conditions and
point of sickling26. However, regardless of the shear-based method employed, ektacytometry is critically limited.
It renders average deformability for all RBCs in the sample23–25, i.e., across both stiff and healthy RBCs. This
average measurement of deformability may underestimate the rigidity of HbS-rich (%S fraction) or sickle RBC
population in the blood, which could be a critical complication when it comes to assessing a patient’s well-being
or treatment response. A sample with a small overall fraction of extremely rigid RBCs could render a similar
elongation curve as a sample with a high fraction of moderately stiff RBCs. Previous studies have investigated
how laser diffractions in ektacytometry differ based on non-homogeneous mixtures of RBC deformability29.
However, to date, there is no established method for isolating and directly characterizing the rigidity of the HbS
RBC population in patient blood.
Here, we present an approach to estimate the average rigidity of the HbS-rich (rigid) red cell population in
SCD via a method that implements artificially rigidified RBCs mixed into whole blood at different rigid-to-
healthy ratios. Said samples are measured via traditional shear-based ektacytometry deformability analysis. We
then parameterize the measurements to develop a numerical model that predicts the rigid RBC population’s bulk
rigidity in SCD blood samples. This method can estimate the stiffness of sickled RBC populations with greater
certainty, potentially serving as a platform for understanding disease severity in SCD patients and monitoring
the efficacy of novel and established treatment options.
Results
Measurement of artificially rigid RBC populations in whole blood samples. In an ektacytometry
scan, a collection of Elongation Index (EI) values plotted as a function of shear stress renders deformability
curves. Previous work has determined that the critical factor in characterizing alterations in cell deformability is
the maximum achievable EI, i.e., EImax30. Accordingly, measurements from healthy donors registered the highest
EImax values (~ 0.62). In contrast, SCD donors tended to have lower EI max values. Next, we built an artificially
rigid RBC approach, where the RBC membrane stiffness is easily altered to test how changing the fraction of
rigid RBCs affects the E Imax of the whole blood. We artificially rigidified healthy donor RBCs via treatment with
tert-butyl hydroperoxide (TBHP) in varying concentrations to obtain RBCs with a range of stiffness from slightly
to highly rigid. Short interactions (< 60 min) with relatively low concentrations of TBHP (< 3.0 mM) induces lipid
peroxidation and membrane protein crosslinking in RBCs. Prolonged exposure will result in structural altera-
tion in protein networks and eventual RBC lysis31. We combined the stiffened RBCs with healthy (non-treated)
RBCs in whole blood at different stiff-to-healthy ratios and measured the changes to the EI values14. The result-
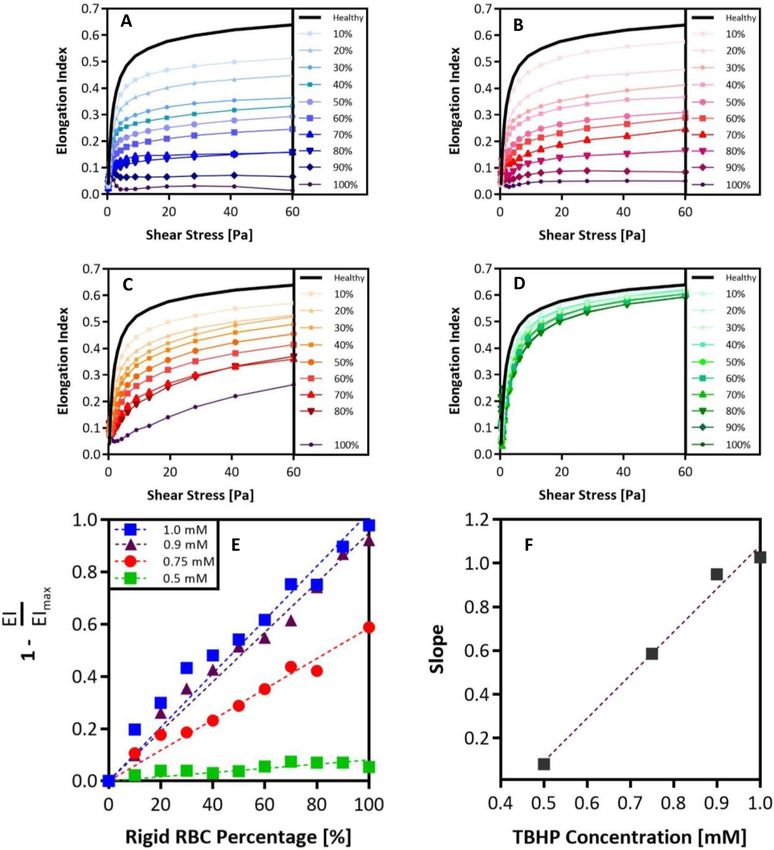
ing deformability curves plotted along with the curve for the 100% healthy RBCs sample are shown in Fig. 1.
As expected, ektacytometry measurements yielded smaller EIs as higher fractions of rigid RBCs were present in
the blood. Thus, the samples with 100% treated RBCs registered the lowest EImax for all TBHP concentrations
evaluated. However, the spread between the curves became less pronounced with lower TBHP concentrations.
Based on the 100% rigid fraction conditions, we observed that the highly stiff RBCs were the ones treated with
1.0 mM TBHP. The RBCs treated with 0.9 and 0.75 mM RBC treatments yielded intermediate stiffnesses while
the 0.5 mM TBHP treatment yielded only slightly rigid RBCs.
Building a predictive algorithm for estimating bulk stiffness of the rigid RBC population in
sickle cell disease blood. To understand how the spectrum of rigid RBC fractions affects EI curves and
EImax, we parameterized the curves in Fig. 1A–D. The EImax recorded in every blood sample was divided by the
average maximum EIs of healthy blood to produce a ratio of relative stiffness. Subsequently, we plotted these
EI ratios as a function of rigid RBC fractions, as shown in Fig. 1E. We found a linear relationship between the
EImax achieved and the rigid RBC fractions in a blood sample. As expected, the highly rigid RBCs in blood had a
more substantial impact on reducing the EImax than intermediate and slightly rigid RBCs, as shown by the slopes
of the linear trends in Fig. 1E plotted as a function of TBHP concentration in Fig. 1F. Parameterization of the
relationship between the slope of rigid EI-to-healthy EI ratios versus TBHP concentration implies that we can
interpolate between TBHP concentrations that were not experimentally tested. The correlations obtained by the
parameterization of the EI measurements in Fig. 1 were imported into a MATLAB code to construct a predictive
Scientific Reports | (2021) 11:7909 | https://doi.org/10.1038/s41598-021-86582-8 2
Vol:.(1234567890)www.nature.com/scientificreports/
Figure 1. Ektacytometry analysis of various rigid RBC populations with varying RBC membrane stiffnesses.
Ektacytometry curves for various rigid-to-healthy fractions ranging from 0 to 100% in increments of 10%
rigid RBCs present. Rigid RBCs have been treated with: (A) 1.0 mM. (B) 0.9 mM. (C) 0.75 mM. (D) 0.5 mM
TBHP. (E) Maximum EI recorded at 60 Pa for each rigid fraction condition is compared to E Imax of the healthy
condition, these ratios are plotted as a function of rigid RBC fraction present. Linear regression is used to
determine the slope of these rigid-to-healthy ratio trends. (F) Slopes of rigid-to-healthy ratio trends are plotted
as a function of TBHP concentration.
algorithm that can estimate the TBHP concentration, sample code available in supplementary material. Thus,
the rigid RBC population’s relative stiffness in a patient blood sample can be determined via two input variables:
(1) EImax recorded in the standard deformability measurement and (2) fraction of rigid or sickle RBCs in the
patient’s blood sample.
Given the linearity of the relationships between the stiffness and fraction of the rigid RBC population in a
blood sample, we hypothesized that our predictive algorithm could be used in combination with electrophoresis
and hemoglobin analysis of patient blood to map the relative stiffness of the rigid (HbS) RBC populations in SCD.
To this end, we measured the EIs for fifteen unique SCD patient blood samples. Table 1 lists the SCD genotype,
age, gender, current medical intervention/therapies, %S fraction, and measured maximum bulk EI for all patient
blood evaluated. A standard blood smear image was collected for patient 10, shown in Figure S1. The maximum
EI of each measured patient blood sample (measured bulk E Imax in Table 1) combined with the corresponding %S
fraction is used as initial inputs to estimate the maximum stiffness, i.e., E Imax, of the HbS only RBC population
Scientific Reports | (2021) 11:7909 | https://doi.org/10.1038/s41598-021-86582-8 3
Vol.:(0123456789)www.nature.com/scientificreports/
Patient SCD Genotype Age Gender Therapy %S Fraction Measured Bulk EImax Predicted Rigid RBC Pop. EImax
# - Years (M/F) - % - -
1 SS 13 M CT 20.7 0.465 ~ 0.01
2 SS 6 F CT 48.7 0.421 0.198
3 SC 18 M HU 50.3 0.465 0.299
4 SS 9 M CT 75.2 0.266 0.145
5 SS 19 F CT 21.1 0.539 0.188
6 SS 18 M CT 34.4 0.462 0.136
7 SS 13 M HU 89.9 0.297 0.259
8 SS 16 M CT 43.1 0.401 0.095
9 SS 1.5 F - 89.9 0.548 0.539
10 SS 15 M HU 79.3 0.454 0.407
11 SC 17 M HU 47.6 0.301 ~ 0.01
12 SS 15 M CT 55.8 0.482 0.362
13 SS 2 F CT 37.4 0.606 0.561
14 SS 21 F - 90.6 0.512 0.499
15 SS 15 M HU 86.6 0.437 0.407
Table 1. Sickle cell disease patient general information and ektacytometry maximum elongation values.
Information includes SCD genotype, age in years, gender (male or female), current patient therapy chronic
transfusions (CT) or Hydroxyurea (HU), %S fraction as determined by blood electrophoresis, and maximum
EI measured via ektacytometry in the actual SCD patient blood sample. The table also includes the predicted
EImax of rigid population, i.e., %S Fraction. Missing therapies indicate the patient is not under any type of
treatment at the time of the measurement.
for each patient. Meaning, we match each patient’s actual EI curve to an EI curve generated for an artificially
rigid RBC blood that matches the measured bulk E Imax and %S (i.e., rigid RBC) fraction of the patient’s blood.
The matched artificial EI curve, generated with the MATLAB algorithm, can then be backtracked to estimate
what TBHP concentration can produce a curve that matches the actual raw patient deformability curve. Hence,
the rigid RBC population’s apparent stiffness in the patient sample can be represented as a TBHP concentration.
That is, the rigid RBC population in the SCD patient blood has a rigidity similar to the rigidity of healthy RBCs
that had been artificially stiffened with a specified concentration of TBHP. Once we knew the representative
TBHP concentration for a given patient blood sample, we extrapolated the % rigid fraction to a 100% to predict
the maximum EI for 100% rigid RBCs, i.e., the maximum stiffness of only the rigid population or %S fraction.
The values of the maximum EIs of measured patient bulk blood (bulk) are plotted in Fig. 2A next to maximum
EIs obtained for healthy blood samples and the predicted maximum EIs of only the HbS (rigid) fraction for
each patient’s blood. We observed a very narrow range in maximum EI of healthy blood measurements, while a
wide range of maximum EIs is shown for SCD patient bulk blood measurements. Importantly, we saw a broader
distribution in the maximum EI values of only the HbS populations with an average lower than the average
maximum EIs of the raw SCD patient and healthy blood. From this data, we calculated ratios that compare the
estimated maximum EIs of the sickle population in the patient blood samples to (1) the maximum EI in a healthy
blood sample and (2) the maximum EI of the bulk SCD patient blood sample. A ratio value higher than unity
suggests that the maximum EI of the rigid RBC population is much lower than what is measured by bulk blood
measurement, thus underestimating the stiffness of the HbS population, i.e., sickled RBC, in an SCD patient.
Patient Predicted EImax of Rigid Population
Rigid to Healthy EI Fold Diff . = (1)
Healthy EImax (∼ 0.63)
Patient Predicted EImax of Rigid Population
Rigid to Bulk EI Fold Diff . = (2)
Patient Measured Bulk EImax
m
SS
SS1/2
EI(SS) = EIMax
m (3)
SS
SS1/2 +1
Subsequently, we used the predicted maximum EI of the rigid RBC population (shown as “rigid” in Fig. 2A)
for each patient’s blood to create a deformability curve for the patient’s HbS only population, labeled as “Predicted
Rigid Population” in Fig. 2B–D, according to an approach previously described by Baskurt et al32. This simplified
Skreestra-Bronkhorst model, Eq. (1), also takes into account parameters, such as the shear stress associated with
half the E
Imax (SS1/2, also estimated in our parameterization model) and the range of shear stresses (SS) evalu-
ated in the ektacytometry measurement. The variable “m” was a parameterization slope that was simply left at a
Scientific Reports | (2021) 11:7909 | https://doi.org/10.1038/s41598-021-86582-8 4
Vol:.(1234567890)www.nature.com/scientificreports/
Figure 2. Predicting the rigidity of the rigid RBC populations in sickle-cell disease patients. (A), Average
maximum EIs of healthy donors, actual bulk patient measured maximum EIs, and predicted maximum EIs
of rigid population. Actual healthy and patient ektacytometry curves compared with predicted patient bulk
ektacytometry curve and predicted curve of the rigid RBC population: (B), patient 2. (C), patient 6. (D), patient
7. Error analysis of the predicted EIs as a function of shear was performed using least square difference analysis.
Error bars are plotted as standard deviation of the predicted elongation values. Student’s t-tests are performed
to determine significance between Actual Patient curves and Predicted Bulk Curves, no significant difference is
found for any patient using an α = 0.05, p-values > 0.05.
value of 1. To confirm the validity of our approach to creating HbS, i.e., rigid population, only elongation curve,
we again utilized the Skreestra-Bronkhorst plotting model, Eq. (3) to see if the deformability curves of the SCD
patient bulk measurements can be replicated accurately, as well as a healthy deformability curve. We found an
acceptable precision of the parameterization model when we compared the elongation curve derived from the
actual measurement of a patient’s bulk blood to the predicted representative curve for the patient’s blood. The
precision is visually represented in Fig. 2B–D for patients 2, 6, and 7, which shows combined plots of the (1)
predicted HbS only RBC elongation curve alongside the (2) predicted patient bulk deformability curve, (3) actual
patient bulk deformability curve, and finally, the (4) a healthy deformability curve for reference. Supplementary
Figure S2 shows similar plots for all patients evaluated in this study.
Scientific Reports | (2021) 11:7909 | https://doi.org/10.1038/s41598-021-86582-8 5
Vol.:(0123456789)www.nature.com/scientificreports/
Interestingly, Figs. 2B and C show drastic differences in the bulk blood’s and the “sickle RBC” population’s
deformability curves. In some cases, the rigid population yielded a maximum EI that was ~ 2 times smaller than
what a bulk measurement yielded. However, in other cases, as shown in Fig. 2D, we observed very little difference
between the actual raw bulk measurement and the predicted curve of the sickle.
Discussion
One of the critical characteristics of SCD is the increased rigidity of the RBC membrane3,11,13. While there is
evidence of its crucial role in the evolution of symptoms in S CD33, RBC rigidity is often disregarded as a minor
side-effect of SCD rather than a critical biomarker. More than a mere inconvenience, RBC rigidity has the
potential to be utilized as an indicator of a patient’s condition or response to new medications or therapies. For
example, Gutierrez et al. showed that the presence of rigid RBCs in blood flow significantly reduced white blood
cells (WBCs)’ adhesion to an inflamed vascular w all14. Interestingly, the results found a non-linear correlation
between the fraction of rigid RBCs present in whole blood flow and the level of reduction in WBC adhesion
across a range of RBC stiffness levels as explored in this work14. Additional work by Qiu et al. investigates the
impact of rigid RBCs in blood flow on the functionality of the endothelium in a microvasculature-on-a-chip
device33,34. Results from this work showed that even in the absence of vaso-occlusion and complications relating
to hemolysis, endothelial dysfunction and increased permeability was detectable after only mechanical interac-
tions with stiffened RBCs. Although these studies have begun to unravel the critical associations between RBCs
stiffness and the complications seen in SCD, e.g., endothelial dysfunction and vaso-occlusion, there is still a
need for further sophisticated models for investigating the effect of RBC stiffness in SCD. More intricate models
also offer the potential to be used as analytical tests for novel therapeutics and understanding patient response
to medication.
In this work, we presented an estimation method that can more precisely characterize the rigid RBC popula-
tion’s stiffness in SCD based on the general shear-based ektacytometry measurement of patient blood. Originally
developed as a screening tool for RBC membrane disorders22, and repurposed for the investigation of SCD,
ektacytometry has yet to reached widespread clinical use. While ektacytometry has been proven to be a robust
method for investigating RBC deformability, it is not perfect. The bulk blood measurement achieved via Ektacy-
tometry deformability scans can register similar EI values for two different patients with vastly different stiffness
in the rigid RBC populations due to variation in the HbS fraction population. Here, we implemented artificially
rigid RBCs to evaluate rigid RBC fraction’s impact on bulk blood stiffness. Our results showed that ektacytometry
deformability measurements are highly influenced by the degree of RBC rigidity in the sample and the fraction
of rigid RBCs present (Fig. 1A–D). Samples containing rigid RBCs with a higher degree of stiffness showed the
highest variability in deformability analysis upon change of the rigid fraction. These deformability measurements
for artificially rigidified RBCs in blood allowed us to understand better how ektacytometry curves are altered
by the amount of the stiff (i.e., sickled) RBC population in SCD blood. This understanding formed the base of
our predictive model. Using the maximum EI measured and knowledge of the fraction of rigid RBCs in a mixed
sample, we can estimate the rigid population’s stiffness in a patient’s blood.
The rigid conditions in SCD patient blood can vary depending on the medication, age, and genotype. We
collected fifteen unique SCD whole blood samples from a diverse pool of donors ranging in SCD genotype,
age, gender, and current therapy (Table 1). We determined the fraction of HbS RBCs, i.e., what we denote as
the rigid population, in the patient sample via electrophoresis and HPLC hemoglobin analysis. Using what we
learned from the artificially stiffened RBCs in the blood combined with a raw ektacytometry measurement of
an SCD whole blood sample and hemoglobin data, we estimated the stiffness of the %S fraction, i.e., the rigid
population in an SCD patient.
Our results showed that the rigid population’s stiffness in an SCD patient sample is often underestimated
(Table 1). For patient 2, we see that the E Imax of the stiff RBCs, 48.7%, is 3.2 folds lower than the maximum EI
given by the bulk raw measurement. Similarly, the EImax of the stiff RBCs was 4.4, 4.7, and 6.7 folds smaller than
the bulk blood value for patients 4, 6, and 8, respectively. This result implies the HbS RBCs, i.e., rigid population,
in these SCD patients have a high degree of rigidity, which was similar to rigidity obtained for artificially rigidi-
fied RBCs incubated in 1.0 mM TBHP. Of note, the estimated stiffness of the rigid RBC population of patients 1
and 11 was predicted to be higher than the rigidity of our most stiff conditions measured and used to generate
the numeric algorithm, i.e., RBCs treated with 1.0 mM TBHP. For these samples, the interpolative model cannot
predict the rigid population’s max EI since it is out of range of our most stiff conditions measured (100% stiff
fraction, 1.0 mM TBHP). Still, the max EI of the rigid population is many folds greater than the maximum EI in
a healthy condition and the bulk raw standard measurement of the SCD sample. These conditions are denoted
as > 10∞ under the Rigid to Healthy EI Fold Difference Column in Table 1. It is important to note that this analysis
does not suggest that the maximum EI is always overestimated in every patient sample, but rather that it is a pos-
sibility. For example, for patients 9, 10, 13, 14, and 15, the maximum EI for the HbS RBCs was only ~ 1.1 times fold
lower than the bulk raw measurement maximum EI. The estimated maximum EI of the rigid RBC population is
compared to the maximum EI measured in the standard bulk deformability measurement, as shown in Fig. 2A.
We observe that the average maximum EI for the rigid populations in the SCD patients is notably lower, ~ 0.32,
compared to the standard bulk measurements, ~ 0.45. However, given the wide range of EIs constituting the
averages, a statistically significant average was not calculated.
We did not observe any specific correlation between the current therapy, i.e., chronic transfusion or hydroxyu-
rea, and the rigid population’s stiffness in an SCD patient sample. Hydroxyurea works by raising the levels of
fetal hemoglobin, HbF, in the patient’s RBCs, which increases the oxygen binding capability and is expected
to improve deformability in SCD RBCs35–37. However, one of the stiffest patient conditions we measured was
that of patient 11, who was being treated with hydroxyurea at the time of the sample collection. One potential
Scientific Reports | (2021) 11:7909 | https://doi.org/10.1038/s41598-021-86582-8 6
Vol:.(1234567890)www.nature.com/scientificreports/
explanation for this discrepancy might be the shorter length of time the patient was on hydroxyurea medication
than other patients on the same treatment. Also, we did not find a correlation between the stiffness of the rigid
population and the patient genotype. Due to the availability of donors, thirteen of fifteen donors were genotype
SS, and two donors were genotype SC. Again, one of the stiffest patient conditions measured was that of patient
11 with genotype SC. This observation is interesting since the genotype SC is typically regarded to be clinically
less severe compared to genotype SS in regards to symptoms and occurrences of painful crises3,38.
For patients 2 and 6, we predicted the maximum EI of the rigid RBC populations to be 3.2 and 4.7 folds
smaller than what was recorded in the measurement of their whole blood. That is, the predicted ektacytometry
curves are shown to be considerably different from the bulk, raw measurements (Fig. 2B and C). On the contrary,
we see there is not a considerable difference between the rigid population’s predicted curve and the actual bulk
measurement in patient 7, with only a 1.2 times fold difference in maximum EIs, Fig. 2D. This visualization of
the deformability curves shows our predictive model can estimate the rigid population’s stiffness in an SCD
patient sample with greater precision.
Although the method presented here can predict with greater precision the stiffness of the rigid RBC popu-
lation in an SCD patient blood sample, it is deficient in some areas. First, like traditional ektacytometry, our
model cannot distinguish which RBCs have undergone irreversible shape change, i.e., configuration to a sickled
crescent shape. Often a misunderstood disease, blood from SCD affected individuals is thought to be entirely
composed of sickle-shaped RBCs, i.e., crescent-shaped39. However, the reality is that irreversibly sickle-shaped
RBCs (ISCs) are highly fragile and short-lived40. Therefore, the majority of HbS-rich RBCs in circulation retain
their discocyte-shape and yet remain rigid40,41. An example of this is shown in Supplementary Figure S1, wherein
a standard blood smear of patient 10, genotype SS with a comparatively high %S fraction of 79.3%, only ~ 7.3%
of RBCs in the smear show shape deformation from regular RBC discocyte shape. Second, others have reported
that the presence of ISCs in a blood sample alters the elongation diffraction patterns imaged by ektacytometry42.
That is, higher amounts of ISCs lead to more considerable differences in apparent bulk elongation indices, similar
to results shown by Parrow et al. However, these studies focused on using Osmoscan a nalysis23,42.
Thirdly, our predictive model was built using the deformability measurements of artificially stiffened RBCs;
Thus, the degree of stiffness in this model system was uniform regardless of %rigid fraction. This assumption is
carried over when using the model to predict the stiffness of the %S fraction in an SCD patient blood sample.
However, it is essential to note that there is likely a range of stiffnesses in a patient’s %S RBC population, i.e., not
all rigid RBCs have the same degree of rigidity. The novelty of our model is the capability to neglect the contribu-
tion of the healthy, i.e., HbA, RBCs in a standard ektacytometry measurement. Another point of interest is that
the measurements performed in this study were standard deformability elongation analysis without any alteration
in the blood’s oxygen conditions. A recent development in ektacytometry technology is the Oxygenscan feature26,
which determines the point of sickling of HbS-rich cells in a blood sample by alternating oxygen conditions.
However, in terms of measuring a maximum elongation index at maximum shear stress, the end-result is still
the same regardless of oxygen conditions. Given our model is built using only information from maximum
elongation, our approach is complementary to the Oxygenscan.
Finally, improvements to the ektacytometry method, as demonstrated here, could increase its prevalence as
a reliable tool for measuring RBC rigidity. This approach can also lead to the utilization of ektacytometry as a
tool for understanding patient response to therapies. For example, blood transfusions are a standard treatment
for SCD p atients43. A previous work has proposed reducing the %S population to less than 30% is beneficial for
moderating symptoms in SCD patients44. However, the reasons why this is the case remain unexplored, and it is
unclear what role the stiffness of the %S population plays in altering symptoms. 44 The prior work by Gutierrez
et al. showing the presence of artificially rigid RBCs in blood flow reduces WBC adhesion to inflamed endothe-
lium drastically, depending on the RBC rigidity level and fraction in b lood14. Given the wide variability in the
stiffness of HbS-rich RBCs from patient to patient demonstrated in Fig. 2A, the arbitrary prescription of reduc-
ing the %S population to less than 30% with transfusion may not be ideal for every patient. Specifically, some
patients could have increase infection risk, depending on the amount and stiffness level of the HbS-rich RBCs
present in the blood. Thus, the insight into the stiffness of the HbS-rich RBC populations offered by our presented
method may be useful for optimizing transfusion therapies. In another example, as previously mentioned, Qiu
et al. show that rigid RBCs’ mechanical impact alone was sufficient to create endothelial injury33. This damage
to the endothelium led to inflammation, which causes endothelial dysfunction in SCD, contributing to c rises33.
Given that stiffened, HBS-rich RBCs have a higher propensity to marginate, i.e., migrate near the blood vessel
wall45 ,we anticipate these altered cells are likely well-positioned to cause endothelial damage regardless of their
composition in blood. Thus, understanding the rigidity level of the HbS population can offer insight into crisis
risk. However, more clinical studies are necessary to probe this possibility thoroughly.
Overall, this work presents an innovative approach for a more thorough examination of the ektacytometry-
based assessment of RBC stiffness in SCD patients. We utilize information from an RBC deformability measure-
ment combined with standard electrophoresis and hemoglobin analysis to build a parameterization model to
predict the rigid RBC population’s bulk rigidity in a patient’s blood with greater precision. Although extensive
future work is needed to prove ektacytometry as a robust clinical tool, knowledge from the presented model
offers a better understanding of the bulk stiffness in a rigid or sickle population of a patient blood sample. This
information could help diagnose disease severity in SCD, understand the variation of infection susceptibility in
different SCD patients, and assess how patients respond to blood transfusions or novel medications.
Scientific Reports | (2021) 11:7909 | https://doi.org/10.1038/s41598-021-86582-8 7
Vol.:(0123456789)www.nature.com/scientificreports/
Materials and methods
Human study approvals. Informed Consent was obtained before blood collection from all subjects and
parents of minors involved in the current study. The study received approval from the University of Michigan
Internal Review Board (IRB-MED and IRB-HSBS). All procedures were conducted following the tenets of the
Declaration of Helsinki.
Preparation of SCD patient blood. Fresh blood was obtained on the day of a patient’s routine clinical
visit via venipuncture. Blood was drawn into standard Vacutainer Lavender K2-EDTA tubes (BD) and stored
at 4 ºC. A single tube was taken from SCD patients. Blood samples were shipped in 4 ºC cold packs overnight
to Erythrocyte Diagnostics Laboratory of the Cancer and Blood Diseases Institute at the Cincinnati Children’s
Hospital for examination the following day. All SCD patient samples were measured within 24 h of blood draw.
Preparation of human Non‑SCD blood. Fresh blood was obtained from healthy, i.e., no SCD, donors on
the day of ektacytometer measurements via venipuncture. Blood was drawn into standard Vacutainer Lavender
K2-EDTA tubes (BD). Multiple tubes were taken from healthy donors. Blood from healthy donors was then
separated from WBC-rich plasma via a series of slow-speed centrifugation steps. RBCs from healthy donors
were washed thoroughly via suspension in phosphate-buffered saline (PBS -/-) and centrifugation. RBCs and
WBC-rich plasma were stored at 4 ºC until artificial rigidification and reconstitution, which was done right
before ektacytometry analysis.
Red blood cell rigidification and sample preparation. Washed RBCs from healthy donors were sus-
pended in a 2% hematocrit and incubated with a specific concentration of Luperox tert-butyl hydroperoxide
(TBHP) (Sigma-Aldrich). Four parent concentrations of TBHP were chosen as base RBC rigidities: 1.0, 0.9, 0.75,
and 0.5 mM TBHP. Incubation for 30 min induced the loss of RBC membrane flexibility. After adequate wash-
ing, stiffened RBCs were mixed with healthy RBCs in whole blood in increments of 10% rigid RBC fractions
up to a total of 100% while holding the hematocrit constant at ~ 40%. No RBC lysis was detected for the 30-min
incubation period for any of the TBHP concentrations evaluated.
Ektacytometry deformability measurements. All samples, both healthy and SCD donors, were meas-
ured independently using a LoRRca Maxsis Ektacytometer (Mechatronics Instruments BV, Zwaag, The Nether-
lands) at the Erythrocyte Diagnostics Laboratory of the Cancer and Blood Diseases Institute at the Cincinnati
Children’s Hospital. SCD whole blood samples and reconstituted healthy donor samples were diluted ~ 200 × in
polyvinylpyrrolidone (MW 360,000) solution. The solution is then transferred into LoRRca automized meas-
uring vessel. Measurements are taken through a range of shear stresses (Pa) up to a maximum of 60 Pa. Cell
deformation is expressed as an elongation index calculated by Eq. (4), where A represents the major axis and
B the minor axis in deformation. Elongation Index (EI) values are plotted versus shear stress (Pa) to obtain the
deformability curve.
A−B
EI = (4)
A+B
SCD patient blood analysis and characterization. Complete blood counts were run on a Sysmex 9100
XN automated machine. The phlebotomy team collected whole blood (~ 3 mL) into an EDTA lavender top tube
(BD). The sample was then sent to the hematology lab at Michigan Medicine and run according to university
protocol and manufacturer’s instructions. Results were verified and reported through the electronic medical
records at the University of Michigan. Hemoglobin evaluation was run on a Bio-Rad Variant II cation exchange
HPLC system by high-pressure liquid chromatography (HPLC). Whole blood (~ 3 mL) was similarly collected
by the phlebotomy team in an EDTA lavender top tube and run per protocol. HPLC works by separating com-
ponents of blood through interactions with the absorbent particles. Reports typically consist of five different
hemoglobin genotypes, including Hgb S, Hgb A1, Hgb A2, Hgb C, and Hgb F.
Received: 29 May 2020; Accepted: 11 March 2021
References
1. Rees, D. C., Williams, T. N. & Gladwin, M. T. Sickle-cell disease. Lancet 376, 2018–2031 (2010).
2. Piel, F. B., Hay, S. I., Gupta, S., Weatherall, D. J. & Williams, T. N. Global Burden of Sickle Cell Anaemia in Children under Five,
2010–2050: Modelling Based on Demographics, Excess Mortality, and Interventions. PLoS Med. 10, (2013).
3. Piel, F. B., Steinberg, M. H. & Rees, D. C. Sickle cell disease. N. Engl. J. Med. 376, 1561–1573 (2017).
4. Basak, S., Ferrone, F. A. & Wang, J. T. Kinetics of domain formation by sickle hemoglobin polymers. Biophys. J. 54, 829–843 (1988).
5. Mohandas, N. & Chasis, J. A. Red blood cell deformability, membrane material properties and shape: regulation by transmembrane,
skeletal and cytosolic proteins and lipids. Semin. Hematol. 30, 171–192 (1993).
6. Booth, C., Inusa, B. & Obaro, S. K. Infection in sickle cell disease: a review. Int. J. Infect. Dis. 14, e2–e12 (2010).
7. Brousse, V., Buffet, P. & Rees, D. The spleen and sickle cell disease: the sick(led) spleen. Br. J. Haematol. 166, 165–176 (2014).
8. Sachdev, V. et al. Diastolic dysfunction is an independent risk factor for death in patients with sickle cell disease. J. Am. Coll.
Cardiol. 49, 472–479 (2007).
Scientific Reports | (2021) 11:7909 | https://doi.org/10.1038/s41598-021-86582-8 8
Vol:.(1234567890)www.nature.com/scientificreports/
9. Zhang, D., Xu, C., Manwani, D. & Frenette, P. S. Neutrophils, platelets, and inflammatory pathways at the nexus of sickle cell disease
pathophysiology. Blood 127, 801–809 (2016).
10. Yamaguchi, S., Yamakawa, T. & Niimi, H. Cell-free plasma layer in cerebral microvessels. Biorheology 29, 251–260 (1992).
11. Schreier, D. A., Forouzan, O., Hacker, T. A., Sheehan, J. & Chesler, N. Increased red blood cell stiffness increases pulmonary vascular
resistance and pulmonary arterial pressure. J. Biomech. Eng. 138, 021012 (2016).
12. Ohene-Frempong, K. et al. Cerebrovascular accidents in sickle cell disease: rates and risk factors. Blood 91, 288–294 (1998).
13. McCavit, T. L. Sickle cell disease. Pediatr. Rev. 33, 195–204 (2012).
14. Gutierrez, M., Fish, M. B., Golinski, A. W. & Eniola-Adefeso, O. Presence of rigid red blood cells in blood flow interfere with the
vascular wall adhesion of leukocytes. Langmuir https://doi.org/10.1021/acs.langmuir.7b03890 (2018).
15. Gutierrez, M., Ojeda, L. S. & Eniola-Adefeso, O. Vascular-targeted particle binding efficacy in the presence of rigid red blood cells:
Implications for performance in diseased blood. Biomicrofluidics 12, 042217 (2018).
16. Aarts, P., Heethaar, R. & Sixma, J. Red blood cell deformability influences platelets–vessel wall interaction in flowing blood. Blood
64, 1228–1233 (1984).
17. Adam, M., Ardinger, H., Pagon, R. & Al, E. Sickle Cell Disease - GeneReviews® - NCBI Bookshelf. (2017).
18. Kim, J., Lee, H. & Shin, S. Advances in the measurement of red blood cell deformability: a brief review. J. Cell. Biotechnol. 1, 63–79
(2015).
19. Bento, D. et al. Deformation of red blood cells, air bubbles, and droplets in microfluidic devices: flow visualizations and measure-
ments. Micromachines 9, 151 (2018).
20. Tomaiuolo, G. et al. A methodology to study the deformability of red blood cells flowing in microcapillaries in vitro. Ann. Ist.
Super. Sanita 43, 186–192 (2007).
21. Lim, H., Back, S. M., Nam, J. & Choi, H. Determination of red blood cell deformability using centrifugal force in a three-dimen-
sional-printed mini-disk (3D-PMD). PLoS One 13, (2018).
22. Llaudet-Planas, E. et al. Osmotic gradient ektacytometry: a valuable screening test for hereditary spherocytosis and other red
blood cell membrane disorders. Int. J. Lab. Hematol. 40, 94–102 (2018).
23. Parrow, N. L. et al. Measuring Deformability and Red Cell Heterogeneity in Blood by Ektacytometry. J. Vis. Exp. https://doi.org/
10.3791/56910 (2018).
24. Groner, W., Mohandas, N. & Bessis, M. New optical technique for measuring erythrocyte deformability with the ektacytometer.
Clin. Chem. 26, (1980).
25. Bessis, M., Mohandas, N. & Feo, C. Automated ektacytometry: a new method of measuring red cell deformability and red cell
indices. Blood Cells 6, 315–327 (1980).
26. Rab, M. A. E. et al. Rapid and reproducible characterization of sickling during automated deoxygenation in sickle cell disease
patients. Am. J. Hematol. 94, 575–584 (2019).
27. Ballas, S. & Smith, E. Red blood cell changes during the evolution of the sickle cell painful crisis. Blood 79, (1992).
28. Ballas, S. et al. Rheologic predictors of the severity of the painful sickle cell crisis. Blood 72, (1988).
29. Nikitin, S. Y. et al. New diffractometric equations and data processing algorithm for laser ektacytometry of red blood cells. J. Quant.
Spectrosc. Radiat. Transf. 178, 315–324 (2016).
30. Baskurt, O. K. & Meiselman, H. J. Data reduction methods for ektacytometry in clinical hemorheology. Clin. Hemorheol. Microcirc.
54, 99–107 (2013).
31. Caprari, P. et al. Junctional sites of erythrocyte skeletal proteins are specific targets of tert-butylhydroperoxide oxidative damage.
Chem. Biol. Interact. 94, 243–258 (1995).
32. Baskurt, O. K. et al. Parameterization of red blood cell elongation index—shear stress curves obtained by ektacytometry. Scand.
J. Clin. Lab. Invest. 69, 777–788 (2009).
33. Qiu, Y. et al. Microvasculature-on-a-chip for the long-term study of endothelial barrier dysfunction and microvascular obstruction
in disease. Nat. Biomed. Eng. 2, 453–463 (2018).
34. Mannino, R. et al. Increased erythrocyte rigidity is sufficient to cause endothelial dysfunction in sickle cell disease. Blood 120,
818–818 (2012).
35. Segal, J. B. et al. Hydroxyurea for the treatment of sickle cell disease. Evidence Rep. Technol. Assess. https://doi.org/10.1056/NEJMc
t0708272 (2008).
36. Lemonne, N. et al. Hydroxyurea treatment does not increase blood viscosity and improves red blood cell rheology in sickle cell
anemia. Haematologica 100, e383–e386 (2015).
37. Buchanan, G. R. ‘Packaging’ of fetal hemoglobin in sickle cell Anemia. Blood 123, 464–465 (2014).
38. Saraf, S. L. et al. Differences in the clinical and genotypic presentation of sickle cell disease around the world. Paediatr. Respir. Rev.
15, 4–12 (2014).
39. Saiki, R. et al. Enzymatic amplification of beta-globin genomic sequences and restriction site analysis for diagnosis of sickle cell
anemia. Science 230, 1350–1354 (1985).
40. McCurdy, P. R. & Sherman, A. S. Irreversibly sickled cells and red cell survival in sickle cell anemia. A study with Both DF32P and
51CR. Am. J. Med. 64, 253–258 (1978).
41. Bertles, J. F. & Milner, P. F. Irreversibly sickled erythrocytes: a consequence of the heterogeneous distribution of hemoglobin types
in sickle-cell anemia. J. Clin. Invest. 47, 1731–1741 (1968).
42. Rabai, M. et al. Deformability analysis of sickle blood using ektacytometry. Biorheology 51, 159–170 (2014).
43. Hilliard, L. M. et al. Red blood cell transfusion therapy for sickle cell patients with frequent painful events. Pediatr. Blood Cancer
65, e27423 (2018).
44. DeBaun, M. R. et al. Controlled trial of transfusions for silent cerebral infarcts in sickle cell anemia. N. Engl. J. Med. 371, 699–710
(2014).
45. Czaja, B. et al. The influence of red blood cell deformability on hematocrit profiles and platelet margination. PLOS Comput. Biol.
16, e1007716 (2020).
Acknowledgements
This work was supported by an NSF Research Grant (CBET1854726) to O.E-A., and M.G. was supported by the
National Science Foundation Graduate Research Fellowship. The authors would like to thank for minor technical
assistance and useful conversations C. Cilliers. The authors thankfully acknowledge the patients and families for
their participation in this research study.
Author contributions
M.G. and O.E-A conceived and designed the experimental protocols. M.G. prepared all blood samples for ekta-
cytometry measurement, analyzed all the collected data, and built the MATLAB algorithm. M.G., M.S., and O.
E-A wrote the manuscript. M.S. interacted with all patients as a clinician, including reading consents to donate
and blood collection and provided valuable clinical insight. K.G.S. performed all ektacytometry measurements.
Scientific Reports | (2021) 11:7909 | https://doi.org/10.1038/s41598-021-86582-8 9
Vol.:(0123456789)www.nature.com/scientificreports/
T.T. assisted with the preparation of the samples and conducted experiments. T.K. provided valuable clinical
insight into the ektacytometry results and development of this manuscript.
Competing interests
The authors declare no competing interests.
Additional information
Supplementary Information The online version contains supplementary material available at https://doi.org/
10.1038/s41598-021-86582-8.
Correspondence and requests for materials should be addressed to O.E.-A.
Reprints and permissions information is available at www.nature.com/reprints.
Publisher’s note Springer Nature remains neutral with regard to jurisdictional claims in published maps and
institutional affiliations.
Open Access This article is licensed under a Creative Commons Attribution 4.0 International
License, which permits use, sharing, adaptation, distribution and reproduction in any medium or
format, as long as you give appropriate credit to the original author(s) and the source, provide a link to the
Creative Commons licence, and indicate if changes were made. The images or other third party material in this
article are included in the article’s Creative Commons licence, unless indicated otherwise in a credit line to the
material. If material is not included in the article’s Creative Commons licence and your intended use is not
permitted by statutory regulation or exceeds the permitted use, you will need to obtain permission directly from
the copyright holder. To view a copy of this licence, visit http://creativecommons.org/licenses/by/4.0/.
© The Author(s) 2021
Scientific Reports | (2021) 11:7909 | https://doi.org/10.1038/s41598-021-86582-8 10
Vol:.(1234567890)You can also read