EFFECT OF LANDSCAPE FEATURES AND FRAGMENTATION ON WILD TURKEY DISPERSAL
←
→
Page content transcription
If your browser does not render page correctly, please read the page content below
EFFECT OF
                                          LANDSCAPE FEATURES
                                          AND FRAGMENTATION
                                          ON WILD TURKEY
                                          DISPERSAL

             Kathleen K. Fleming1,2                                                   William F. Porter
     Faculty of Environmental and Forest Biology,                          Faculty of Environmental and Forest Biology,
             State University of New York,                                         State University of New York,
    College of Environmental Science and Forestry,                        College of Environmental Science and Forestry,
      1 Forestry Drive, Syracuse, NY 13210, USA                             1 Forestry Drive, Syracuse, NY 13210, USA

Abstract: Wild turkeys (Meleagris gallopavo silvestris) are now found in almost every county of New York
State. Population recovery has probably been facilitated by the ability of individuals to disperse into unoccupied
habitat. We investigated the effect of landscape patterns and barriers to movement on wild turkey dispersal in
New York to determine if these landscape characteristics may have affected the statewide pattern of wild turkey
population recovery. First, we simulated the effect of landscape features and landscape fragmentation (measured
by edge/area) on dispersal patterns in a wild turkey population in New York State using land-cover data derived
from satellite imagery. We used cost–distance analysis in ArcView, a method that involves calculating least
costly dispersal paths through a landscape, to determine the average least cost incurred by wild turkeys dispersing
through landscapes along a gradient of fragmentation. We compared this cost to the edge density in each
landscape. Average cost incurred was negatively correlated with edge/area (r ⫽ ⫺0.80, P ⬍ 0.001). Second,
we simulated the expansion of the wild turkey population in New York from wild birds released at sites
throughout the state and birds crossing northward from Pennsylvania, and compared it visually to the spatial
pattern of expansion of the fall wild turkey harvest in New York from 1982 to 2000. The analysis predicted a
similar visual pattern of population expansion as the fall harvest. As managers seek to fill remaining vacant
habitat, they should be aware of the extent to which landscape features may inhibit or facilitate dispersal of
individuals from release sites.
                                                Proceedings of the National Wild Turkey Symposium 9:175–183
Key words: agriculture, dispersal, edge, fragmentation, habitat, landscape, Meleagris gallopavo silvestris, move-
ment, New York, population, wild turkey.

     Wild turkey populations have been restored to al-            and Eisfelder 1990). Because turkeys disperse by
most all states in the U.S. (Tapley et al. 2001). The             walking, rather than flying, connectivity can be influ-
success of population recovery efforts in most cases              enced by features of the landscape that act to facilitate
has been attained through trap and transfer of wild               or hinder movement (Backs and Eisfelder 1990, Gus-
birds into unoccupied habitat. This success has been              tafson et al. 1994). Several studies have documented
facilitated by the natural dispersal behavior of juvenile         preferential use of edge habitats during dispersal or
wild turkeys as well as seasonal movements of adult               other seasonal movements, especially forest/field edg-
birds from winter to spring range (Eaton et al. 1976).            es (Raybourne 1968, Eichholz and Marchinton 1975,
In many translocation programs, population restoration            Porter 1978). Connectivity of these preferred habitat
has been dependent upon a relatively small number of              types is needed for dispersal (Eaton 1992, Gustafson
released birds being able to colonize and reproduce in
large expanses of new habitat. Adverse genetic effects                1E-mail: KathyFleming@fws.gov
may occur in the restored population if connectivity                  2US Fish and Wildlife Service, Division of Migratory Bird
with other populations is not maintained, especially if           Management, 11510 American Holly Drive, Laurel, MD 20708,
the founder birds originate from the same flock (Backs            USA.

                                                            175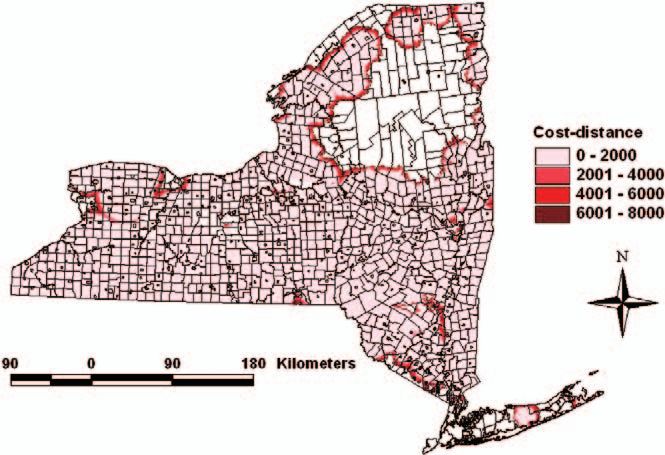
176            Habitat Ecology of Wild Turkeys

et al. 1994, Peoples et al. 1996). Most of these features
are a by-product of landscape fragmentation.
     Fragmented landscapes contain abundant edge
habitat which should facilitate movement of turkeys.
However, wild turkeys tend to avoid roads, developed
areas, and the centers of large fields, presumably due
to the perceived cost or risk of traversing or foraging
in these habitats (Eichholz and Marchinton 1975,
McDougal et al. 1990). Landscapes dominated by ex-
tensive agriculture, roads, and high-intensity develop-
ment might hinder dispersal or be avoided altogether.
     We used a spatially explicit cost-distance analysis
to predict how landscape features associated with frag-
mentation, such as roads, edges, and the spatial ar-
rangement of land-cover types, might influence broad-         Fig. 1. Edge density (m/ha) within 7,850-ha hexagon land-
                                                              scapes measured from the National Land Cover Data Set (EPA/
scale dispersal patterns of wild turkeys across New           MRLC) for New York State, 1992.
York. Wildlife researchers have utilized cost-distance
analysis to identify wildlife movement corridors and
to investigate effects of habitat fragmentation (e.g.,
Verbeylen et al. 2003, Wikramanayake et al. 2004).            latitudes (Reschke 1990). Approximately 62% of New
This method is suitable for use in analyzing costs as-        York State was forested (Alerich and Drake 1995).
sociated with movement paths across a landscape rep-          Nonforested areas were primarily active or abandoned
resented by a raster land-cover data set (i.e., pixel rath-   agriculture, or else 1 of 21 natural nonforested upland
er than polygon data). Using cost-distance analysis, we       communities (Reschke 1990).
addressed the following objectives: (1) determine the
relationship between landscape fragmentation and cost
of dispersal, (2) predict the broad-scale pattern of pop-                          METHODS
ulation expansion in New York following releases and               We used the land-cover map of New York State
movement of birds from northern Pennsylvania, based           produced as part of the National Land Cover Data Set
on known habitat use and avoidance behavior, (3)              (NLCD) by the Environmental Protection Agency
compare the predicted pattern of population expansion         (EPA)/Multi-Resolution Land Characteristics Consor-
with the history of population growth in the state, in-       tium (MRLC). The NLCD was derived from satellite
dexed by wild turkey fall harvest data.                       imagery acquired in 1988–1993 and has 30-m reso-
                                                              lution and 15 cover classes: water, low- and high-in-
                                                              tensity residential, commercial/industrial/transporta-
                  STUDY AREA                                  tion, hay/pasture, row crops, urban/recreational grasses
                                                              (e.g., golf courses, airports, soccer fields), conifer for-
     The study area was the state of New York:                est, mixed conifer/deciduous forest, deciduous forest,
126,000 km2 partitioned into 11 major ecozones. The           forested wetland, nonforested wetland, quarry/strip
Appalachian plateau in southwest New York (43,430             mine, sand beach, and barren or transitional (i.e., clear-
km2) is characterized by broad hills (elevation approx-       cuts, plowed soil). To reduce processing time, we re-
imately 600 m) and steep valleys, with agriculture (pri-      duced the resolution of the original NLCD from 30-m
marily dairy farms, vineyards) concentrated in lowland        to 90-m pixel size using a nearest-neighbor resampling
areas (Dickinson 1983). The Great Lakes Plain in              technique in ArcView. Although resampling tends to
northwest New York (15,930 km2) is a low-elevation            remove small (i.e., ⬍90 m wide) habitat patches in the
(mostly ⬍250 m), low-relief plain created by glacia-          land-cover data, in some cases it may also increase the
tion, with extensive agriculture (vegetables, grains, and     accuracy of the land-cover data when these small
fruits). The ecozones of eastern New York are defined         patches are an artifact of the classification process
primarily by mountains (Adirondacks, Catskills) or            (Fleming et al. 2004).
valleys (Mohawk River, Hudson River, and Lake
Champlain), and vary widely with respect to environ-
                                                              Effect of Landscape Fragmentation on Dispersal
ment and land use. River valleys were predominantly
                                                              Cost
agricultural, while both Adirondacks and Catskills re-
gions were primarily forested. Widespread upland for-             All analyses using the NLCD were conducted in
est communities included Appalachian oak–hickory              ArcView (Version 3.2, Environmental Systems Re-
forest (Quercus spp., Carya spp.), which ranged               search Institute [ESRI], Redlands, California, USA).
throughout New York south of the Adirondacks and              We subdivided the state into experimental landscape
north of Long Island; beech–maple mesic forest (Fa-           units by overlaying a hexagonal grid created using the
gus grandifolia, Acer spp.), throughout New York; and         Patch Analyst extension for ArcView (Rempel and
mixed northern hardwood forest, with hemlock (Tsuga           Carr 2003) on the NLCD, with area of each hexagon
canadensis), white pine (Pinus strobus), or spruce (Pi-       7,850 ha (roughly equivalent to a circle with radius 5
cea spp.) associations, located at higher elevations or       km; Figure 1). This size resulted in relatively homo-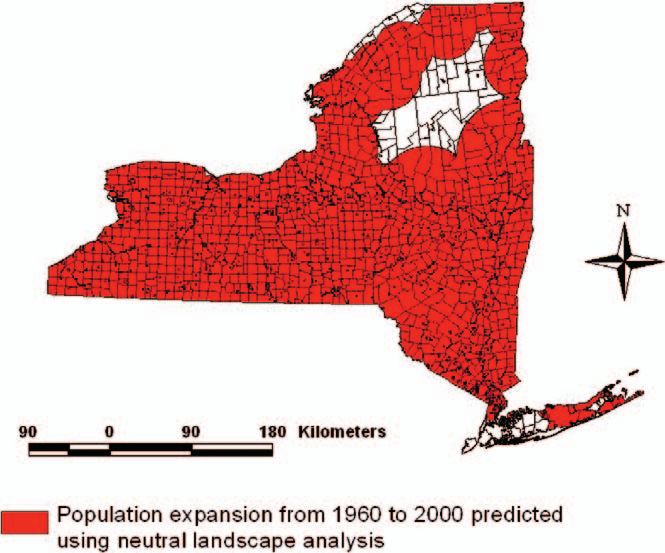
Landscape Effects on Dispersal • Fleming and Porter                177

                                                                                         cdl ⫽ min   冘cd
                                                                                                     i⫽j
                                                                                                           i   i

                                                                     where ci is the cost of pixel i, di is the distance traveled
                                                                     through pixel i (90 m for horizontal and vertical move-
                                                                     ments, 127.2 m for diagonal movements), and j is the
                                                                     total number of pixels in the path going from the
                                                                     source to that point in the landscape. For each desti-
                                                                     nation pixel, the accumulated cost-distance along ev-
                                                                     ery possible path of travel through the landscape is
                                                                     calculated, starting from the source pixel and ending
                                                                     at the destination pixel (Figure 2). After this iterative
                                                                     process is completed for all possible paths, the path
                                                                     with the lowest accumulated cost-distance value is
Fig. 2. Example of cost paths calculated using cost-distance         chosen, and this value is assigned to the destination
analysis. A and B represent 2 possible paths from a source pixel     pixel.
(S) to a destination pixel (D) in a landscape where pixels are            We used a 2-step process to evaluate average cost–
assigned costs ranging from 1 (low cost) to 10 (high cost). The      distance for each hexagon. First, we created a cost
accumulated cost–distance of moving along each path is cal-          landscape where we identified barriers to movement
culated as the summation, over all pixels in the path, of the cost
of each pixel multiplied by the distance moved through the pixel
                                                                     and costs associated with each land-cover type. Sec-
(90 m for a horizontal or vertical movement, 127.2 m for diagonal    ond, using Spatial Analyst in ArcView we analyzed
movement). Thus, for Path A, the accumulated cost–distance is        the accumulated least cost-distance of moving through
(1 ⫻ 90) ⫹ (1 ⫻ 90) ⫹ (1 ⫻ 90) ⫹ (1 ⫻ 90) ⫹ (1 ⫻ 90) ⫹ (1            this landscape.
⫻ 90) ⫹ (1 ⫻ 90) ⫹ (5 ⫻ 90) ⫹ (1 ⫻ 90) ⫽ 1170; and for Path               We created the cost landscape based on informa-
B, the accumulated cost–distance is (10 ⫻ 127.2) ⫹ (10 ⫻             tion on wild turkey habitat use and dispersal behavior
127.2) ⫹ (5 ⫻ 127.2) ⫹ (5 ⫻ 127.2) ⫽ 3816. The analysis cal-
                                                                     reported in the literature. We labeled each land-cover
culates accumulated cost–distance for all possible paths from S
to D, and assigns the lowest accumulated cost–distance of all        type as a barrier to movement (was not crossed), or as
these paths to the pixel D. This process is repeated for all non-    low (cost ⫽ 1), moderate (cost ⫽ 5), or high cost (cost
source pixels in the landscape, which results in the creation of     ⫽ 10). For wild turkeys, the cost of traveling through
a cost–distance grid.                                                a specific habitat type can be broken down into 2 com-
                                                                     ponents: the risk of predation and the benefit provided
                                                                     by food resources. Some habitats are avoided com-
                                                                     pletely: wild turkeys are reluctant to cross agricultural
geneous configuration (i.e., degree of fragmentation)
                                                                     fields 150–200 m wide (Eichholz and Marchinton
within landscapes.
                                                                     1975), large clearcuts (Raybourne 1968), and busy
     We measured 2 characteristics of each hexagonal
                                                                     roads, especially when flanked by open areas (Mc-
landscape. First, we measured edge density by tabu-
                                                                     Dougal et al. 1990). These features may act as barriers
lating the total number of edge pixels (pixels that were             to dispersal. Female turkeys prefer streamside zones
adjacent to at least one different pixel type) and divid-            for travel (Palmer and Hurst 1995), smaller rather than
ing by the total land area in the landscape (not includ-             larger forest patches (Wigley et al. 1985), and forested
ing area of the landscape covered by water). Although                areas with open understories located near escape cover
many other types of edges were present, we were pri-                 (Sisson et al. 1990).
marily interested in edges within wild turkey habitat,                    Dispersing turkeys may avoid human development
so we did not include edges of developed land, water,                and intensively farmed areas (Backs and Eisfelder
or barren/transitional land. However, if developed land              1990). We labeled areas without sufficient cover (bare
was adjacent to turkey habitat (e.g., forest, agricul-               rock, quarries, and transitional areas such as plowed
ture), those habitat pixels at the forest or agriculture             fields), high-intensity residential areas, and conifer for-
edge would be included as edge pixels. We calculated                 est interior as high cost. We labeled low-intensity res-
the amount of linear edge by multiplying the number                  idential, urban/recreational grasses, woody wetlands,
of edge pixels within each hexagon by their width (90                and deciduous and mixed forest interiors (⬎120 m
m).                                                                  from edge) as moderate cost, and all forest and agri-
     Second, we measured the average dispersal cost in               culture edges (land cover ⬍120 m from edge) as low
each hexagonal landscape using a cost-distance anal-                 cost. Based on the common perception that wild tur-
ysis (Cost-distance Grid Tools extension for Spatial                 keys disperse by walking rather than flying, we as-
Analyst 1.1, ESRI, Redlands, California, USA). This                  sumed that turkeys would walk around water or emer-
type of spatial analysis measures the accumulated cost-              gent herbaceous wetlands, and would avoid crossing
distance of moving along a path within a landscape                   the interior of agricultural fields (Eichholz and Mar-
from a source pixel to a destination pixel, taking into              chinton 1975) or busy roads (McDougal et al. 1990).
account both the distance traveled and the relative cost             Therefore, we labeled these cover types (major high-
incurred in each cover type traversed along the path                 ways were included in the commercial/industrial/trans-
(Figure 2). The analysis uses an iterative process to                portation class) as barriers.
evaluate the path with the least accumulated cost-                        To calculate average least accumulated cost-
distance, cdl:                                                       distance in each hexagon, we arbitrarily designated the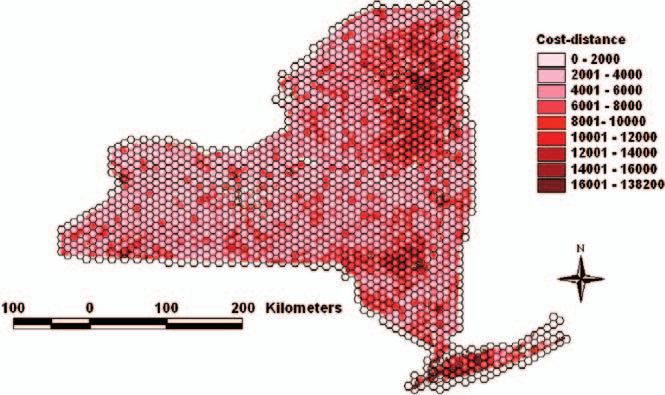
178              Habitat Ecology of Wild Turkeys

                                                                    tance to represent the limit of expansion during that
                                                                    5-year period. We assumed that range expansion
                                                                    would occur at a rate similar to that estimated for pop-
                                                                    ulations in Pennsylvania, approximately 8 km/year
                                                                    (Healy 1992). However, to allow comparison with the
                                                                    pattern of abundance indexed by harvest effort data,
                                                                    we added a 5-year time lag to that estimate to account
                                                                    for population growth to huntable levels following ex-
                                                                    pansion into new habitat. This resulted in an estimate
                                                                    of population expansion of 8 km for each 5-year pe-
                                                                    riod. For each successive 5-year analysis, we used the
                                                                    area of expansion predicted by the previous cost-dis-
                                                                    tance analysis as the source, as well as any sites where
                                                                    releases had occurred in that 5-year period.

                                                                    Comparison of Predicted Population Expansion
Fig. 3. Locations and years when wild turkeys were released         with Harvest Index
in New York from 1960 to 2000. Points represent geographic
centroids of townships or state wildlife management areas                We considered 2 characteristics of the fall harvest
where releases occurred, not the actual location of the releases.   data which could be used to reflect the expansion of
For the cost-distance analysis we assumed that the present pop-     the wild turkey population in New York: the pattern
ulation of wild turkeys in New York descended from birds re-        of increase in the number of townships in the state
leased at these sites and wild birds dispersing northward from
Pennsylvania in (from left to right, outlines shown in blue) Cat-
                                                                    with a fall harvest, and the average effort expended in
taraugus, Allegany, and Steuben counties.                           those townships during the fall harvest season. As
                                                                    population expansion occurred in a township, we as-
                                                                    sumed that, first, a perceived threshold in population
center pixel of each hexagon as the source, and eval-               density was reached when a fall harvest season was
uated least accumulated cost–distance from the source               added, and second, as the population density continued
to all other pixels in the landscape. We took the av-               to increase the average effort expended by hunters to
erage of all pixels’ values in the hexagon to represent             find a turkey would decrease. We created maps show-
the cost associated with dispersal in that landscape.               ing the pattern of increase in fall harvest seasons by
    We used PROC CORR in SAS (SAS Institute                         township and an abundance index based on hunter ef-
1990) to estimate correlation between edge density and              fort (time-to-first-kill) derived from fall harvest data
average accumulated dispersal cost in each hexagonal                collected by the New York Department of Environ-
landscape with the Pearson product–moment correla-                  mental Conservation from 1982 to 2001 (Porter and
tion coefficient (Zar 1984).                                        Gefell 1996, Glennon and Porter 1999). This index
                                                                    was calculated as the reciprocal of the average number
Simulation of Population Expansion                                  of days taken by hunters in each township to find and
                                                                    kill a wild turkey during the fall season (in townships
     We used a similar cost-distance analysis to simu-              with a 2-bird bag limit we used only the first kill effort
late the pattern of population expansion following wild             to avoid incorporating errors by hunters incorrectly re-
turkey releases and the spread of wild birds northward              porting total effort for the second kill). We calculated
from northern Pennsylvania into New York. For this                  5-year averages of the abundance index (except for the
analysis, we used information on trap and transfer lo-              first, 3-year interval from 1982 to 1995) for the fol-
cations where wild turkeys were released in New York                lowing intervals: 1986–1990, 1990–1995, and 1995–
from 1960 to 1994 (R. Sanford, New York State De-                   2000. During this overall time period, the number of
partment of Environmental Conservation, unpublished                 townships in the state with a fall harvest greatly in-
data). We conducted 7 successive cost-distance anal-                creased; therefore, most townships in the state were
yses representing population expansion during each 5-               not represented in the earlier year intervals. We as-
year period from 1960 to 1995. For the first analysis               sumed that turkey population densities were lower in
(1960–1965) we assumed all sites where turkeys were                 these townships than any township with a fall harvest.
released within this time period, as well as the New                We displayed average index values on maps to visually
York–Pennsylvania state line in Steuben, Allegany,                  compare with the pattern of expansion predicted by
and Cattaraugus counties in western New York, to be                 our cost-distance analyses.
source locations for dispersing turkeys (Figure 3). Be-                  Lastly, to test the assumption that the pattern pre-
cause information on release locations was limited to               dicted by the cost-distance analysis reflected turkey
town name or wildlife management area, we used the                  use and avoidance of landscape features such as edge
geographic centroids of these areas as the location of              density, rather than just the limited distance turkeys
the sources. The accumulated least cost was calculated              can travel, we ran the same cost-distance analyses us-
from sources to all other pixels in the state using the             ing a neutral landscape where all pixels regardless of
cost landscape created by the process described pre-                their land cover type were assigned cost ⫽ 1. This
viously.                                                            analysis took only distance into account when deter-
     For each analysis we used a threshold of cost-dis-             mining the limit to population expansion. We visually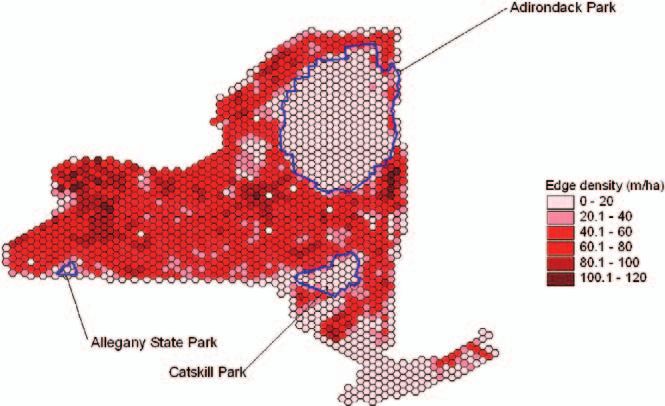
Landscape Effects on Dispersal • Fleming and Porter 179
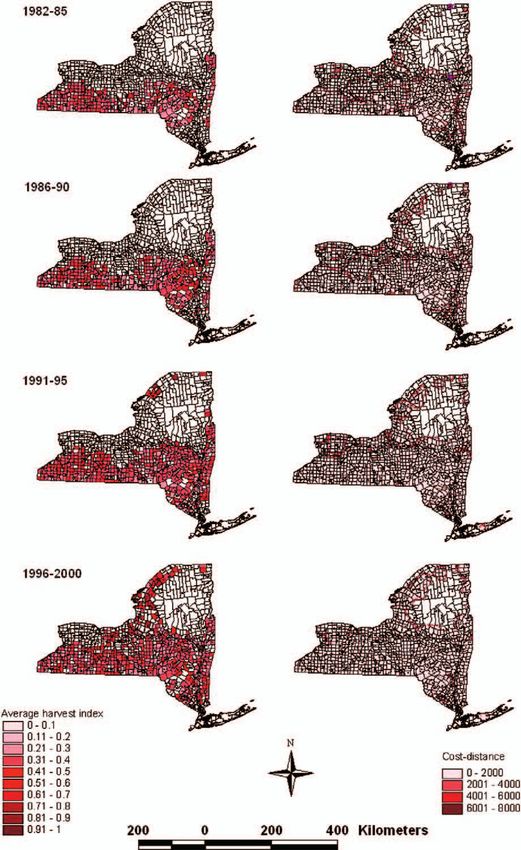
Fig. 4. Dispersal cost-distance within 7,850-ha hexagon land-
scapes calculated using a cost-distance analysis in ArcView
from the National Land Cover Data Set (EPA/MRLC) for New Fig. 5. Predicted expansion of wild turkey population in New
York State, 1992. York from 1960 to 2000 based on cost-distance analyses.
Source locations for wild turkeys were sites where wild birds
compared the predicted pattern of expansion using the were released and the Pennsylvania–New York state line in Cat-
taraugus, Allegany, and Steuben counties (see Fig. 3).
neutral landscape to that predicted using the cost land-
scape, and also to the pattern of the harvest index in
townships with a fall turkey harvest. (roads, urban land, large agricultural fields, water) or
high-cost land-cover types (e.g., high-intensity resi-
RESULTS dential land).
Effect of Landscape Fragmentation on Dispersal Comparison with Harvest Abundance Index
Cost
The number of townships in New York with a fall
Average edge density was 42 m/ha (range 0–119 wild turkey season increased from 362 to 759 in 1982–
m/ha) within hexagonal landscapes (Figure 1). Highest 2000. Townships without a fall harvest season in 2000
edge density was found south of Lake Ontario and the were located primarily in the western Great Lakes
region east of Buffalo, in the state’s most intensively Plain, southern and eastern Adirondacks, central Cat-
farmed landscapes. Lowest edge density occurred in skills, between Seneca and Cayuga Lakes in the Finger
the Adirondack, Catskill, and Allegany Parks, and in Lakes region, Long Island, and the New York City
the Tug Hill region west of the Adirondack Park (Fig- metropolitan area. The pattern of increase in fall har-
ure 1). vest seasons was similar to the pattern of population
Cost was distributed unevenly across the land-cov- expansion predicted by the cost-distance analysis,
er data (Figure 4). Highest cost pixels were concen- which showed high cost or a lack of expansion into
trated in areas with relatively large tracts of conifer most of these areas (Figure 6). However, some differ-
and deciduous forest (Adirondack and Catskill Moun- ences did exist. Most of the townships at the north-
tains) and metropolitan areas. Most (41%) of the pixels western edge of the Adirondack Park had a fall season
were classified as low cost; 27% were moderate cost, by 2000 although the cost-distance analysis predicted
3% were high cost, and 29% were classified as barri- limited expansion into most of these townships. We
ers. Average accumulated cost–distance of all pixels did not detect a strong spatial pattern in the average
in each landscape ranged from 720 m to 48,176 m, harvest index although average harvest effort tended
with average of all landscapes 6,890 m (Figure 4). to be lower in townships along the edge of the ex-
Average cost–distance was highly negatively correlat- panding population (those that had more recently add-
ed with edge density in hexagons (r ⫽ ⫺0.80, P ⬍ ed a fall harvest) than those where presumably the
0.001). turkey population had already become established.
The result of the cost-distance analysis using the
Predicted Dispersal Pattern
neutral landscape was a pattern similar to that using
The pattern of dispersal predicted by our cost-dis- the cost landscape, with some notable exceptions (Fig-
tance analysis showed some regions of the state with- ure 7). The original cost-distance analysis predicted
out established populations up to the year 2000 (Figure that the area in the Finger Lakes region between Sen-
5). These areas included most of the Adirondack Park, eca and Cayuga lakes would not have an established
the agricultural area north of the Adirondack Park and wild turkey population by 2000, but this area was eas-
south of the U.S.–Canadian border, the central region ily reached by dispersers when water and large agri-
of the Catskills, the intensively farmed area in the Fin- cultural fields were assigned equal cost as other land-
ger Lakes region between Cayuga and Seneca lakes, scape features. Also, the neutral cost-distance analysis
and areas surrounding the major urban centers (e.g., did not predict any hindrance to population expansion
Buffalo, Rochester, Syracuse, Binghamton, and Utica). into suburban and urban areas in western New York,
These areas contain many barriers to movement unlike the original cost-distance analysis.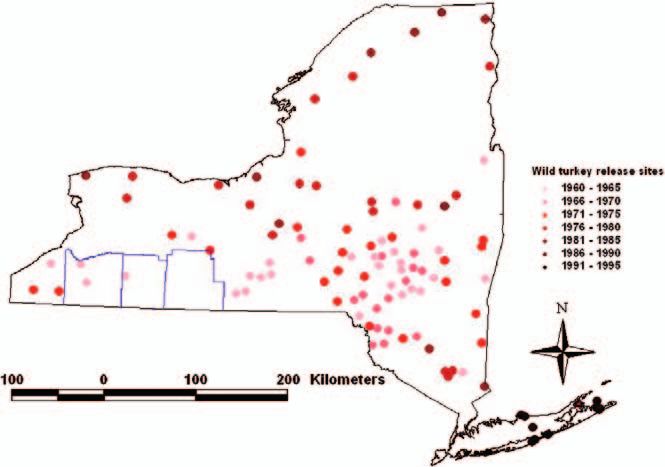
180              Habitat Ecology of Wild Turkeys

Fig. 6. Comparison of average time-to-first-kill harvest index and increase in number of townships with a fall harvest in New York
(on left) to pattern of wild turkey population expansion predicted by cost-distance analyses (on right), 1980–2000. Filled townships on
left represent those with a fall harvest; color of township represents value of average harvest index for that township (see legend on
left). Cost-distance values represent the expansion of the wild turkey population away from release sites in New York during each 3-
year (1982–1985) or 5-year time interval when releases took place.

                    DISCUSSION                                        cost and edge density resulted from the preference by
                                                                      turkeys for edge habitat during dispersal. Edge density
    Our cost-distance analysis predicted that frag-                   represents the increasing interspersion of agriculture
mented landscapes facilitate dispersal of wild turkeys                into forested areas. Even areas of intensive agriculture
in New York, despite the presence of roads and other                  in New York, such as the Great Lakes Plain south of
barriers. The negative correlation between dispersal                  Lake Ontario or the Finger Lakes region in central
Landscape Effects on Dispersal • Fleming and Porter 181
white pine forest was thought to limit historic wild
turkey distributions in northern Pennsylvania (Hayden
and Wunz 1975). Although the northern hardwood for-
ests of the Adirondacks may contain sufficient mast-
producing species to support turkey populations, deep
snow in most winters probably limits the extent to
which turkeys can make use of this winter food re-
source (Porter 1978).
Comparison of Simulated Expansion with Harvest
Data
Although the predicted pattern of population ex-
pansion in New York closely followed the pattern of
increase in fall harvest seasons, the average effort in-
dex did not show the pattern we anticipated, that of
lower hunting effort in townships with an established
turkey population. Instead, we observed a tendency for
hunting effort to increase in townships after popula-
Fig. 7. Result of cost-distance analysis to predict wild turkey
population expansion in New York using a neutral cost land- tions became established, with lowest effort observed
scape (all land-cover types assigned cost ⫽ 1) from 1960 to in townships that had recently added a fall season. This
2000. Area shown in red represents the expansion of the pop- might be due to the higher productivity observed for
ulation following wild turkey releases that occurred from 1960– turkeys in newly occupied habitat. In New York, the
1995. highest poult:hen ratios observed during the summer
brood surveys have consistently been found in some
parts of the state with the lowest turkey densities, such
New York, probably contain enough forest edge to as the Adirondacks (R. Sanford, New York State De-
provide travel routes for dispersing turkeys. This is in partment of Environmental Conservation, unpublished
contrast to the agricultural Midwest where large field data). Alternatively, the relationship between harvest
size and small forest patches with low connectivity can index and population density could be confounded by
inhibit movement of wild turkeys (Gustafson et al. differences in hunter skill and knowledge of the area
1994). The difference may lie in the broad-scale in- hunted, which might be substantial among townships
terspersion of farmland and public land in New York. with different histories of fall harvest. Although this
Unlike the Midwest, even intensively farmed areas of would not affect the pattern of expansion we predicted,
New York tend to have smaller fields and larger forest it could limit our ability to compare wild turkey den-
patches due to the more rugged topography of the re- sities among townships.
gion. Although barriers and high-cost habitat types ex- Differences between the pattern of expansion pre-
ist, any hindrance to dispersal they represent may only dicted using the cost landscape with that predicted us-
be on a local scale. In our model, dispersal would be ing the neutral landscape were most conspicuous in 2
substantially inhibited at a landscape scale only if a regions: the intensively farmed area within Seneca
much larger proportion of the landscape consisted of County in the Finger Lakes region of central New
barriers (e.g., interiors of large cropfields). York, and urban areas surrounding Buffalo and Roch-
The landscapes of the Adirondacks and Catskills ester in western New York (Figures 4 and 6). The slow
are potentially costly for dispersing turkeys. Forest is expansion into the Finger Lakes region is supported
a necessary component of habitat for turkeys, espe- by fall harvest data; Seneca County lagged behind the
cially during dispersal. However, as forest patches be- rest of central New York in terms of when the fall
come larger and more aggregated, it is likely that the harvest was added (1996) and average harvest index
interior of these areas will be avoided by turkeys if (Figure 6). Wild turkeys are currently found in sub-
they are a greater distance from edge habitat than a urban Buffalo and Rochester; however, they are not
turkey could travel before the onset of breeding sea- commonly associated with the intensively developed
son. Wild turkeys undoubtedly do move through these or industrial sites of these urban centers. While these
landscapes, but are probably restricted to less costly differences do suggest that turkey avoidance or pref-
paths (e.g., bottomland edges, near openings). Their erence for certain habitats during dispersal does play
population distribution in these landscapes may be a role in determining patterns of expansion, there are
patchy, owing to low proximity of suitable reproduc- more similarities between the 2 expansion models than
tive habitat and limited paths of dispersal within it. differences. Both models showed a lack of population
Dispersal, and thus population expansion, may not expansion into the Adirondacks, the northern bound-
only be affected by the local landscape, but also the ary of New York, and New York City, due only to
larger spatial arrangement of these landscapes. In New their distance from release sites. Limited dispersal abil-
York, the forests of the Adirondack Park may hinder ity in wild turkeys is probably the primary factor de-
population expansion at a regional scale, much the termining the pattern of population expansion follow-
same as the large expanse of mature hemlock and ing release; avoidance or selection of specific habitats182 Habitat Ecology of Wild Turkeys
may only play a substantial role when these habitats MANAGEMENT IMPLICATIONS
are aggregated across a large region (such as Adiron-
dack forests or the intensively farmed landscapes of Although wild turkey population recovery in New
western New York). York is considered complete, in many other areas of
One of the challenges of modeling spatial patterns the U.S. wildlife managers are still actively working
of habitat over time is the lack of long-term land-cover to restore wild turkeys or supplement existing popu-
datasets. We used land-cover data from the late 1980s– lations within and outside their historic range. The re-
sults of our cost-distance analysis of wild turkey pop-
early 1990s. Substantial change in the landscapes of
ulation expansion in New York suggest that landscape
New York occurred during the period in which wild
features such as habitat edges and barriers to move-
turkeys were released, including a loss of agricultural
ment can influence large-scale patterns of dispersal.
land and subsequent gain in forest and developed land. Managers may want to consider how landscape fea-
While these changes undoubtedly influenced the dis- tures and habitat types surrounding the release site act
persal of wild turkeys from release sites, it is difficult to inhibit or facilitate dispersal prior to choosing sites
to quantify this effect without a comparable source of for release. The selection of reintroduction sites in
early land-cover data. high-quality habitat is important for ensuring the sur-
Incorporating information on wild turkey use and vival and reproduction of released birds; however, se-
avoidance of certain habitat types into a cost-distance lecting sites in landscapes with high connectivity is
analysis provides insight into how landscape features also important to ensure the persistence and expansion
might influence the spread of a wild turkey population of that population. Abundant literature on habitat use
following reintroduction. However, many other factors and avoidance by wild turkeys, as well as easily ob-
such as breeding habitat, weather, or predator densities tained high-resolution land-cover data, can be utilized
also affect population expansion. For example, in to predict how (and if) population expansion will occur
northern New York, snow depth and duration of winter following the release of wild birds. In the western
severely limit turkeys’ ability to exploit natural food U.S., where genetic effects of population isolation are
sources in the northern hardwood forest (Porter 1977, a concern, cost-distance analysis can be used to iden-
Porter et al. 1980). Wild turkeys have been found in tify habitat corridors that facilitate dispersal and inter-
the central Adirondacks for several years but they are action with other existing populations.
closely associated with human development and the
little agriculture that is found there. Although our cost-
distance model predicted that wild turkey populations ACKNOWLEDGMENTS
would become established in the Great Lakes Plain by This study was generously funded by the New
2000, townships in this intensively farmed region were York Chapter of the National Wild Turkey Federation
among the last in western New York to be open for a and the Wilford A. Dence Fellowship Program at
fall hunting season due to perceived low turkey den- SUNY College of Environmental Science and Forest-
sities. Our recent research in this region suggests that ry. We thank R. Sanford (NYSDEC) for providing data
its abundant edge habitat, which should act to facilitate on turkey releases in New York, M. Hall and J. Gibbs
wild turkey dispersal, may also promote high predator for helpful suggestions on the manuscript, and B. Mi-
densities (Fleming 2003). Ultimately many of the hab- randa and the Quantitative Studies Lab at SUNY Col-
itat factors that influence dispersal probably play a role lege of Environmental Studies and Forestry for tech-
in other aspects of the wild turkey’s life history that nical support and use of computer facilities.
also affect population expansion.
One important caveat to the use of resampled land-
cover data in this analysis is that small openings in the LITERATURE CITED
forest canopy, as well as small forest patches, may not Alerich, C. L., and D. A. Drake. 1995. Forest statistics for New
be well represented, especially if they are ⬍90 m York: 1980 and 1993. U.S. Forest Service Resource Bul-
across. These openings may be very important to wild letin NE-132.
turkeys dispersing through large contiguous forested Backs, S. E., and C. H. Eisfelder. 1990. Criteria and guidelines
for wild turkey release priorities in Indiana. Proceedings of
tracts or agricultural lands, by providing food and cov- the National Wild Turkey Symposium 6:134–143.
er resources that attract birds from the surrounding Dickinson, N. R. 1983. Physiographic zones of southern and
landscape. Similarly, the lack of information in the western New York State. New York State Department of
land-cover data on vegetation characteristics under- Environmental Conservation, Wildlife Resources Center,
neath the forest canopy may also limit its usefulness Delmar, New York, USA.
Eaton, S. W. 1992. Wild turkey. The Birds of North America
in predicting dispersal patterns of wild turkeys. A 22:1–28.
landscape-level analysis may be valuable for identi- , F. M. Evans, J. W. Glidden, and B. D. Penrod. 1976.
fying large-scale landscape features that affect wild Annual range of wild turkeys in southwestern New York.
turkey dispersal, but many other small-scale factors New York Fish and Game Journal 23:21–33.
that we did not consider (e.g., small forest openings, Eichholz, N. F., and R. L. Marchinton. 1975. Dispersal and ad-
justment to habitat of restocked wild turkeys in Georgia.
characteristics of ground cover and shrub layer) may Southeastern Association of Game and Fish Commission-
also be important in shaping dispersal patterns for this ers, Proceedings of Annual Conference 29:373–378.
species. Fleming, K. K. 2003. Scale-explicit spatial determinants of pop-Landscape Effects on Dispersal • Fleming and Porter 183
ulation structure in wild turkeys (Meleagris gallopavo sil- Tapley, J. L., R. K. Abernathy, and J. E. Kennamer. 2001. Status
vestris). Dissertation, State University of New York College and distribution of the wild turkey in 1999. Proceedings of
of Environmental Science and Forestry, Syracuse, New the National Wild Turkey Symposium 8:15–22.
York, USA. Verbeylen, G., L. De Bruyn, F. Adriaensen, and E. Matthysen.
, K. A. Didier, B. R. Miranda, and W. F. Porter. 2004. 2003. Does matrix resistance influence red squirrel (Sciurus
Sensitivity of a white-tailed deer habitat-suitability index vulgaris L. 1758) distribution in an urban landscape? Land-
model to error in satellite land-cover data: implications for scape Ecology 18:791–805.
wildlife habitat-suitability studies. Wildlife Society Bulletin Wigley, T. B., J. M. Sweeney, M. E. Garner, and M. A. Mel-
32:158–168. chiors. 1985. Forest habitat use by wild turkeys in the
Glennon, M. J., and W. F. Porter. 1999. Use of Landsat imagery Ouachita Mountains. Proceedings of the National Wild Tur-
in habitat analysis for wild turkey. Wildlife Society Bulletin key Symposium 5:183–197.
27:646–653. Wikramanayake, E., M. McKnight, E. Dinerstein, A. Joshi, B.
Gustafson, E. J., G. R. Parker, and S. E. Backs. 1994. Evaluating Gurung, and D. Smith. 2004. Designing a conservation
spatial pattern of wildlife habitat: a case study of the wild landscape for tigers in human-dominated environments.
turkey (Meleagris gallopavo). American Midland Naturalist Conservation Biology 18:839–844.
131:24–33. Zar, J. H. 1984. Biostatistical analysis. Second edition. Prentice–
Hayden, A. H., and G. A. Wunz. 1975. Wild turkey population Hall, Englewood Cliffs, New Jersey, USA.
characteristics in northern Pennsylvania. Proceedings of the
National Wild Turkey Symposium 3:131–140.
Healy, W. M. 1992. Behavior. Pages 46–65 in J. G. Dickson,
editor. 1992. The wild turkey: biology and management.
Stackpole Books, Harrisburg, Pennsylvania, USA.
McDougal, L. A., M. R. Vaughan, and P. T. Bromley. 1990. Wild
turkey and road relationships on a Virginia national forest.
Proceedings of the National Wild Turkey Symposium 6:96–
106.
Palmer, W. E., and G. A. Hurst. 1995. Drainage systems as min-
imum habitat management units for wild turkey hens. Pro-
ceedings of the National Wild Turkey Symposium 7:97–
101.
Peoples, J. C., D. C. Sisson, and D. W. Speake. 1996. Wild
turkey brood habitat use and characteristics in coastal plain
pine forests. Proceedings of the National Wild Turkey Sym-
posium 7:89–96.
Porter, W. F. 1977. Home range dynamics of wild turkeys in Kathy Fleming received her MS in wildlife biology from Cali-
southeastern Minnesota. Journal of Wildlife Management fornia University of Pennsylvania and her PhD in wildlife ecol-
41:434–437. ogy from SUNY College of Environmental Science and Forest-
. 1978. The ecology and behavior of the wild turkey (Me- ry. Her research interests include avian habitat modeling, scale
leagris gallopavo) in southeastern Minnesota. Dissertation, issues in habitat analysis, and the effect of landscape patterns on
University of Minnesota, Minneapolis, Minnesota, USA. wildlife populations. She also has a strong interest in private
, and D. J. Gefell. 1996. Influences of weather and land lands habitat conservation and management, and currently works
use on wild turkey populations in New York. Proceedings as an ecologist in the Maryland DNR Wildlife and Heritage Ser-
of the National Wild Turkey Symposium 7:75–80. vice’s Landowner Incentive Program.
, R. D. Tangen, G. C. Nelson, and D. A. Hamilton. 1980.
Effects of corn food plots on wild turkeys in the upper
Mississippi Valley. Journal of Wildlife Management 44:
456–462.
Raybourne, J. Q. 1968. Telemetry of turkey movements. South-
eastern Association of Game and Fish Commissioners, Pro-
ceedings of Annual Conference 22:47–54.
Rempel, R. S., and A. P. Carr. 2003. Patch Analyst extension for
ArcView: version 3. ⬍http://flash.lakeheadu.ca/⬃rrempel/
patch/index.html⬎ Accessed 24 Apr 2006.
Reschke, C. 1990. Ecological communities of New York State.
New York Natural Heritage Program, New York State De-
partment of Environmental Conservation, Latham, New
York, USA.
SAS Institute. 1990. SAS/STAT users guide. Version 6. Fourth
edition. SAS Institute Inc., Gary, North Carolina, USA. William Porter is Professor of Wildlife Science at the State Uni-
Sisson, D. C., D. W. Speake, J. L. Landers, and J. L. Buckner. versity of New York College of Environmental Science and For-
1990. Effects of prescribed burning on wild turkey habitat estry in Syracuse. His research interests include habitat-popula-
preference and nest site selection in South Georgia. Pro- tion relationships at the landscape scale. He has been studying
ceedings of the National Wild Turkey Symposium 6:44–50. the wild turkey for more than 30 years.Manuscript published in
Wild Turkey Management:
Accomplishments, Strategies, and Opportunities
Proceedings of the
Ninth National Wild Turkey Symposium
Grand Rapids, Michigan
10-14 December, 2005
Edited by
C. ALAN STEWART AND VALERIE R. FRAWLEY
Michigan Department of Natural Resources
Lansing, Michigan
Sponsored by
Michigan Department Hal & Jean Glassen
of Natural Resources Memorial Foundation
National Wild Michigan State University, Michigan Chapter of
Turkey Federation Department of Fisheries and The Wildlife Society
Wildlife
U.S. Department of Agriculture, Wisconsin Department of
Forest Service Natural Resources
Published by
Michigan Department of Natural Resources © 2007You can also read