The Optimization Model of Ride-Sharing Route for Ride Hailing Considering Both System Optimization and User Fairness - MDPI
←
→
Page content transcription
If your browser does not render page correctly, please read the page content below
sustainability

Article
The Optimization Model of Ride-Sharing Route for Ride
Hailing Considering Both System Optimization and
User Fairness
Yi Cao, Shan Wang * and Jinyang Li

                                           School of Transportation Engineering, Dalian Jiaotong University, Dalian 116028, China;
                                           caoyi820619@aliyun.com (Y.C.); 18641179270@163.com (J.L.)
                                           * Correspondence: shan05_26@163.com; Tel.: +86-186-4117-9270

                                           Abstract: To fully take the advantages of ride-sharing ride hailing, such as high loading rate, high
                                           operating efficiency, and less traffic resources, and to alleviate the difficulty of getting a taxi in
                                           urban hubs, the topic of ride-sharing route optimization for ride hailing is studied in this paper.
                                           For the multiple ride hailing ride-sharing demands and multiple ride hailing services in the urban
                                           road network in a specific period, the objective function is established with the shortest route of
                                           the system. The constraint conditions of the optimization model are constructed by considering
                                           factors of the rated passenger capacity, route rationality, passenger benefits, driver benefits and time
                                           window. Based on the idea of the Genetic Algorithm, the solution algorithm of the optimization
                                           model is developed. According to the supply and demand data of taxi during peak hours in the local
                                           road network in the city of Dalian, the optimization model and algorithm are used to optimize the
                                           ride-sharing route scheme. Research results indicate that the optimization model and algorithm can
                                           find the approximate optimal solution of the system in a short time. Compared with the traditional
                                           non-ride-sharing mode, the ride-sharing scheme can not only effectively reduce the taxi empty-loaded
                                           rate and the travel cost of passengers, improve the efficiency of drivers, but also save energy and
                                 reduce emissions, and promote the sustainable development of urban traffic.


Citation: Cao, Y.; Wang, S.; Li, J. The    Keywords: traffic engineering; ride-sharing ride hailing; route optimization; Genetic Algorithm
Optimization Model of Ride-Sharing
Route for Ride Hailing Considering
Both System Optimization and User
Fairness. Sustainability 2021, 13, 902.    1. Introduction
https://doi.org/10.3390/su13020902
                                                 With the rapid development of the urban social economy, the travel demand of
Received: 16 December 2020
                                           residents continues to increase, and the difficulty of getting a taxi is becoming challenging.
Accepted: 12 January 2021
                                           Taxi is one of the important players in urban traffic, however, the transport capacity and
Published: 18 January 2021
                                           demand at off-peak and peak hours do not always match. Due to the high operating
                                           cost, it is often in the empty-loaded state in the off-peak hours; in the peak hours, it is
Publisher’s Note: MDPI stays neu-          often difficult to take a taxi because a large number of taxis only carry one passenger. The
tral with regard to jurisdictional clai-   traditional taxi ride-sharing behavior may cause excessive detour phenomenon, resulting
ms in published maps and institutio-       in an increase in the passengers’ travel cost and time. For ride-sharing taxis, it has the
nal affiliations.                          advantages of intelligent scheduling and route selection, which can offer more reasonable
                                           costs and reduce the total operating costs, so as to improve the enthusiasm of the drivers
                                           and passengers, make reasonable use of traffic resources, reduce the emission of tail
                                           gas, protect the environment, and promote the sustainable development of urban traffic.
Copyright: © 2021 by the authors. Li-
                                           Therefore, it is necessary to study the optimization model and algorithm of the ride-sharing
censee MDPI, Basel, Switzerland.
                                           route for ride hailing with the objective of the shortest ride-sharing route.
This article is an open access article
                                                 Normally, there is no sanitary situation concerns in ride-sharing. However, at present,
distributed under the terms and con-
                                           protective measures need to be taken during the epidemic period, such as using plastic
ditions of the Creative Commons At-
tribution (CC BY) license (https://
                                           sheeting to isolate the interior of taxis and wearing masks for drivers and passengers. Even
creativecommons.org/licenses/by/
                                           if there is no ride-sharing behavior, there are potential safety hazards in the case of an
4.0/).                                     epidemic situation, and protective measures are still needed.

Sustainability 2021, 13, 902. https://doi.org/10.3390/su13020902                                         https://www.mdpi.com/journal/sustainability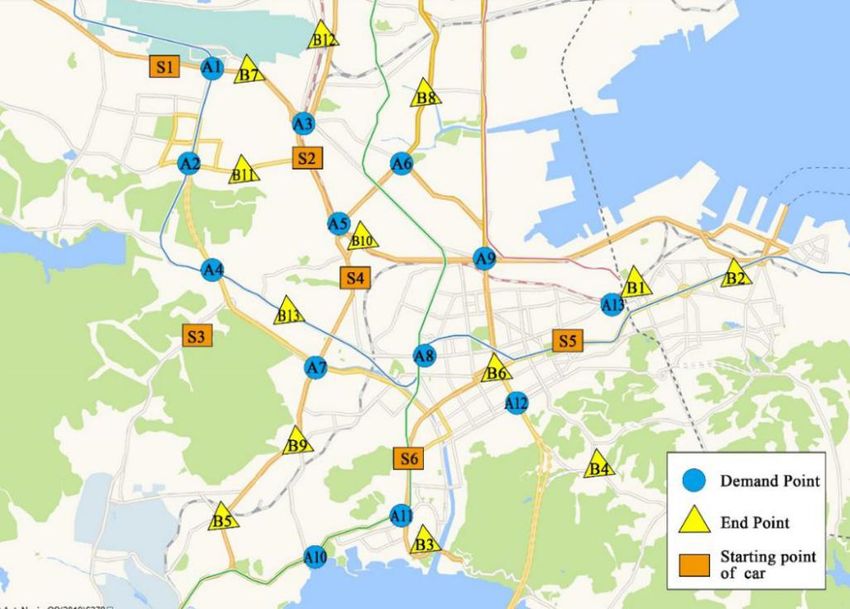
Sustainability 2021, 13, 902                                                                                           2 of 17

                                     The study in this field evolved from simple ride-sharing feasibility to more sophis-
                               ticated optimizations, such as the privacy of ride-sharing passengers, the design of ride
                               hailing ride-sharing mechanism, the factors that affect the ride hailing service, and the
                               characteristics of the usage behavior for ride-sharing [1–4]. Some mainly focused on ride-
                               sharing, Altshuler et al. [5] proposed a method for comprising a dynamically changing
                               network using the taxi-rides, and analyzing the topological properties of this network.
                               By analyzing the dynamics of these properties over time, they demonstrated their ability
                               to accurately predict changes in the utilization of ride-sharing several hours in advance.
                               Lee et al. [6] presented a real-time taxi ride-sharing dispatching system for feeder buses.
                               Chang et al. [7] proposed a dynamic ride-sharing system with real-time vehicular in-
                               formation, including expounding its system architecture, message flows, and matching
                               algorithms. Zhang et al. [8] designed a taxi ride-sharing system consisting of a dispatch
                               cloud server, passenger client and vehicle-mounted customized device. Daganzo and
                               Ouyang [9] presented a dispatching strategy, which only assigns the nearest suitable vehi-
                               cle to a passenger along the shortest path. Shen et al. [10] developed an online mechanism
                               for ridesharing in autonomous mobility-on-demand systems. Amey et al. [11] designed
                               a mechanism for the on-demand first-mile ridesharing, a service that arranges real-time
                               shared rides on very short notice to bring passengers to the nearby transit hub. In recent
                               years, the research mainly focuses on the optimization algorithm of ride-sharing route.
                               Among them, the leading idea was Genetic Algorithm. Zhou et al. [12] considered the
                               problem of ride-sharing route and cost sharing, constructed the optimization model with
                               the minimum travel time cost as the objective function, and solved it by Genetic Algorithm.
                               Zhang et al. [13] built a multi-objective optimization model for solving the taxi ride-sharing
                               with detour problem and designed a Genetic Algorithm to determine a fair pricing scheme
                               for riders and drivers. In order to optimize the taxi ride-sharing route, Ma et al. [14] built
                               the taxi ride-sharing route optimization model with single objective and its extended model
                               with multiple objectives respectively. Then, the model is solved based on the improved
                               single objective Genetic Algorithm and the improved multiple-objective Genetic Algorithm.
                               Rathod et al. [15] described an improved ride-sharing system, and apply advanced Genetic
                               Algorithm for finding optimal solution within a time. Although Genetic Algorithms have
                               been widely used, there are still some other algorithms in use. Cheikh-Graiet et al. [16]
                               presented the so-called dynamic ride-sharing optimization system, which took decisions
                               using a novel tabu search based metaheuristic. At the same time, they developed a simula-
                               tion environment based on realistic ride-sharing demand data. Zhao et al. [17] proposed
                               a heuristic algorithm with the objective of minimizing the average arriving distance of
                               all passengers in ride-sharing. Li et al. [18] proposed a heuristic routing algorithm to
                               identify the feasible routing paths for shared rides that interest both ride-sharing drivers
                               and riders. The analysis of matching failure and ride-sharing ridership provided guidance
                               on recommending stable matches and determining compensations in practice so as to main-
                               tain a balance between ride-sharing supply and demand. Tamannaei and Irandoost [19]
                               proposed an exact solution method based on Branch-and-Bound algorithm and a heuristic
                               beam search algorithm which minimizes the costs of travel times, the vehicle use, and the
                               vehicle delays. A bi-objective ride sharing matching model was proposed to maximize
                               both the total generalized trip cost saving and the number of matches [20]. The Monte
                               Carlo Simulation (MCS) method was developed to evaluate the mean generalized trip cost.
                               Additionally, they found a feasible ride-sharing match based on deterministic travel time
                               can become infeasible in a stochastic ride-sharing system. Masoud and Jayakrishnan [21]
                               presented a real-time algorithm to optimally solve the ride-matching problem in a flexible
                               ride-sharing system that maximizes the number of served riders in the system and mini-
                               mized the number of transfers and waiting times for riders. At the same time, they found
                               the proposed algorithm could solve matching problems in large-scale ride-sharing systems
                               in a fraction of a second. Furthermore, allowing transfers could have a considerable im-
                               pact on the number of served riders. Filcek et al. [22] used dynamic programming and
                               Dijkstra algorithm to solve the problem, and obtained the matching ride-sharing car and
Sustainability 2021, 13, 902                                                                                           3 of 17

                               ride-sharing route. Ma [23] proposed a solution algorithm based on optimal request-vehicle
                               assignments for solving dynamic bi-/multi-modal ridesharing problems. After testing,
                               this study provided a useful tool for real-time mobility-on-demand service planning and
                               designed in a multimodal transportation network. Naoum-Sawaya et al. [24] presented a
                               stochastic mixed integer programming model and took into account the unforeseen event
                               of vehicle unavailability, solved by heuristic algorithm. Lee and Savelsbergh [25] started
                               by formulating the matching problem as an integer program and designed a heuristic
                               to solve. In addition, some scholars studied the pricing of ride-sharing taxis. For exam-
                               ple, Zhang et al. [26] mainly studied the taxi sharing routes and constructed the sharing
                               expense model. Ma et al. [27] discussed ride-sharing user equilibrium problem under
                               OD-based surge pricing strategy. They discovered the ride-sharing under this strategy
                               reduces not only the travel cost for travelers but also the deliberate detours. Di et al. [28]
                               introduced average vehicle occupancy ratio into cost calculation to represent more realistic
                               aspects of ride-sharing costs subdued by ride-sharing drivers and passengers. Lei et al. [29]
                               proposed a multi-period game-theoretic model that addresses dynamic pricing and idling
                               vehicle dispatching problems in the on-demand ride-sharing systems with fully compliant
                               drivers and vehicles. It could help ride-sharing service providers achieve better system
                               performance while facing spatial and temporal variations in ride-sharing demand.
                                     In terms of the research on the ride-sharing optimization problem, many literatures
                               focus on the system optimization. The consideration of the ride-sharing cost directly
                               determines the interests of both drivers and passengers, but there is a game between them,
                               so the simple cost-sharing method is usually adopted, which is controversial about fairness.
                               However, it is a challenge to establish a fair ride-sharing route optimization model for the
                               ride hailing, taking into account both system optimization and user fairness, and enhancing
                               the rationality of ride-sharing. Therefore, although researchers have done some studies on
                               taxi ride-sharing route optimization, they mainly focus on the algorithm itself. Different
                               algorithms or operators are designed to solve the problem efficiently. The principle of
                               system optimization and user fairness is rarely considered in the modeling. In addition,
                               there is also a lack of constraints on the benefit of drivers and ride-sharing passengers. In
                               view of the above gaps, this paper contributes to the existing literature on ride-sharing for
                               ride hailing in threefold:
                               1.   Under the premise of system optimization, the user fairness is considered, which
                                    makes the long detour travel bear less cost and get more cost compensation. This fills
                                    the gap of previous literature which only considers system optimization.
                               2.   In the optimization model, the benefits of drivers and passengers are taken into
                                    account to ensure the enthusiasm of ride-sharing, which fills the gap of the existing
                                    optimization model for a ride-sharing route.
                               3.   The crossover operator and mutation operator are improved in the model, and the
                                    order of chromosome coding of infeasible solution is adjusted to update it into feasible
                                    solution, and on this basis, the optimization is carried out.
                                     The research results show that the implementation of ride-sharing ride hailing mode
                               can reduce the empty-loaded rate of vehicles and improve the occupancy rate of passen-
                               gers. It can not only create more benefits for passengers and drivers, but also realize the
                               reasonable allocation of resources. At the same time, it is conducive to moderate control of
                               taxi scale, relieve urban traffic pressure and energy consumption, environmental pollution
                               and so on, which promotes the sound and stable development of urban economy and the
                               green sustainable development of urban traffic.
                                     The remainder of this paper is organized as follows. Section 2 gives the problem
                               description and model assumptions of the optimization model for ride-sharing route.
                               Section 3 is the construction of the optimization model. Using the soft time window and
                               benefit of drivers and passengers to restrict, it can ensure the fairness of users and the
                               enthusiasm of drivers and passengers. In Section 4, we design a Genetic Algorithm to solve
                               the optimization model. Then, a case study is conducted to verify the optimization effect
                               and application feasibility of the ride-sharing route optimization model for ride hailing
Sustainability 2021, 13, 902 4 of 17
based on Genetic Algorithm in Section 5. Finally, Sections 6 and 7 present the discussions
and conclusions of this paper.
2. Problem Description and Model Assumptions
2.1. Problem Description
The task of optimizing the ride-sharing route for ride-sharing ride hailing is an exten-
sion of vehicle routing problems with time windows (VRPTW). The following questions
are considered in the optimization.
(1) Combinatorial optimization problem
Within a certain period, that is, the system refresh time, there are r pairs of travel
demand in the road network. The optimization seeks the best combination of matching
passengers to a vehicle to yield the least total operating mileage of the ride hailing service
system.
(2) Taxi assignment problem
During the above period, there are k taxis in the road network. The algorithm assigns
taxis to the above passengers to obtain the optimal ride-sharing scheme of the system.
(3) The shortest path problem
When the scheme of the ride-sharing route is determined, the node order of each taxi
ride-sharing demand is given. Then, the shortest path between adjacent nodes needs to
be solved. This is a classic problem that can be solved by a classic algorithm, so it is not
discussed in this paper.
For the research and modeling of problem 1 and 2, the following mathematical de-
scription can be made:
There are r pairs of travel demand in the road network (1,2, . . . , r). Each of them
corresponds to a unique pair of starting and ending points. There are also k taxis available
for ride-sharing (1,2, . . . , k). The rated passenger capacity of taxi is Q. In the road network,
the number of passengers in taxi s at point i after getting on and off is qis . The time window
given by passengers is [Tj1, Tj2 ]. Under the conditions of qsI ≤ Q and ArrT sj ≤ Tj2 , the
optimal ride-sharing scheme with the shortest total operating mileage of the system is
obtained to minimize the total mileage of the system.
2.2. Assumptions
The optimization model of ride-sharing route for ride hailing follows the basic as-
sumptions: All taxis run at a constant speed on the road network; The time window
conditions for booking passengers are fixed and known; The travel time of taxis arriving at
the destination can be predicted; Passengers node positions are based on the demand pair.
If the nodes coincide, the distance between two nodes is represented by the right-of-way of
0; The number of passengers required for each pair is no more than the taxi capacity.
2.3. Parameter Definition
The notations used throughout this paper are listed in Table 1.Sustainability 2021, 13, 902 5 of 17
Table 1. Parameters and Variables in the Optimization Model.
Symbol Definition
Collections and indexes
N Set of all nodes
O, D Set of all demands starting points, ending points
K Set of all taxi numbers
R Set of passenger demand pairs
i, j, p, m Index of all nodes
s Index of taxi numbers
a, b Index of demand starting number, ending number
r Passenger demand pairs index
Related parameters
Q Rated capacity of the taxi
B A maximum value
pr Number of passengers in group r
tijs Time from i to j
dij Actual distance of the shortest route from node i to node j
vs Average speed of the taxi
Tj1 Earliest arrival time of the taxi
Tj0 Driver arrives at point j at the latest without penalty
Tj2 Latest arrival time of the taxi
r1 Driver late penalty factor
r0 Traditional taxi fare per kilometer
c0 Starting price of traditional taxi
D0 Starting price kilometer of traditional taxi
Dr Direct mileage of passengers in group r
∝ Ride-sharing discount rate
β Extra detour discount rate
Decision variables
xijs xijs = 1, if s car passes through the arc (i, j); xijs = 0, otherwise.
yrab y ab = 1, if group r gets on at point a and gets off at point b; yrab = 0, otherwise.
r
zrij zrij = 1, if the passenger of group r passes through the arc (i, j); zrij = 0, otherwise.
Other variables
ArrT is , ArrTj s Actual arrival time of taxi s at point i or j
DepT is , DepTj s Actual departure time of taxi s at point i or j
Pas The penalty function of taxi s timeout at point a
cr Regular taxi fare
Fr Passengers are required to pay for online taxis fees
Gr Detour ratio in ride-sharing mode
Hs Benefits of taxi s serving the whole journey in a traditional way
3. Model Development
3.1. Objective Function
In this paper, the objective function (1) is established with the shortest ride-sharing
route of the ride hailing service system.
minZ = ∑ ∑ ∑ xijs · dij (1)
i∈ N j∈ N s∈K
3.2. Vehicle Path Constraints
Vehicle path constraints represent the basic rules for ride-sharing ride hailing on the
road network [30].
∑ ∑ xijs = 1 ∀j ∈ N (2)
i ∈ N (i 6 = j ) s ∈ K
∑ ∑ xijs = 1 ∀i ∈ N (3)
j ∈ N (i 6 = j ) s ∈ KSustainability 2021, 13, 902 6 of 17
∑ x spj − ∑ x sjm = 0 ∀ j ∈ N, ∀s ∈ k (4)
p∈ N m∈ N
yrab = 1 ⇒ ∑ xibs − ∑ xsaj = 0 ∀ a ∈ O, ∀b ∈ D, ∀s ∈ K, ∀r ∈ R (5)
i∈ N j∈ N
Equations (2) and (3) ensure that there is only one car for any starting and ending
points. Equation (4) ensures that the vehicle arriving at any node is the same vehicle
departing from the node. In order to ensure its effectiveness, the distance from each
passenger demand point to the starting point of taxi departure is assumed to be 0, that is,
the reverse distance is defined as 0; the forward distance is still the actual distance. In this
way, when the taxi reaches the last demand ending point, it can be regarded as returning
to the starting point of departure. Equation (5) ensures that any pair of demands must be
served by the same taxi. If there are two or more groups of demands with the same starting
point or ending point, the nodes will be marked with different numbers.
3.3. Rated Capacity Constraints
In the process of taxi ride-sharing service, the number of passengers in the car at any
time should be less than or equal to its rated passengers.
zrij = 1 ⇒ ∑ xijs = 1 ∀i, j ∈ N, ∀r ∈ R (6)
s∈K
∑ ∑ zrij · pr ≤ Q ∀i ∈ N (7)
j∈ N r ∈ R
Equation (6) represents the relationship between decision variables, indicating that there
must be only one taxi passing on any arc (i, j) where passengers are present. Equation (7)
restricts the capacity of each arc in order to ensure that the number of passengers in the taxi is
not greater than the maximum loading capacity Q.
3.4. Time Window Constrains
When passengers accept taxi ride-sharing service, they always expect the taxi to arrive
within their expected time frame. Therefore, passengers need to provide the expected
arrival time interval [Tj1, Tj2 ], which is the time window condition. Tj0 is taken as the
critical point of the passenger’s tolerance deterioration and then the soft time window
constraint is used in the paper, which is different from the hard time window constraints
of previous studies, as shown in Figure 1.
ArrTjs = xijs ( DepTis + tijs ) ∀i, j ∈ N, ∀s ∈ K (8)
Sustainability 2021, 13, x FOR PEER REVIEW 7 of 17
ArrTjs − ArrTis − B · xijs ≥ tijs − B ∀i ∈ N, ∀ j ∈ N, i 6= j, ∀s ∈ K (9)
Figure 1.
Figure 1. Time
Time Window
WindowDiagram.
Diagram.
ArrTjs = xijs (DepTi s + tijs ) ∀i, j ∈ N, ∀s ∈ K (8)
s s s sSustainability 2021, 13, 902 7 of 17
The time when the taxi s reaches point j from point i can be represented by Equation (8).
Equation (9) is used for sub-ring elimination, ensuring the arrival order of two adjacent points.
dij
tijs = ∀i, j ∈ N (10)
vs
The time of taxi s passing through the point i and point j can be computed by Equation (10).
ArrTis ≤ Ti2 ∀i ∈ N, ∀s ∈ K (11)
ArrTis ≤ Ti1 ⇒ DepTis = Ti1 ∀i ∈ N, ∀s ∈ K (12)
Ti1 ≤ ArrTis ≤ Ti2 ⇒ DepTis = ArrTis ∀i ∈ N, ∀s ∈ K (13)
The time constraint reflects the time window limitation in the process of vehicle
service, and also stipulates the behavior rules of vehicles arriving at the service point in
different time periods. The specific constraints are shown as Equation (11) to Equation (13).
Equation (11) indicates that the actual arrival time of the taxi should be less than the latest
arrival time Tj2 requested by the passenger. Equation (12) indicates that the moment when
the taxi s reaches point i is less than the earliest arrival time given by the passenger. Then
the taxi s must wait at the point i until the passenger arrives at the earliest arrival time
before leaving the point i. Equation (13) indicates that when the taxi s arrives at point i
between the earliest arrival time of the passenger and the latest arrival time of the taxi, the
taxi arrival time is considered to be the same as the departure time.
ArrTas < Ta0
0
Pas = (14)
r1 ( ArrTas − Ta0 ) Ta0 < ArrTas < Ta2
When the taxi arrival time is later than the optimal arrival time Ta0 , it means that the
passenger needs to wait for the taxi to arrive, and the tolerance of the passengers begins to
deteriorate. In this case, the taxi driver should bear the loss of passengers. Therefore, its
penalty function Pas can be calculated by Equation (14).
For the actual operation time Ta0 < ArrT sa < Ta2 , the penalty function Pas , which is the
increased operating cost, will be considered in the following section.
3.5. Benefit Constraints of Passengers and Drivers
The benefit constraints of passengers and drivers are the formulation of pricing rules
for ride-sharing taxis, which ensures the social feasibility of ride-sharing taxi operation.
Equation (15) defines the traditional taxi charging standard.
r0 ( Dr − D0 ) + c0 Dr > D0
r
c = (15)
c0 Dr ≤ D0
From the passenger’s point of view, in order to improve the operating benefits, the
cost savings of ride-sharing passengers must be taken into account. Otherwise, passengers
will lose interest in taxi ride-sharing service. Therefore, it is necessary to ensure that the
cost of the ride-sharing service is less than or equal to the price of traditional taxis.
( ∑ ∑ zrij · dij − Dr )
i∈ N j∈ N
Gr = ≤ 0.6 ∀r ∈ R (16)
Dr
∑ zraj · yrab = ∑ zrib · yrab = 0 ⇒ Fr = cr − ∑ Pas ∀r ∈ R, ∀ a ∈ O, ∀b ∈ D (17)
j∈ N,j6=b i ∈ N,i 6= a s∈K
∑ zraj · yrab = ∑ zrib · yrab = 1 ⇒ Fr = cr (α − β · Gr ) − ∑ Pas ∀r ∈ R, ∀ a ∈ O, ∀b ∈ D (18)
j∈ N,j6=b i ∈ N,i 6= a s∈KSustainability 2021, 13, 902 8 of 17
HS = ( ∑ ∑ xijs · dij − D0 ) × r0 + c0 ∀s ∈ K (19)
i ∈O∪ D j∈O∪ D
Hs ≤ ∑ ∑ ∑ (zrij · xijs · Fr ) ∀s ∈ K (20)
i∈ N j∈ N r ∈ R
Equation (16) defines the detour discount rate and ensures that the vehicle detour
mileage does not exceed 1.6 times the direct path. Equation (17) indicates the passenger’s
ride fee to be paid for the non-ride-sharing mode. Equation (18) indicates the passenger’s
ride fee for the ride-sharing mode. It also ensures that the ride-sharing route with long de-
tour distance has a better discount rate to obtain more travel compensation cost. Therefore,
the unfairness of different groups of passengers caused by the different ride-sharing detour
distance is taken into account.
From the driver’s point of view, it is also necessary to ensure that the benefits providing
ride-sharing services are not lower than those of traditional non-ride-sharing mode in order
to increase the enthusiasm of ride-sharing services. Equation (19) represents the driver’s
minimum earnings standard, that is, the earnings of driving the same mileage in traditional
non-sharing mode. Equation (20) ensures that the driver’s earnings should be greater than
or equal to the minimum standard earnings.
According to the Sections 2 and 3, the methods directly relevant to this paper, that
address the ride-sharing optimization problem, are listed in Table 2.
Table 2. Related methods on ride-sharing with consideration of route optimization.
Constraints
Categories Optimization Idea Vehicle Path Rated Capacity Soft Time Window Benefit Constraints of
Constraints Constraints Constraints Passengers and Drivers
Existing studies System optimization Fixed Fixed Fixed Cost-sharing method
Both system optimization Introduce detour cost
This paper Fixed Fixed Fixed
and user fairness compensation
4. Genetic Algorithm
In this section, we use Genetic Algorithm to solve the optimization model of ride-
sharing route, and the reasons are as follows. Genetic Algorithm directly takes the feasible
solution of the objective function as the search information, and the process is simple;
Genetic Algorithm has the characteristics of group search and better global search; Ge-
netic Algorithm optimization mechanism is based on probability rules, which makes the
search more flexible; the problem adopts natural number coding scheme, which is easy to
understand and easy to implement by Genetic Algorithm.
4.1. Chromosome Coding
In this paper, the chromosome is coded by a decimal number [31]. The solution vector
of the route optimization model can be coded into a chromosome with a length of 2r
+ 3k + 1 (0, s1 , i1 , i2 , . . . , ia , 0, s2 , ia+1 , ia+2 , . . . , ib , 0, sj , ij . . . , 0, sk , ic , . . . ir , 0). There
are k taxis providing ride-sharing services in the system, and each sub-path has a taxi
to complete the ride-sharing service. In each segment of the code, the second natural
number sj represents the taxi number currently providing ride-sharing services. The third
natural number ir represents the node number of the current location of the taxi providing
ride-sharing service. The subsequent code i indicates the starting and ending number
of each ride-sharing demand. Since each pair of ride-sharing demands corresponds to a
starting point and an ending point, the total number of codes in this category is 2r.
4.2. Fitness Evaluation
The objective function is used to construct fitness evaluation, and roulette is used to
ensure that individuals with better fitness have a higher probability of being selected.Sustainability 2021, 13, 902 9 of 17
4.3. Improved Crossover Operator
The chromosomes with the highest fitness in each generation are directly copied into
the next generation. The other chromosomes are crossed with a probability of 0.6 [14,32].
Due to the constraints of ride-sharing route optimization problem and the demand for
the order of getting on and off, if a simple crossover operator is used, a large number of
infeasible solutions would be generated. Therefore, the improved crossover operator is
proposed in this paper.
For two parental chromosomes, select a section between the third element and first
zero element for members that does not end with zero, then simple crossover is imple-
mented to generate two offspring chromosomes.
For the offspring chromosomes, choose natural numbers that are repeated after cross-
ing. If the number is in a non-crossing position, it is deleted. If it is within the crossing
position, it is reserved. If there is a travel demand point that has not been visited in the
offspring, the natural number corresponding to the point should be complemented outside
the crossing position of chromosomes.
According to the taxi ride-sharing route optimization model, deleting point pairs
from a route does not affect its feasibility. At the same time, after counting the lost point
pairs of chromosomes in offspring, they are inserted into chromosomes according to the
previous insertion steps. The strategy of retaining excellent individuals is adopted for new
individuals. Only when the fitness of the new individual is better than that of the old one,
the chromosome will be updated.
4.4. Improved Mutation Operator
The mutation adopts the internal two positions exchange method, and the mutation
operation is carried out with the probability of 0.1 [14,32]. Firstly, the mutation pos1 and
pos2 are randomly selected from the demand starting point, and then the two mutated
positions are exchanged and delete the corresponding ending points. Finally, the ending
point is inserted at a random position in the sub-path of its corresponding starting point,
and the strategy of retaining excellent individuals is also adopted for the new individuals.
5. Case Study
Mobile devices and ubiquitous connectivity make it easier than ever to collect data,
such as GPS technology, CRAWDAD dataset, Floating Car Data, and Big-data [4,33–35].
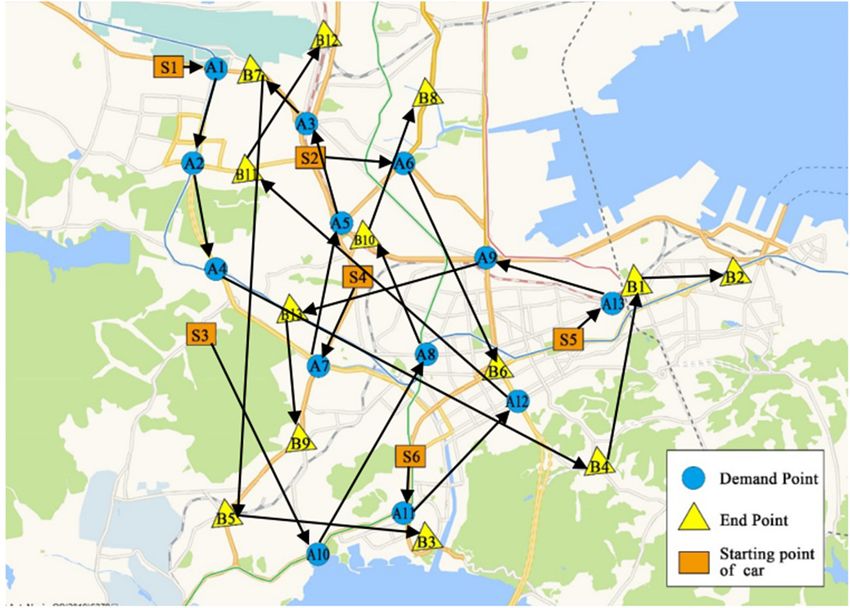
The city of Dalian is selected for the case study. The taxi travel demands within
5 min during peak hours are used. In this case, we use the demand point data obtained
by taxi software, and its longitude and latitude are picked up by electronic map. The
starting position data of the taxi driving are shown in Table 3. The road network is shown
in Figure 2.
Table 3. Taxi starting coordinate information.
S1 S2 S3 S4 S5 S6
Longitude (◦ ) 121.540112 121.569936 121.545933 121.578919 121.626709 121.591927
Latitude (◦ ) 38.965845 38.949965 38.92044 38.93105 38.918475 38.899608tion data of the taxi driving are shown in Table 3. The road network is shown in Figure 2.
Table 3. Taxi starting coordinate information.
Sustainability 2021, 13, 902
S1 S2 S3 S4 S5 S6
10 of 17
Longitude (°) 121.540112 121.569936 121.545933 121.578919 121.626709 121.591927
Latitude (°) 38.965845 38.949965 38.92044 38.93105 38.918475 38.899608
Figure2.2.Distribution
Figure Distributionof
ofRide-sharing
Ride-sharingDemand
Demandand
andAvailable
AvailableTaxis.
Taxis.
According to
According to thethe survey information, the
the time
time window
windowof
ofeach
eachdemand
demandpoint
pointisistj1t,j1t,j0
t=j0 t=
j1 +
tj14,+tj24,=tj2
tj0 =+ t2,j0 as shown
+ 2, in Table
as shown 4. 4.
in Table
Table 4. Information on Travel Demand Points.
Number of Passengers Number of Passengers
Origin-Destination Time Window Longitude (◦ ) Latitude (◦ )
Getting on Getting Off
A1 121.550245 38.96447
1 1 (0–5–7)
B1 121.638638 38.927654
A2 121.545358 38.949207
1 1 (0–5–7)
B2 121.658473 38.930461
A3 121.568211 38.957288
2 2 (1–6–8)
B3 121.596238 38.88464
A4 121.575254 38.920243
1 1 (3–8–10)
B4 121.632027 38.897895
A5 121.576548 38.938544
1 1 (0–6–8)
B5 121.551826 38.890144
A6 121.590346 38.949207
3 3 (2–7–9)
B6 121.610755 38.914067
A7 121.571805 38.915752
1 1 (0–5–7)
B7 121.560019 38.963909
A8 121.593795 38.917324
1 1 (1–6–8)
B8 121.596095 38.960767
A9 121.607449 38.932818
2 2 (1–6–8)
B9 121.568643 38.902163
A10 121.570367 38.883741
1 1 (2–7–9)
B10 121.579566 38.93686
A11 121.590202 38.891043
1 1 (2–7–9)
B11 121.554845 38.947636
A12 121.614779 38.908228
2 2 (1–6–8)
B12 121.572236 38.970193
A13 121.636626 38.926868
2 2 (1–6–8)
B13 121.56663 38.923949
The taxi operating cost parameters adopt the current standard of Dalian. The starting
mileage is 3 km, the starting price is 10 CNY, and the unit price is 2 CNY/km. The price ofB11 121.554845 38.947636
A12 121.614779 38.908228
2 2 (1–6–8)
B12 121.572236 38.970193
A13 121.636626 38.926868
2 2 (1–6–8)
B13 121.56663 38.923949
Sustainability 2021, 13, 902 11 of 17
The taxi operating cost parameters adopt the current standard of Dalian. The starting
mileage is 3 km, the starting price is 10 CNY, and the unit price is 2 CNY/km. The price of
No. 92 gasoline is 5.85 CNY/L, and the fuel consumption of a taxi is assumed to be 8 L per
No.
100 km.92After
gasoline is 5.85 CNY/L,
conversion, and is
the fuel cost the fuelCNY/km.
0.468 consumption of a taxi
The taxi’s ratedis passenger
assumed to be 8 L
capac-
per 100 km. After conversion, the fuel cost is 0.468 CNY/km. The taxi’s rated
ity is 4, the initial number of passenger is 0, and the average speed is 40 km/h. The ride- passenger
capacity
sharing is 4, therate
discount initial
α isnumber
0.9, and of
thepassenger is 0, andrate
detour discount theβaverage
is 0.4. speed is 40 km/h. The
ride-sharing discount rate α is 0.9, and the detour
The Genetic Algorithm is programmed with MATLAB. The discount rate initial
β is 0.4.
population size is
The Genetic Algorithm is programmed with MATLAB. The initial population size is
80. After 300 generations of evolution, the fitness function tends to be stable, and the final
80. After 300 generations of evolution, the fitness function tends to be stable, and the final
result is obtained. After three runs, the fitness function is obtained, as shown in Figure 3.
result is obtained. After three runs, the fitness function is obtained, as shown in Figure 3.
Sustainability 2021, 13, x FOR PEER REVIEW 12 of 17
Figure 3. Relation Curve between Iteration Times and Objective Function.
Figure 3. Relation Curve between Iteration Times and Objective Function.
According
According to to Figure
Figure 3,3, itit can
can be
be found
found that
that in
in the
the results
results of
of three
three runs,
runs, the
theobjective
objective
function tends to be stable after 75 iterations. The total mileage of plan
function tends to be stable after 75 iterations. The total mileage of plan a, plan b, and a, plan b, plan
and
plan c are 92.033 km, 96.852 km, and 92.676 km respectively. Among
c are 92.033 km, 96.852 km, and 92.676 km respectively. Among them, the optimal combi- them, the optimal
combination
nation is planisa,plan a, as shown
as shown in Figurein Figure
4. 4.
Figure 4.
Figure 4. Optimal
Optimal Route
Route Optimization
Optimization Results.
Results.
At the same
At same time,
time,using
usingthe
thebranch
branchand bound
and boundmethod,
method,thethe
optimal totaltotal
optimal driving dis-
driving
tance is 88.841
distance km.km.
is 88.841 The The
specific routeroute
specific and operation time of
and operation the of
time twothealgorithms are shown
two algorithms are
shown
in Tablein5.Table 5.
Table 5. The Optimization Results of Combined Path.
Algorithm Type Taxi Number Operation Time (s) Optimize Route Taxi mileage (km)
S1 1↑−2↑−4↑−4↓−1↓−2↓ 1 19.767
S2 6↑−6↓ 6.87
S3 10↑−8↑−10↓−8↓ 16.857
GA 30
S4 7↑−5↑−3↑−7↓−5↓−3↓ 20.558
S5 13↑−9↑−13↓−9↓ 23.912
S6 11↑−12↑−11↓−12↓ 15.068Sustainability 2021, 13, 902 12 of 17
Table 5. The Optimization Results of Combined Path.
Algorithm Type Taxi Number Operation Time (s) Optimize Route Taxi Mileage (km)
S1 1↑−2↑−4↑−4↓−1↓−2↓ 1 19.767
S2 6↑−6↓ 6.87
S3 10↑−8↑−10↓−8↓ 16.857
GA 30
S4 7↑−5↑−3↑−7↓−5↓−3↓ 20.558
S5 13↑−9↑−13↓−9↓ 23.912
S6 11↑−12↑−11↓−12↓ 15.068
S1 1↑−2↑−1↓−2↓ 15.64
S2 6↑−6↓ 6.87
S3 4↑−3↑−3↓−4↓ 17.64
Branch and bound 128
S4 5↑−5↓−10↑−11↑−7↑−10↓−11↓−7↓ 23.095
S5 13↑−9↑−13↓−9↓ 12.912
S6 12↑−8↑−8↓−12↓ 12.684
1 ↑means getting on, ↓means getting off.
In addition to this case, this study has also done case studies of other scales, which are
not presented due to the length. In different scales, the operation time of Genetic Algorithm
and Branch and bound is shown in the Table 6.
Table 6. The operation time of the Genetic Algorithm and Branch and bound.
Operation Time (s)
Scale of Case Study
GA Branch and Bound
Small scale and less demand 24 s 43 s
This case 30 s 128 s
Large scale and large demand 39 s no feasible solution
From the comparison of the operation time of the Genetic Algorithm and Branch and
bound in Table 6, it can be seen that the operation time of the Genetic Algorithm increases
little when the actual road network becomes larger, while the operation time of Branch
and bound increases significantly. Moreover, with the increase of road network, Branch
and bound will exceed the refresh time of the system, and may not get a feasible solution.
Therefore, when the scale is expanded to the urban road network level, the operation
time of the accurate algorithm is too long and the solution fails, which can not meet the
needs of real-time, and is unacceptable in the real network ride-sharing route planning for
ride hailing.
As the accuracy and efficiency of the route optimization results are the necessary
conditions for the algorithm to be put into actual operation, the Genetic Algorithm is used
for six operations in this case, and the results are as shown in Figure 5.
According to the optimization mileage in Figure 5, after six runs, the maximum
difference is only 6.218 km, which is less than 6.58% of the total mileage for ride-sharing.
Therefore, the objective function value calculated by the Genetic Algorithm designed in
this paper fluctuates in a reasonable range.
For the ride-sharing route optimization scheme and non-ride-sharing scheme under
the same demand conditions, driver earnings, driver fuel costs, and passenger costs are
compared as shown in Table 7.
According to the data analysis in Table 7, in terms of vehicle use, there are 13 groups
of demand pairs in this case. For the traditional taxi operation mode, 13 taxis are required
to jointly complete the task. Under this ride-sharing scheme, only 6 taxis are used, of which
the empty-loaded rate is only 8%. According to the survey data, the average empty-loaded
taxi rate in Dalian is about 35%. It proves that the scheme can effectively reduce the
demand for taxis and the average empty-loaded rate. In terms of driver earnings, the
driver earnings of each ride-sharing taxi are greater than or equal to the maximum earningsFrom the comparison of the operation time of the Genetic Algorithm and Branch and
bound in Table 6, it can be seen that the operation time of the Genetic Algorithm increases
little when the actual road network becomes larger, while the operation time of Branch
Sustainability 2021, 13, 902
and bound increases significantly. Moreover, with the increase of road network, Branch 13 of 17
and bound will exceed the refresh time of the system, and may not get a feasible solution.
Therefore, when the scale is expanded to the urban road network level, the operation time
of the accurate algorithm is too long and the solution fails, which can not meet the needs
of
of areal-time,
single driver inunacceptable
and is the non-sharing taxi
in the scheme.
real network It ride-sharing
indicates thatroute
ride-sharing
planningscheme
for ride
can fully protect the interests of taxi drivers and their interest in providing ride-sharing
hailing.
service.As In
theterms of passenger
accuracy cost, the
and efficiency ofcost
the paid
routeby each group results
optimization of passengers
are theunder the
necessary
ride-sharing scheme is less than or equal to that of the non-ride-sharing scheme.
conditions for the algorithm to be put into actual operation, the Genetic Algorithm is used It indicates
that theoperations
for six ride-sharing inscheme notand
this case, only
thesaves theare
results costasofshown
passengers but also
in Figure 5. guarantees their
enthusiasm to choose
According to theride-sharing
optimizationservice.
mileageIninterms
Figure of 5,
driver
afterfuel cost, under
six runs, the scheme
the maximum dif-
of ride-sharing,
ference is only the fuel
6.218 consumption
km, which is lessof vehicles
than 6.58%is less, andtotal
of the the fuel cost borne
mileage by drivers
for ride-sharing.
isTherefore,
also less. the
It means thatfunction
objective ride-sharing
valuecan reduce fuel
calculated consumption
by the of vehicles,
Genetic Algorithm reduce
designed in
environmental pollution and promote
this paper fluctuates in a reasonable range. green development of urban transportation.
99 98.251
98 96.852
The total mileage/km
97
96
95 94.176
94
92.676
93 92.033 92.243
92
91
90
89
88
1 2 3 4 5 6
The number of running
Figure5.5.The
Figure Thescatter
scatterof
ofthe
thelimit
limitvalues
valuesof
ofthe
thefunctions.
functions.
For
Table 7. Earnings the
and ride-sharing
Cost route optimization
of Taxi and Passenger schemeand
with Ride-sharing andNon-sharing.
non-ride-sharing scheme under
the same demand conditions, driver earnings, driver fuel costs, and passenger costs are
Taxi Driver Earnings(CNY) Passenger Cost (CNY) Driver Fuel Cost (CNY)
Demand Number compared as shown in Table 7.
Ride-Sharing Non-Sharing Ride-Sharing Non-Sharing Ride-Sharing Non-Sharing Ride-Sharing Non-Sharing
A1 TableS17. Earnings and Cost of Taxi
26.03 20.82with Ride-sharing
and Passenger 26.03 and Non-sharing. 6.68
A2 S1 S2 64.17 31.44 25.15 31.44 9.25 8.26
A4 S3 22.76 18.20 22.76 5.72
Demand Taxi Driver Earnings(CNY) Passenger Cost (CNY) Driver Fuel Cost (CNY)
A6 S2 S4 13.05 13.05 13.05 13.05 3.22 3.22
Number Ride-Sharing Non-Sharing Ride-Sharing Non-Sharing Ride-Sharing Non-Sharing Ride-Sharing Non-Sharing
A8 S5 13.97 11.17 13.97 3.15
A1
A10 S3 S1 S6 25.36 26.03
17.74 20.82
14.19 26.03
17.74 7.89 6.68
4.25
A2A3
S1 S2 S7 64.17 31.44
20.71
25.15
16.57
31.44
20.71
9.25 8.26
5.12
A4A5 S4 S3 S8 41.5 22.76
15.61 18.20
12.49 22.76
15.61 9.62 5.72
3.62
A7 S9 15.55 12.44 15.55 3.61
A6 S2 S4 13.05 13.05 13.05 13.05 3.22 3.22
A9 S10 14.76 11.81 14.76 3.38
A8
A13 S5 S5S11 28.15 13.97
20.43 11.17
16.34 13.97
20.43 11.19 3.15
5.04
S3 25.36 7.89
A10
A11
S6S12 17.74
19.00
14.19
15.20
17.74
19.00
4.25
4.62
S6 31.39 7.05
A3
A12 S7S13 20.71
20.23 16.57
16.19 20.71
20.23 5.12
4.98
A5
total S4 6 S8 13 41.5
203.62 15.61
251.28 12.49
203.62 15.61
251.28 9.62
48.22 3.62
61.65
A7 S9 15.55 12.44 15.55 3.61
A9 S10Nowadays, although ride-sharing
14.76 11.81 14.76
service is only welcomed by some groups, 3.38 and
S5 28.15 11.19
A13 S11 20.43 16.34 20.43 5.04
most of them are young and middle-aged men [4], according to the above case study, in
A11
S6 theS12
future, if we 19.00
can reasonably
31.39
15.20
guide people 19.00
to choose ride-sharing 4.62
7.05service, it can not
A12 S13 20.23 16.19 20.23 4.98
only save energy and reduce emissions, but also can cooperate with the government’s
total 6 13 203.62 251.28 203.62 251.28 48.22 61.65
sustainable development policy, which functions to reduce operating costs of the city and
save energy, so as to maximize social interests and benefit the whole society.
6. Discussion
6.1. Compared with the Traditional Vehicle Routing Problem
To the best of our knowledge, the vehicle routing problem (VRP) has always been one
of the most challenging problems, which involves the design of optimal routes for the fleetSustainability 2021, 13, 902 14 of 17
and has high practicability. In fact, the ride-sharing ride hailing problem is also a problem
evolved from VRP.
Consistent with the relevant research on VRP [36], the ride-sharing ride hailing prob-
lem also realize the organization of appropriate routes through algorithms to meet the
needs of customers. Although there are some similarities between the ride-sharing ride
hailing and VRP, it has its unique particularity. In traditional vehicle routing problem, the
vehicles have fixed stations and starting points, and they must return to the origin after
completing the service [37]. In this paper, the starting points of ride hailing are different.
There is no fixed station for ride hailing, so there is no need to wait in the same station.
After the service is finished, the taxis can continue to serve without returning to the starting
points. In addition, different passengers correspond to the different starting and ending
points. Therefore, there is an order problem for taxi passengers to get on and off.
6.2. Compared with the Existing Researches on the Ride-Sharing Ride Hailing
The ride hailing ride-sharing is an effective sharing economy mode that can increase
utilization ratio of vehicle and relieve traffic pressure in cities. Some studies on the ride-
sharing ride hailing only provide ride-sharing services for passengers from the same
starting points, different ending points or different starting points and the same destina-
tion [38–40]. However, the meeting points are not specified in this paper, which can carry
out ride-sharing services for passengers at different starting and ending points, so as to
save passengers’ travel time and cost and meet the needs of more passengers.
In most cases, the ride hailing ride-sharing only aims to achieve the system optimiza-
tion, seeking to minimize vehicle mileage, passenger travel time, maximize the number of
passengers, etc. [14,19]. However, detour is a common phenomenon of ride-sharing vehi-
cles in reality, so only when the system is optimized, it will be unfair to some passengers. In
this paper, detour ratio is defined, and the system is constrained by the detour ratio, taking
into account the benefit of each passenger, so that the system can achieve the optimal, while
taking into account the fairness of users, and make the sharing route more reasonable.
Regarding pricing, the research on ride-sharing considers different travel costs that
are roughly proportional to vehicle-miles [38]. Some studies propose a cost sharing
model [26,32,38]. However, these cost models ignore the cost of the detour. In this paper,
based on the principle of user fairness, the detour ratio is used to limit the detour distance
of the sub-path, and combined with the detour discount rate, the taxi fare is constrained,
so that the longer the detour distance of the ride-sharing sub-path is, the more the cost
compensation can be obtained. In addition, both the driver’s income and the passenger’s
cost are considered in this paper, which ensures that the driver’s income is higher than that
of the traditional non-ride-sharing mode, and the passenger’s cost is less than that of the
traditional non-ride-sharing mode.
In the existing study of the ride-sharing ride hailing problem [30], the constraint with
time window is added, but the hard time window limit used in some studies does not
consider the time of both the driver and the passenger. Different from the limitation of
hard time window, the soft time window is set in the ride-sharing ride hailing mode in
this paper, which takes into account the time of drivers and passengers, and provides
more space for the global route planning. There is also a ride-sharing model with soft
time window [40,41], but on this basis, a more comprehensive consideration is given and a
penalty function is set. When passengers need to wait for taxi arrival, the loss of this part
will be borne by taxi drivers.
In order to solve the problem of ride hailing ride-sharing, single objective optimization,
multi-objective optimization and other models are proposed. In order to find the optimal
route for solving these models, various heuristic algorithms and exact algorithms are
developed and used [16,42,43]. In this paper, both Genetic Algorithm and branch and
bound algorithm are adopted, and the two algorithms are compared to verify the feasibility
of the model. The Genetic Algorithm with short running time is adopted to meet the
demand of real-time taxi scheduling.Sustainability 2021, 13, 902 15 of 17
7. Conclusions
This paper studies the optimization problem of ride-sharing route for ride hailing, which
aims at the model establishment and rate optimization of ride hailing route, and designs a
solution algorithm based on Genetic Algorithm. The main conclusions are as follows:
The optimization model of the ride-sharing route for ride hailing is constructed, and
the objective function is established with the shortest ride-sharing route of the ride hailing
service system. The passenger capacity, the rationality of the route, the soft time window,
and the cost benefit are considered as constraints, considering both system optimization
and user fairness, which realize the purpose of ride-sharing route optimization.
The optimization model solving algorithm based on Genetic Algorithm is designed
to search for a global approximate optimal solution with fewer iterations, and it has high
consistency with the true solution. Compared with the exact algorithm, it greatly reduces
the operation time, and it is found that the numerical value fluctuates little after running
many times, which proves that the effectiveness and stability of Genetic Algorithm, and
meets the needs of on-demand carpooling service, matching passengers, and making timely
decisions on vehicle route planning.
Through the comparison of the driver’s income, passenger cost, and the number of
vehicles used between ride-sharing and non-ride-sharing of online ride hailing, it can be
seen that the ride-sharing scheme has great advantages in saving taxi resources, reducing
the cost of ride-sharing passengers, and improving the earnings of taxi drivers, which
promotes the sustainable economic development of the taxi market. At the same time, the
implementation of ride-sharing mode can save energy and reduce emissions, and promote
ecological sustainability.
Due to the limitation of survey resources and research conditions, the scale of the road
network and the scale of ride-sharing demand in the case study are both small, and the
passenger time window condition is an assumed parameter. Nevertheless, the general
rules of theoretical modeling and algorithm design in this study can still be used as a
good reference. The results have important theoretical value and practical significance
for the application and development of the combined route optimization problem, the
improvement of intelligent level of urban taxi traffic, and the development and promotion
of urban traffic sustainability.
Author Contributions: Conceptualization, Y.C., S.W. and J.L.; methodology, Y.C., S.W. and J.L.;
software, J.L.; investigation, Y.C.; validation, Y.C., S.W. and J.L.; visualization, Y.C. and S.W.; writing—
original draft preparation, Y.C., S.W. and J.L. All authors have read and agreed to the published
version of the manuscript.
Funding: This research was supported by the National Natural Science Foundation of China (grant
No. 11702049), the Liao Ning Revitalization Talents Program (grant No.XLYC1807236), Scientific Re-
search Funding Project of Liaoning Provincial Education Department in 2020(grant No. JDL2020017)
and the Natural Science Foundation of Liao Ning Province (grant No. 20180550024).
Institutional Review Board Statement: Not applicable.
Informed Consent Statement: Not applicable.
Data Availability Statement: Not applicable.
Acknowledgments: We appreciate that nine postgraduates from the university of the first author
have investigated and collected traffic data. We are also grateful to the editors and anonymous
reviewers for their suggestions and comments.
Conflicts of Interest: The authors declare no conflict of interest.
References
1. Furuhata, M.; Dessouky, M.; Ordóñez, F.; Brunet, M.E.; Wang, X.Q.; Koenig, S. Ridesharing: The state-of-the-art and future
directions. Transp. Res. Part B Methodol. 2013, 57, 28–46. [CrossRef]
2. Bian, Z.Y.; Liu, X.; Bai, Y. Mechanism design for on-demand first-mile ridesharing. Transp. Res. Part B 2020, 138, 77–117. [CrossRef]Sustainability 2021, 13, 902 16 of 17
3. Devaraj, A.; Ramakrishnan, G.A.; Nair, G.S.; Srinivasan, K.K.; Bhat, C.R.; Pinjari, A.R.; Ramadurai, G.; Pendyala, R.M. Joint Model
of Application-Based Ride Hailing Adoption, Intensity of Use, and Intermediate Public Transport Consideration among Workers
in Chennai City. Transp. Res. Rec. 2020, 2674, 152–164. [CrossRef]
4. Bi, J.; Zhi, R.; Xie, D.F.; Zhao, X.M.; Zhang, J. Capturing the Characteristics of Car-Sharing Users: Data-Driven Analysis and
Prediction Based on Classification. J. Adv. Transp. 2020, 2020, 1–11. [CrossRef]
5. Altshuler, T.; Altshuler, Y.; Katoshevski, R.; Shiftan, Y. Modeling and Prediction of Ride-Sharing Utilization Dynamics. J. Adv.
Transp. 2019, 2019, 1–18. [CrossRef]
6. Lee, K.T.; Lin, D.J.; Wu, P.J. Planning and design of a taxipooling dispatching system. Transp. Res. Rec. 2005, 1903, 86–95. [CrossRef]
7. Chang, I.C.; Hung, S.N.; Yen, C.E. Designing a dynamic carpooling system integrated with the VANET-based route-planning
algorithm. J. Chin. Inst. Eng. 2019, 42, 132–142. [CrossRef]
8. Zhang, D.S.; He, T.; Zhang, F.; Lu, M.M.; Liu, Y.H.; Lee, H.; Son, S.H. Carpooling Service for Large-Scale Taxicab Networks. ACM
Trans. Sens. Netw. 2016, 12, 1–35. [CrossRef]
9. Daganzo, C.F.; Ouyang, Y.F. A general model of demand-responsive transportation services: From taxi to ridesharing to dial-a-ride.
Transp. Res. Part B Methodol. 2019, 126, 213–224. [CrossRef]
10. Shen, W.; Lopes, V.C.; Crandall, W.J. An online mechanism for ridesharing in autonomous mobility-on-demand systems. arXiv
2016, arXiv:1603.02208.
11. Amey, A.; Attanucci, J.; Mishalani, R. ‘Real-time’ ridesharing—the opportunities and challenges of utilizing mobile phone
technology to improve rideshare services. In Proceedings of the TRB Annual Meeting, Washington, DC, USA, 23–27 January 2011.
12. Zhou, H.P.; Zhong, B.Q.; Peng, X.H.; Xia, X. The route choice and rate optimization model of taxi pooling. J. Chang. Univ. Sci.
Technol. 2011, 8, 20–25.
13. Zhang, W.; He, R.C.; Chen, Y.; Gao, M.X.; Ma, C.X.; Luca, S. Research on Taxi Pricing Model and Optimization for Carpooling
Detour Problem. J. Adv. Transp. 2019, 2019, 1–11. [CrossRef]
14. Ma, C.X.; He, R.C.; Zhang, W. Path optimization of taxi carpooling. PLoS ONE 2018, 13, e0203221. [CrossRef] [PubMed]
15. Rathod, S.G.; Kawade, P.M.; Kakade, R.A.; Bikkad, S.S.; Gangtire, K.J. Carpooling using Genetic Algorithm. Int. J. Eng. Manag.
Res. 2016, 6, 127–129.
16. Cheikh-Graiet, S.B.; Dotoli, M.; Hammadi, S.A. Tabu Search based metaheuristic for dynamic carpooling optimization. Comput.
Ind. Eng. 2020, 140, 106217.1–106217.15. [CrossRef]
17. Zhao, T.L.; Yang, Y.J.; Wang, E. Minimizing the average arriving distance in carpooling. Int. J. Distrib. Sensor Netw. 2020, 16, 1–16.
[CrossRef]
18. Li, Y.Y.; Liu, Y.; Xie, J. A path-based equilibrium model for ridesharing matching. Transp. Res. Part B Methodol. 2020, 138, 373–405.
[CrossRef]
19. Tamannaei, M.; Irandoost, I. Carpooling problem: A new mathematical model, branch-and-bound, and heuristic beam search
algorithm. J. Intell. Transp. Syst. 2019, 23, 203–215. [CrossRef]
20. Long, J.C.; Tan, W.M.; Szeto, W.Y.; Li, Y. Ride-sharing with travel time uncertainty. Transp. Res. Part B Methodol. 2018, 118, 143–171.
[CrossRef]
21. Masoud, N.; Jayakrishnan, R. A real-time algorithm to solve the peer-to-peer ride-matching problem in a flexible ridesharing
system. Transp. Res. Part B Methodol. 2017, 106, 218–236. [CrossRef]
22. Filcek, G.; Hojda, M.; Jacek Żak, J. A heuristic algorithm for solving a Multiple Criteria Carpooling Optimization (MCCO)
problem. Transp. Res. Procedia 2017, 27, 656–663. [CrossRef]
23. Ma, T.Y. On-demand dynamic Bi-/multi-modal ride-sharing using optimal passenger-vehicle assignments. In Proceedings of the
IEEE International Conference on Environment & Electrical Engineering & IEEE Industrial & Commercial Power Systems Europe,
Milan, Italy, 6–9 June 2017.
24. Naoum-Sawaya, J.; Cogill, R.; Ghaddar, B.; Sajja, S.; Shorten, R.; Taheri, N.; Tommasi, P.; Verago, R.; Wirth, F. Stochastic
optimization approach for the car placement problem in ridesharing systems. Transp. Res. Part B Methodol. 2015, 80, 173–184.
[CrossRef]
25. Lee, A.; Savelsbergh, M. Dynamic ridesharing: Is there a role for dedicated drivers? Transp. Res. Part B Methodol. 2015, 81, 483–497.
[CrossRef]
26. Zhang, X.J.; Zhang, Q.R.; Yuan, Z.T.; Wang, C.H.; Zhang, L.J.; Stoican, F. The Research on Planning of Taxi Sharing Route and
Sharing Expenses. Math. Probl. Eng. 2020, 2020, 1–9. [CrossRef]
27. Ma, J.; Xu, M.; Meng, Q.; Cheng, L. Ridesharing user equilibrium problem under OD-based surge pricing strategy. Transp. Res.
Part B Methodol. 2020, 134, 1–24. [CrossRef]
28. Di, X.; Ma, R.; Liu, H.X.; Ban, X.G. A link-node reformulation of ridesharing user equilibrium with network design. Transp. Res.
Part B Methodol. 2018, 112, 230–255. [CrossRef]
29. Lei, C.; Jiang, Z.J.; Ouyang, Y.F. Path-based dynamic pricing for vehicle allocation in ridesharing systems with fully compliant
drivers. Transp. Res. Part B Methodol. 2020, 132, 60–75. [CrossRef]
30. Guo, R.G.; Guan, W.; Zhang, W.Y.; Meng, F.T.; Zhang, Z.X. Customized bus routing problem with time window restrictions:
Model and case study. Transp. A Transp. Sci. 2019, 15, 1804–1824. [CrossRef]
31. Li, X.; Wei, M.; Hu, J.; Yuan, Y.; Jiang, H.F.; Strelniker, Y. An Agent-Based Model for Dispatching Real-Time Demand-Responsive
Feeder Bus. Math. Probl. Eng. 2018, 2018, 1–11. [CrossRef]You can also read