Churn Prediction in Mobile Social Games: Towards a Complete Assessment Using Survival Ensembles - arXiv
←
→
Page content transcription
If your browser does not render page correctly, please read the page content below

Churn Prediction in Mobile Social Games:
                                                       Towards a Complete Assessment Using
                                                                Survival Ensembles
                                                                          África Periáñez, Alain Saas, Anna Guitart and Colin Magne
                                                                                             Game Data Science Department
                                                                                                      Silicon Studio
                                                                                        1-21-3 Ebisu Shibuya-ku, Tokyo, Japan
                                                                          {africa.perianez, alain.saas, anna.guitart, colin}@siliconstudio.co.jp
arXiv:1710.02264v1 [stat.ML] 6 Oct 2017

                                             Abstract—Reducing user attrition, i.e. churn, is a broad
                                          challenge faced by several industries. In mobile social games,
                                          decreasing churn is decisive to increase player retention and rise
                                          revenues. Churn prediction models allow to understand player
                                          loyalty and to anticipate when they will stop playing a game.
                                          Thanks to these predictions, several initiatives can be taken to
                                          retain those players who are more likely to churn.
                                             Survival analysis focuses on predicting the time of occurrence
                                          of a certain event, churn in our case. Classical methods, like
                                          regressions, could be applied only when all players have left the
                                          game. The challenge arises for datasets with incomplete churning
                                          information for all players, as most of them still connect to the
                                          game. This is called a censored data problem and is in the nature
                                          of churn. Censoring is commonly dealt with survival analysis
                                          techniques, but due to the inflexibility of the survival statistical
                                          algorithms, the accuracy achieved is often poor. In contrast, novel
                                          ensemble learning techniques, increasingly popular in a variety
                                          of scientific fields, provide high-class prediction results.
                                             In this work, we develop, for the first time in the social
                                          games domain, a survival ensemble model which provides a
                                          comprehensive analysis together with an accurate prediction of
                                          churn. For each player, we predict the probability of churning         Fig. 1. Screenshots of the game chosen to evaluate the churn models, Age
                                          as function of time, which permits to distinguish various levels       of Ishtaria. This game is representative of the successful F2P mobile social
                                          of loyalty profiles. Additionally, we assess the risk factors that     role-playing games in Japan. The left panel exhibits characteristic activity in
                                          explain the predicted player survival times. Our results show that     role-playing games, the right panel shows the usual F2P in-app purchases for
                                                                                                                 in-game content.
                                          churn prediction by survival ensembles significantly improves
                                          the accuracy and robustness of traditional analyses, like Cox
                                          regression.
                                             Index Terms—social games; churn prediction; ensemble meth-          [14] and can significantly exceed the cost of retaining existing
                                          ods; survival analysis; online games; user behavior                    ones.
                                                                                                                    This study is motivated by the idea that the ability to predict
                                                                 I. I NTRODUCTION                                when a player will leave a game allows to take incentive
                                             The economics of gaming has changed in the recent                   actions to re-engage her and prevent churn, or move her to
                                          years with the widespread adoption of social networks and              another game of the company.
                                          smartphones, leading to a new type of video games: social                 Churn prediction has been widely researched in the fields
                                          games. Social games target a new audience of players: casual           of telecom, finance, retail, pay TV and banking, as shown by
                                          gamers, with a new monetization model: free-to-play (F2P               the extensive literature review given by [55], [58]. It has also
                                          or freemium), which now largely dominates all the mobile               been studied in e-commerce [60], [61] and even in terms of
                                          platforms [2], [14]. The freemium model consists in offering           employee retention [51].
                                          a game for free, and monetizing it by charging for in-game                In the field of video games, pioneering studies were in-
                                          content through in-app purchases.                                      troduced in [29], [31]. However, they focus on MMORPG
                                             For social games, player retention is key for a successful          (Massively Multiplayer Online Role-Playing Games).
                                          monetization, and to increase the social interactions that in             MMORPG have been the first successful type of online
                                          turn help to drive the adoption of the game and retain players.        social games, however they targeted a narrower audience
                                          In addition, the cost of acquiring new players is ever increasing      and they are mainly using a subscription-based monetization
model. This implies the possibility to measure churn as a for-    and, moreover, the features are limited to provide static (non-
mal termination of contract, similarly to the sectors mentioned   temporal) information.
above, at the exception of e-commerce.                               In order to model the time until churn, traditional methods
   Free-To-Play (F2P) monetization, which is the main model       like regressions would be appropriate only when all players
used by mobile social games, involves a non-contractual           have stopped playing the game. The challenge arises for data
relationship. In this context, churn is not clearly determined    which contains incomplete information about every users, as
by an explicit statement ending a contract. For the most          some of them still play the game.
active players, we can define churn as a prolonged period            The present work improves previous studies [19], [48]
of inactivity. However, the problem slightly differs from the     using an adequate technique that assimilates censored data
churn in e-commerce. It is indeed always possible for inactive    (observations with incomplete information about churn time)
users to come back to an e-commerce website, while inactive       [34] and that captures the temporal dimension of the churn
mobile players can uninstall a game, which would correspond       prediction challenge.
to a well defined and definitive state of churn. However,            Our model based on survival ensembles outputs accurate
this information is normally not available. The definition of     predictions of when players churn, and provides information
churn in non-contractual settings has been discussed in [10].     about the risk factors that affect the exit of players as well.
A comprehensive discussion on the definition of churn for         Additionally, the approach suggested in this paper not only
F2P applications is beyond the scope of this paper, and is the    gives us a list of possible churners, but also produces, for
subject of dedicated studies [10].                                every player, a survival probability function that will let us
   The work presented in [19] is the first study investigating    know how the probability of churning is varying as a function
churn prediction in F2P games. [19] introduces a general          of time. This feature lets us distinguish various levels of loyalty
definition of the problem, a selection of game content            profiles, upcoming, near-future and far-future churners, and the
independent features and a comparison of classifiers. A           variables that influence this survival behavior (considering that
second study shown in [48] focuses on the churn prediction        a player is alive as long as she connects to the social game).
of high value players in F2P games. [48] investigates in             From this survival function, the median survival time is
detail the problem definition and classifier evaluation, though   extracted and used as a life expectancy threshold. This feature
it approaches the problem only from a binary classification       lets us label players as being at risk of churning, take action
point of view. It uses an algorithm that assumes a distribution   beforehand to retain valuable players, and ultimately improve
of data that normally does not fit with the common shape of       game development to enhance player satisfaction.
the churn data. Going further, [49] and [47] try to address the      To the best of our knowledge, we are the first to thoroughly
temporality of the data for churn prediction in mobile games.     model the prediction of churn by using a survival ensemble
                                                                  approach in the social games sector. Our model improves
   The work presented in this paper focuses on predicting         the accuracy, robustness and flexibility of traditional survival
churn for high value players who are commonly called whales       methods, like Cox regression, and has been developed with the
in the video game industry. A motivation for this focus is        goal of being usable in an operational business environment.
that whales behave differently than average players, including
                                                                               II. S URVIVAL E NSEMBLE M ODELS
in terms of survival curve as we can see in Fig. 2. Since they
are often the most active players, i.e. they play nearly every    A. Survival Analysis
day, we can easily define their churn as a prolonged period          Survival analysis consists of a set of statistical techniques
of inactivity. Their high level of engagement also allows         traditionally used to predict lifetime expectancy of individuals
to collect more data about their activity and makes them          in medical and biological research [15], [26], [35]. This group
more likely to answer positively to actions taken in order        of methods have also been applied in several industries to
to prevent their churn. Finally, from a business perspective,     predict customer attrition, mainly in telecommunication [36],
whales, who represent about 0.15% of the players, or 10%          banking [54] and insurance [16].
of the paying users [28], are particularly important since they      Survival analysis focuses on studying the time until an event
are the top spenders who account for 50% of the in-app            of interest happens and its relationship with different factors.
purchases revenues.                                               Originally in medical research, an event is the failure or death
                                                                  of an individual, however in our case it is the moment when
  The game chosen for this study, Age of Ishtaria developed       a player leaves the game. The time-to-event outcome is also
by Silicon Studio, is representative of the successful mobile     known as survival time.
social games and has several million players worldwide.              A fundamental characteristic of survival analysis is that data
                                                                  are censored. Censoring indicates that observations do not
A. Our contribution                                               include complete information about the occurrence of the event
   Classical approaches to churn study the problem as a binary    of interest. It means that for a certain number of players, we do
classification: whether or not the player connects again to the   not know the time of event experience (because they did not
game (e.g. [3]). Although the binary models are very intuitive,   experience it yet), i.e. measurements only contain information
they are not able to predict when the player will stop playing    if the event occurs or not before a given time t.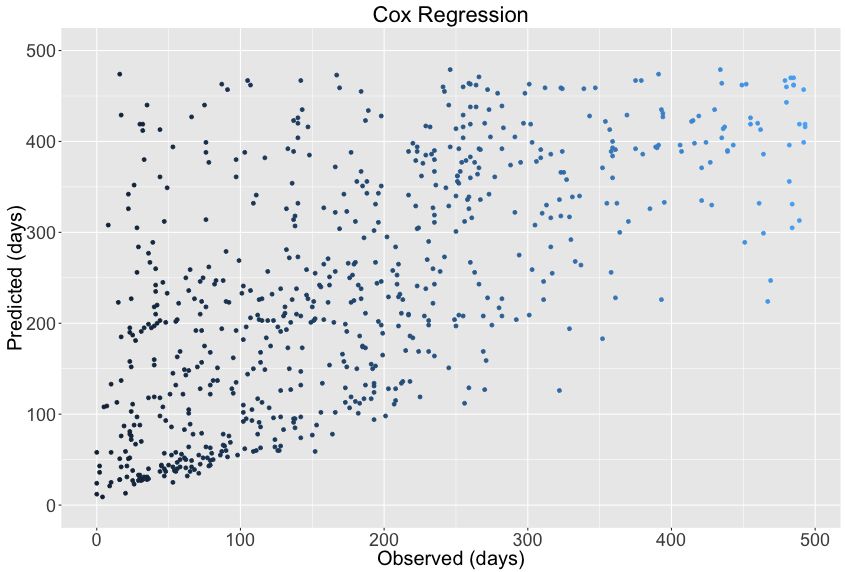
The survival function S(t), which is simply the likelihood            In the parametric approaches, like the accelerated failure
that a player will survive at a certain time t, can be es-            time models [38], the type of the distribution is previously
timated through the non-parametric Kaplan-Meier estimator             determined (e.g. Weibull, lognormal, exponential). Though,
[30], where the churn probability can be computed directly            these methods are suboptimal because it is uncommon that
from recorded censored survival times.                                the data follow these specific distribution shapes.
   If k players churn during the period of time T of study               In the present paper, we address the drawbacks mentioned
at different instants t1 < t2 < t3 . . . < tk and, as churn           above by applying machine learning algorithms to censored
occurrences are supposed to be independent of each other [9],         data problems.
the probabilities of surviving in the game from one time to
the next can be multiplied to obtain the cumulative survival          B. Survival Trees and Ensembles
probability:
                                        dj
                                                                        1) Decision Trees: Originally presented in [41], decision
                  S(tj ) = S(tj−1 ) 1 −                    (1)        trees became popular in the 1980s, when the most relevant
                                        nj
                                                                      algorithms for Classification and Regression Trees (CART)
where S(0) = 1, with nj being the number of players alive             were introduced by [7], [44], [50].
before tj , and dj being the number of events at tj . We will         Classification and regression trees are non-parametric tech-
get as a result a step function that changes its value at the time    niques where the basic idea is to split the feature space recur-
of each churn.                                                        sively, to group subjects with homogeneous characteristics and
   Further analysis on this topic includes the presence of            to separate those with bigger differences based on the outcome
competing risks [43]. They belong to a special class of time-         of concern. In order to perform the nodes classification and
to-event models where there is more than one possible failure         maximize homogeneity within the nodes, a measure called
event. These alternative events can prevent the observation of        impurity must be minimized. Common examples of impurity
the main event of interest. In this study, we focus on the loss of    measure are cross-entropy or sum of squared errors. For
interest in a game, which is the main cause of churn. However,        example, considering a binary split and given a continuous
it can happen that a player stops playing the game because she        variable X, the split can be performed if X ≤ d is fulfilled,
loses her phone, or dies, which are considered as competing           with d being a constant.
risks events.                                                            2) Survival trees: Survival trees are constructed as a set of
   Additional semi-parametric survival techniques, like the           binary trees that grow by recursive partitioning of the sample
renowned regression method for censored observations, the             space χ, where the qi tree nodes are subspaces of χ. The
Cox proportional-hazards model [11]–[13], or parametric               tree splitting starts in the root node, which concentrates all
methods (e.g. accelerated failure time models [38]), are valu-        the data. Based on a survival statistical criterion, such as
able tools to investigate the impact of multiple covariates. The      the cumulative hazard function or Kaplan-Meier estimates,
covariates or predictors are expected to be correlated with the       the root node is then divided into two daughter nodes. The
player’s reason for quitting the game.                                principle for partitioning these two branches is to maximize the
   Following Cox proportional-hazards model, the estimated            survival difference between two groups of individuals, which
hazard for k individual players and p covariate vectors xk            are compressed in the two daughter nodes, maximizing the
takes the form                                                        homogeneity among nodes, based on survival experience.
                                                                        The first idea of using tree-based methods for censored data
          hk (t) = h0 (t) exp β1 xk,1 + . . . + βp xk,p ,       (2)
                                                                      was initially introduced in [8] and [37]. The first survival
where the hazard function hk (t) is dependent on the baseline         tree as we know was presented in [17], where a Kaplan-
hazard h0 (t) and the features βp xk,p . The Cox regression is        Meier estimator survival function was computed at every node
not assumed to follow a particular statistical distribution. It is    as a discrepancy measure using Wasserstein metrics. For a
fitted based on the data and it solves the censoring problem          comprehensive review about different types of survival trees,
by maximizing the partial likelihood.                                 check [4].
    The Cox model and its extensions [56] allow regressions to           The best split is achieved by exploring all combinations,
work with censored data, and they permit an intuitive interpre-       considering all the xi predictor variables and all the possible
tation of the impact of the features. However, these techniques       splits, in order to maximize the survival difference. This
assume a fixed link between the output and the variables              way, subjects with similar survival characteristics are grouped
(assuming them additive and constant over time). This requires        together. As long as the tree grows, the difference between
an explicit specification of the relationship by the researcher,      branches increases, and individuals are gathered in nodes with
and involves important efforts in terms of model selection            more homogeneous groups in terms of survival behavior.
and evaluation. In spite of their semi-parametric nature, these          Despite being a powerful classification tool which is able
models present difficulties to scale with big data problems,          to model censored data, employing a single tree can produce
and alternative regularized versions of Cox regression [39]           instability in its predictions. It means that if small changes
have been proposed to amend this. Nevertheless, they are still        in data arise, the prediction can differ among computations
based on restrictive assumptions that are not easy to fulfill.        (the divergences are mainly related with the prediction of risk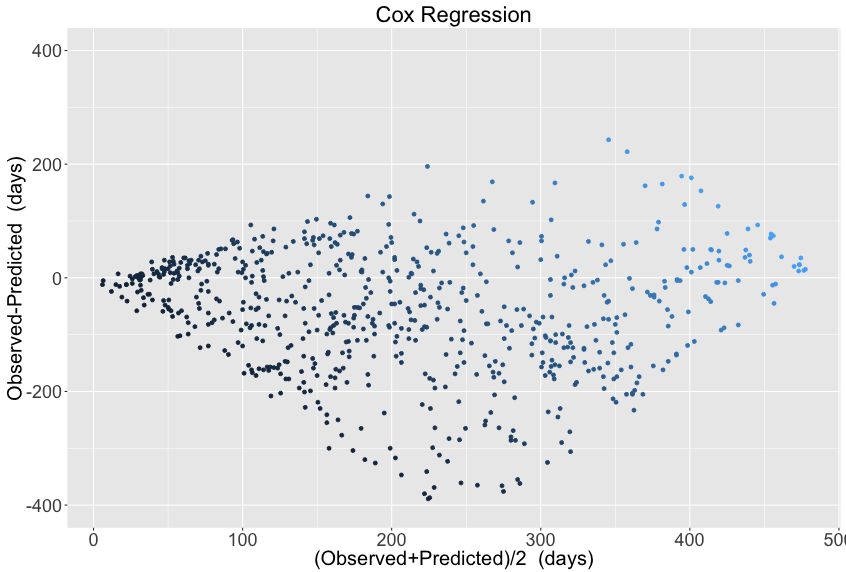
factors) [33]. This drawback will be fixed if we execute an             Additionally, we want to implement our model in a data sci-
ensemble of them, instead of using one single tree.                  ence product running in an operational business environment.
   3) Survival ensembles: Using an ensemble of models,               Thus, the feature selection takes into account limitations in
instead of a single one, is an accurate prediction tool firstly      terms of memory and processing capabilities that might not
suggested by [5], [6] with the well-known random forest. En-         be considered in a pure research environment.
sembles of tree-based models achieve outstanding predictions            • Player attention: the time component of the player ac-
in real-world applications [62].                                          cessing the game.
   Survival forests are ensemble-based learning methods where               – Time spent per day in the game, including averages
the underlying algorithm is a kind of survival tree. A survival                over the first weeks and moving average over the last
ensemble lies in growing a set of survival trees, instead of a                 weeks.
single one. The two main survival ensemble techniques are                   – Lifetime: number of days since registration until
random survival forest, presented in [27], and conditional                     churn, in case the player churns.
inference survival ensembles, developed by [24], based on
                                                                        • Player loyalty: the frequency of the player access to the
their previous work introduced in [21], [25].
                                                                          game.
   The conditional inference survival ensembles is the method
chosen for the predictions shown in Section III. The condi-                 – Number of days with at least one playing session.
tional inference survival ensemble technique uses a weighted                – Loyalty index: ratio of number of days played,
Kaplan-Meier function based on the measurements used for                       divided by lifetime.
the training. The ensemble survival function [40] can be                    – Days from registration to first purchase.
summarized by                                                               – Days since last purchase.
                                      PN                                • Playing intensity: the quality of the playing sessions, i.e.
                               Y            Tn (dt, xi )

                                                                          how a player interacts with the game.
       S conditional (t|xi ) =    1 − Pn=1
                                         N
                                                            (3)
                                         n=1 Qn (t, xi )                    – Number of actions.
                                                                            – Number of sessions.
where n indicates the number of trees within the ensembles,
                                                                            – Number and amount of in-app purchases.
with n = 1, · · · , N , and xi being the covariates. Therefore, in
                                                                            – Action activity distance: Euclidean distance between
the node where xi is located, Tn accounts for the uncensored
                                                                               the average number of actions over the lifetime and
events until time t, and Qn counts the number of individuals
                                                                               the average number of actions over the last days.
at risk at time t. Moreover, conditional inference survival
                                                                        • Player level: the value of this variable and its evolution
ensembles introduces additional weight to the nodes where
there are more subjects at risk. It uses linear rank statistics as        depends on the game. However, the concept of level is
splitting criterion to grow the trees.                                    present and measurable in the majority of games, and
   In contrast, random survival forests [27] are based on                 can be then considered as a game-independent predictor
Nelson-Aalen estimates (instead of using Kaplan-Meier esti-               that can be used in our model and applied to most other
mates). The maximum of the log-rank statistical test is used              mobile social games.
in every node as split criterion, which leads to biased results         We investigated some game-dependent features, that we
in favor of covariates with many splits.                             ultimately did not keep in our model, such as:
   Conditional inference survival ensembles is a promising              • Participation in a guild. Guild is a social feature, some-
approach to deal with the censoring nature of churn prediction.           times called union or clan, specific to some social games,
It is a flexible method compared to the traditional statistical           allowing to play in collaboration with other players. This
Cox regression model and it solves the instability that is                predictor turned to be inapplicable to our problem as
present in survival trees. In the selected method for the churn           the whales, who are the focus of this study, have an
study, overfit is not present in its estimates and provides robust        homogeneous behavior in terms of participation to the
information about the variable importance. This fixes the                 social features of the game.
random survival forest problem [59] of being biased towards             • Measure of number of actions by category (shop, battle,
predictors with many splits or missing data.                              mission, ...). This is specific to the game studied. Though,
                                                                          it does not bring more relevant information than the
                         III. DATASET                                     higher-level and game-independent measure of the total
   We collected data from a major mobile social game between              number of actions.
October 2014 and February 2016. Several churn predictors or                                 IV. M ODELING
risk factors were investigated.
   We investigated mainly game-independent features, i.e. fea-       A. Churn definition
tures that are not related to the game mechanics and can                As it was explained in Section I, the definition of churn in
be measured in any game. This allows us to build a game-             F2P games is not straightforward. In this study, we consider
independent churn prediction model that can be applied to            that a player has churned if she does not connect to the game
other games.                                                         for 10 consecutive days. Our measurements confirm that the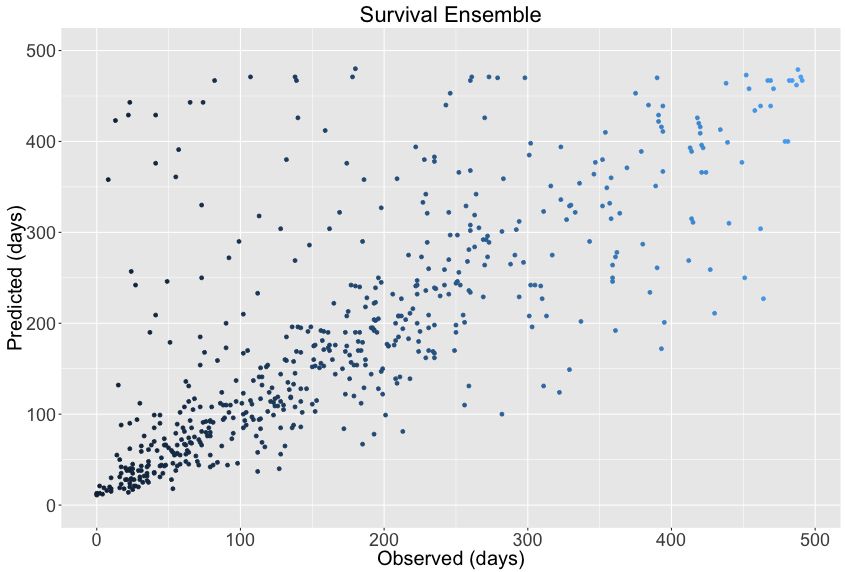
the first day they connected to the game. This contrasts with
                                                                                    the 20% churn rate of the whales after 100 days.

                                                                                    C. Churn model as a censored data problem
                                                                                       In the present work, the authors propose conditional infer-
                                                                                    ence survival ensembles [24] to model game churn.
                                                                                       Survival ensembles with 1000 conditional inference trees
                                                                                    are used as a base learner to predict the exit time of whales
                                                                                    from the game. Fig. 3 shows how conditional inference trees
                                                                                    work. It illustrates a simple partition with two terminal nodes.
                                                                                    In each terminal node, a Kaplan-Meier survival curve repre-
                                                                                    sents the group of players included in the node classification.
                                                                                    In this example we can observe the differences between the
                                                                                    survival profiles that characterize every node. In Fig. 3, the
                                                                                    root node variable is the last level the player reached in the
                                                                                    game. Two daughter nodes partitions grow from it: one also
                                                                                    based on the level and another based on the number of days
Fig. 2. Cumulative survival probability (Kaplan-Meier estimates) as a function      since the player did the last in-app purchase daysLastPurchase.
of time, in days. The whole dataset is considered, and the results are stratified      The overall survival time is the outcome of this model. Fig.
by whales (high-value players), paying users, and non-paying users.
                                                                                    4 summarizes the most significant predictors included in the
                                                                                    survival ensemble model for right-censored observations. The
whales who went through a period of 10 days of inactivity                           variable importance is computed using the integrated Brier
become mostly inactive: they either permanently exit the game                       score (IBS) [18], and the feature selection is performed based
or their activity becomes neglectable. Indeed the purchase                          on it. Other survival ensemble methods, like [27], are not as
activity of whales after coming back to the game following                          robust as the technique employed in this work [24] in terms
a period of 10 days of inactivity represents only 1.4% of the                       of variable selection and therefore in terms of computation
revenues generated by this category of players.                                     of variable importance. The variable importance is normally
   Traditional churn analysis focuses on predicting whether or                      biased in favor of the predictors with many splits. Conditional
not a user is going to exit the game, i.e. the response is a                        inference survival ensembles are constructed based on unbi-
binary variable: yes or no. However, with this approach, we                         ased trees, avoiding this problem [23].
do not know when a player is going to stop connecting to the                           The resulting prediction of this model contains, for each
game. Conventional churn prediction is solved from a static                         player, a survival function indicating the probability of churn
point of view, a binary classification problem.                                     as a function of time since the registration in the game. Fig. 5
   Our work focuses on when churn will happen. We model the                         illustrates a sample of four Kaplan-Meier survival functions for
churn behavior from the perspective of survival analysis, and                       four new players. In Fig. 5, we can observe the probability of
we treat the prediction of churners as a censored data problem                      churn for every single player (y-axis) as a function of time in
where the outcome of our model is the continuous time - the                         days (x-axis). In this example, we distinguish different player
time-to-exit the game. We have used the algorithm of survival                       profiles and survival behaviors:
ensembles within the conditional inference framework from                             •   The two first plots starting from the left show the survival
[24], presented in Section II-B3. This study uses a learning                              probability curves of two players who are going to churn
sample of n = 2500 whales.                                                                soon.
B. Kaplan-Meier estimates                                                             •   The third plot starting from the left shows the survival
   We visualize the churn problem by plotting Kaplan-Meier                                probability curve of a player who is expected to churn
(K-M) survival curves stratified by whales, normal paying                                 but not in the near future.
users, and non-paying users. In order to perform the K-M                              •   The last plot starting from the left shows the survival
survival analysis, we take a sample of 1.500.000 players.                                 probability curve of a very loyal player.
   Fig. 2 provides a graphical representation of the K-M sur-                       For every player, a different survival function will be computed
vival curves for different kind of players based on their paying                    as a result of our model.
behavior, distinguishing among whales (high-value players),                           Fig. 5 highlights the capability of our model to classify
paying users, and non-paying users. Fig. 2 shows different                          and predict loyalty for every player, taking into account the
survival patterns for each group. The estimated survival for                        temporal dimension. Additionally, the median survival time,
non-paying users is much lower than the one of paying                               which is the time when the percentage of surviving in the
users (including both whales and non-whales paying users).                          game is 50%, is used as a time threshold to categorize a player
Approximately 80% of the non-playing players have churned                           as being at risk of churning.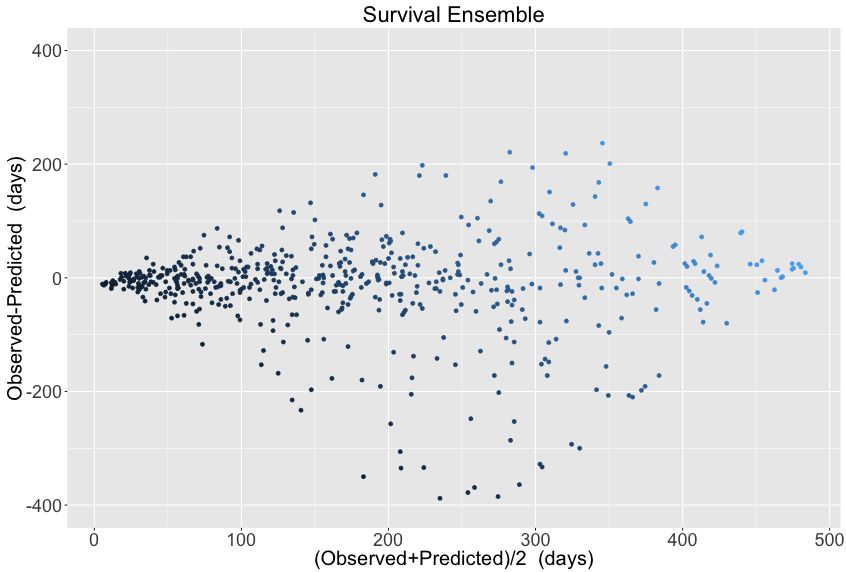
Fig. 3. Conditional inference survival tree partition with the estimated Kaplan-Meier survival curve. The K-M estimates represent the survival probability (in
days), which characterizes the players placed in every terminal node.

                                                                                   regression (using the same predictors). The conditional infer-
                                                                                   ence survival ensemble model exhibits a reasonable agreement
                                                                                   between measured and predicted survival times, both in the
                                                                                   scatterplot and the mean-difference plot evaluation. We can
                                                                                   observe in the lower plots that Cox regression performs worse
                                                                                   than the ensemble model in terms of predictive ability. As
                                                                                   it can be observed in Fig. 7, there is a higher concentration
                                                                                   of data at the beginning of the study. This is due to the fact
                                                                                   that we work with censored data and do not follow a normal
                                                                                   distribution. Hence, the longer the time of study grows, the less
                                                                                   information we have, as there are many whales who have not
                                                                                   experienced the event yet because they are still connecting to
                                                                                   the game. This evidence is reflected in the cumulative survival
                                                                                   distribution for whales shown in Fig. 2. Thus, as long as the
                                                                                   censoring rate grows, the prediction capability diminishes.
                                                                                      Fig. 6 depicts the cumulative prediction error curve for
                                                                                   the survival ensemble and the Cox regression model. The
                                                                                   integrated Brier score is an evaluation measure developed for
Fig. 4. Variable importance (relative ranking of significant factors) to predict
                                                                                   survival analysis [18], [40]. We use it to establish the summary
time-to-churn with conditional inference survival ensemble model in the upper      of the error estimation for the two survival-time analysis
panel, and for the binary output in the lower panel.                               outputs. The error evaluation has been performed based on
                                                                                   bootstrap cross-validation with replacement. This technique
                                                                                   estimates the prediction error splitting the measurements in
D. Model validation                                                                many bootstrap training and test samples. Then, the models
   Because of the nature of censoring, the standard methods                        are trained and tested with multiple sets of bootstrap samples.
of visualizing and evaluating prediction performances are not                      Fig. 6 exhibits the bootstrap cross-validated prediction error
suitable [40]. Fig. 7 shows the fit of the proposed conditional                    curves for 1000 samples.
inference survival ensemble method and the selected Cox                              Fig. 6 basically supports what Fig. 7 shows, as the
Fig. 5. Predicted Kaplan-Meier survival curves as a function of time (days) for new players. Predictions performed with conditional inference models for
survival ensembles.
significant, i.e. p-value ≤ 0.05 . We obtain the following
values: t = 3.56 and p = 0.00039.
V. C OMPARISON WITH OTHER MODEL APPROACHES
We include in this section a binary classification model of
churners. Although we think that modeling churn as a censor-
ing problem is the adequate approach, the binary prediction
perspective also brings us interesting information. The binary
response model provides useful insight for a very short-term
prediction. It is easy to interpret and to implement.
Although we use the same algorithm of conditional in-
ference ensembles, the outcome differs. A binary variable
denoting if a player churns or not is the response of the
classification model, i.e. yes or no. We trained the binary
model with several sets of features to obtain the final list
of attributes shown in Fig. 4. We highlight the contrasting
results obtained during the evaluation of the variable impact
Fig. 6. 1000 bootstrap cross-validation error curves for the survival ensemble between the survival model and the binary classification. It
model and Cox regression. reflects the nature of different ways of modeling and therefore
of the prediction results.
TABLE I A comparison study with other binary classification methods
P REDICTION ERROR SCORE FOR THE SURVIVAL MODELS WITH was performed in order to support the results obtained with
I NTEGRATED B RIER SCORE (IBS) the binary approach of the churn analysis. For this study, we
Model IBS
select several algorithms as binary classificators: SVM, naive
Survival Ensemble 0.158 bayesian classifier and a decision tree. A detailed and complete
Cox regression 0.169 explanation about the techniques used here can be found in
Kaplan-Meier 0.199
[20].
The fit of the ensemble is summarized in Table II, where
we compare our results with other classification methods. It
ensemble-based approach improves accuracy over the Cox indicates a good agreement between observed and predicted
model, cf. Table I. The prediction error function reaches the churners with an AUC (area under ROC curve) of 0.96.
maximum at the median survival time of 304 days and 306 Although the other techniques also perform very accurately,
days, for the Cox regression (error value of 0.21) and ensemble they possess some drawbacks. SVM also have a high score in
model (error value of 0.20), respectively. terms of AUC, but they are considered as black boxes because
Additional validation tests have been performed to compare it requires significant effort to extract the relationship between
the accuracy of the two models. A paired t-test (Welch Two the input variables and the output [32].
Sample t-test) [42] is used to estimate whether the prediction The techniques applied above are powerful tools to solve
ability of a model is statistically significant from another. The regression or classification problems. However, in their origi-
t-test has been performed using a confidence interval of 95%. nal, form they cannot handle the assimilation of information
According to the t-test, survival ensemble model is statistically from censored data. Hence, in order to apply these methodsFig. 7. Scatterplot (left) and mean-difference plot (right) of observations and predictions of median survival times. The dark blue dots correspond to shorter
lifetimes (in days) of players, soft blue dots reflect players with longer lifetimes. Upper panel evaluates the survival ensemble results, and lower panel compares
the Cox regression analysis.
TABLE II We look for a method that is able to make predictions in an
AUC ( AREA UNDER ROC CURVE ) PERFORMANCE OF DIFFERENT BINARY operational business environment and that easily adapts to dif-
CLASSIFICATION ALGORITHMS
ferent kinds of games, players, and therefore distribution of the
Model AUC data. This is the main motivation: we need a flexible technique
Survival Ensemble 0.960 that does not require a previous manipulation of the data and
Support Vector Machines 0.940
Naive Bayesian 0.900 that is able to deal efficiently with the temporal dimension of
Decision Tree 0.934 the churn prediction problem. Conditional inference survival
ensembles were evaluated to this purpose and compared with
traditional survival methods like Cox regression.
for survival analysis responses, an adequate modification of Conditional inference survival ensembles provided more
the algorithm or a proper transformation of the data must be accurate and more stable prediction results than traditional
performed beforehand. approaches. The proposed method is unbiased, does not overfit
[24], and provides us with robust information about the risk
VI. S UMMARY AND C ONCLUSION factors that influence players to abandon the game.
The predictions we have obtained provide the business users
The focus of this research is to find an appropriate technique and game developers with useful and easy-to-interpret player
to model player churn, which has been an open problem within information. The results directly impact the game business,
the community. Furthermore, this work presents steps towards improving the knowledge about whales behavior, discovering
the challenging goal of understanding the most valuable play- new playing patterns as a function of time, and classifying
ers in social games. social gamers by risk factors of churn.
The authors propose the application of a state-of-the-art Further on-going work in this direction is the improvement
algorithm: conditional inference survival ensembles [24], to of the accuracy in the prediction of the time-to-churn for
predict the time-to-churn and the survival probability of play- players who stay longer in the game. To achieve this, we
ers in social games in terms of game lifetime. will continue researching significant features to discover newplaying patterns. A promising direction would be to study [23] T. Hothorn, K. Hornik, C. Strobl, A. Zeileis, and M. T. Hothorn. Package
predictors based on more complex measures of the social ’party’. Package Reference Manual for Party Version 0.9-998, 16:37,
2015.
activity than the one used in this study. [24] T. Hothorn, K. Hornik, and A. Zeileis. Unbiased recursive partitioning:
A conditional inference framework. Journal of Computational and
VII. S OFTWARE Graphical Statistics, 15(3):651–674, 2006.
[25] T. Hothorn, B. Lausen, A. Benner, and M. Radespiel-Tröger. Bagging
All the analysis were performed with R version 3.1.2 survival trees. Statistics in medicine, 23(1):77–91, 2004.
for Linux, using the following packages from CRAN: party [26] P. Hougaard. Fundamentals of survival data. Biometrics, 55(1):13–22,
1999.
version 1.0 [22], [23], survival version 2.38 [57], ROCR 1.0 [27] H. Ishwaran, U. B. Kogalur, E. H. Blackstone, and M. S. Lauer. Random
[52], [53], Core Learn version 1.47 [45], [46] and cvTools survival forests. The annals of applied statistics, pages 841–860, 2008.
version 0.3.2 [1]. [28] E. Johnson. A long tail of whales: Half of mobile games money comes
from 0.15 percent of players, 2014. http://recode.net/2014/02/26/a-long-
ACKNOWLEDGEMENTS tail-of-whales-half-of-mobile-games-money-comes-from-0-15-percent-
of-players.
We thank our colleague Sovannrith Lay for helping us to [29] D. G. Jun Ding and X. Chen. Alone in the game: Dynamic spread
collect the data and his support during this study. We also of churn behavior in a large social network a longitudinal study in
thank Thanh Tra Phan for the careful review of the article. MMORPG. falta, 24(2):123–140, 1996.
[30] E. L. Kaplan and P. Meier. Nonparametric estimation from incom-
R EFERENCES plete observations. Journal of the American Statistical Association,
53(282):457–481, 1958.
[1] A. Alfons. cvTools: Cross-validation tools for regression models. R [31] J. Kawale, A. Pal, and J. Srivastava. Churn prediction in MMORPGs:
package version 0.3, 2(5), 2012. A social influence based approach. In Computational Science and
[2] A. Annie. App annie and IDC mobile app advertising and monetization Engineering, 2009. CSE’09. International Conference on, volume 4,
trends, 2013. pages 423–428. IEEE, 2009.
[3] J. Banasik, J. N. Crook, and L. C. Thomas. Not if but when will [32] M. Kretowska. The influence of censoring for the performance of
borrowers default. Journal of the Operational Research Society, pages survival tree ensemble. Springer Berlin Heidelberg, pages 524–531,
1185–1190, 1999. 2010.
[4] I. Bou-Hamad, D. Larocque, H. Ben-Ameur, et al. A review of survival [33] M. Kretowska. Artificial Intelligence and Soft Computing: 13th Inter-
trees. Statistics Surveys, 5:44–71, 2011. national Conference, ICAISC 2014, Zakopane, Poland, June 1-5, 2014,
[5] L. Breiman. Bagging predictors. Machine learning, 24(2):123–140, Proceedings, Part I, chapter Comparison of Tree-Based Ensembles in
1996. Application to Censored Data, pages 551–560. Springer International
[6] L. Breiman. Random forests. Machine learning, 45(1):5–32, 2001. Publishing, Cham, 2014.
[7] L. Breiman, J. Friedman, C. J. Stone, and R. A. Olshen. Classification [34] S. Lagakos. General right censoring and its impact on the analysis of
and regression trees. CRC press, 1984. survival data. Biometrics, pages 139–156, 1979.
[8] A. Ciampi, R. Bush, M. Gospodarowicz, and J. Till. An approach to [35] J. Li and S. Ma. Survival analysis in medicine and genetics. CRC Press,
classifying prognostic factors related to survival experience for non- 2013.
hodgkin’s lymphoma patients: Based on a series of 982 patients: 1967– [36] J. Lu. Predicting customer churn in the telecommunications industry
1975. Cancer, 47(3):621–627, 1981. - An application of survival analysis modeling using SAS. SAS User
[9] L. S. A. D. Clark TG, Bradburn MJ. Survival analysis part i: Basic Group International (SUGI27) Online Proceedings, pages 114–27, 2002.
concepts and first analyses. British Journal of Cancer, 89(2):232–238, [37] E. Marubini, A. Morabito, and M. Valsecchi. Prognostic factors and risk
2003. groups: some results given by using an algorithm suitable for censored
[10] M. Clemente-Cı́scar, S. San Matı́as, and V. Giner-Bosch. A methodology survival data. Statistics in medicine, 2(2):295–303, 1983.
based on profitability criteria for defining the partial defection of
[38] E. Marubini and M. G. Valsecchi. Analysing survival data from clinical
customers in non-contractual settings. European Journal of Operational
trials and observational studies. Wiley-Interscience, 2004.
Research, 239(1):276–285, 2014.
[39] S. Mittal, D. Madigan, R. S. Burd, and M. A. Suchard. High-
[11] D. R. Cox. Regression Models and Life-Tables. Journal of the Royal
dimensional, massive sample-size cox proportional hazards regression
Statistical Society. Series B (Methodological), 34(2):187–220, 1972.
for survival analysis. Biostatistics, page kxt043, 2013.
[12] D. R. Cox and D. Oakes. Analysis of survival data, volume 21. CRC
Press, 1984. [40] U. B. Mogensen, H. Ishwaran, and T. A. Gerds. Evaluating random
[13] C. R. David. Regression models and life tables (with discussion). forests for survival analysis using prediction error curves. Journal of
Journal of the Royal Statistical Society, 34:187–220, 1972. statistical software, 50(11):1, 2012.
[14] T. Fields. Mobile and Social Game Design: Monetization Methods and [41] J. N. Morgan and J. A. Sonquist. Problems in the analysis of survey
Mechanics. CRC Press, 2 edition, 2014. data, and a proposal. Journal of the American statistical association,
[15] T. R. Fleming and D. Lin. Survival analysis in clinical trials: past 58(302):415–434, 1963.
developments and future directions. Biometrics, 56(4):971–983, 2000. [42] N. I. of Standards, T. (US), C. Croarkin, P. Tobias, and C. Zey.
[16] L. Fu and H. Wang. Estimating insurance attrition using survival Engineering statistics handbook. The Institute, 2001.
analysis. Table of, page 55. [43] R. L. Prentice, J. D. Kalbfleisch, and A. V. Peterson. The analysis of
[17] L. Gordon and R. Olshen. Tree-structured survival analysis. Cancer failure times in the presence of competing risks. Biometrics, 34:541–
treatment reports, 69(10):1065–1069, 1985. 544, 1978.
[18] E. Graf, C. Schmoor, W. Sauerbrei, and M. Schumacher. Assessment [44] J. R. Quinlan. Induction of decision trees. Machine learning, 1(1):81–
and comparison of prognostic classification schemes for survival data. 106, 1986.
Statistics in medicine, 18(17-18):2529–2545, 1999. [45] M. Robnik-Sikonja and P. Savicky. CORElearn - classification, re-
[19] F. Hadiji, R. Sifa, A. Drachen, C. Thurau, K. Kersting, and C. Bauck- gression, feature evaluation and ordinal evaluation. The R Project for
hage. Predicting player churn in the wild. In Computational Intelligence Statistical Computing, 2012.
and Games (CIG), 2014 IEEE Conference on, pages 1–8. IEEE, 2014. [46] M. Robnik-Sikonja, P. Savicky, and M. M. Robnik-Sikonja. Package
[20] T. Hastie, R. Tibshirani, and J. Friedman. The elements of statistical ’CORElearn’, 2013.
learning: data mining, inference and prediction. Springer, 2 edition, [47] P. Rothenbuehler, J. Runge, F. Garcin, and B. Faltings. Hidden markov
2009. models for churn prediction. In SAI Intelligent Systems Conference
[21] T. Hothorn, P. Bühlmann, S. Dudoit, A. Molinaro, and M. J. Van (IntelliSys), 2015, pages 723–730. IEEE, 2015.
Der Laan. Survival ensembles. Biostatistics, 7(3):355–373, 2006. [48] J. Runge, P. Gao, F. Garcin, and B. Faltings. Churn prediction for high-
[22] T. Hothorn, K. Hornik, C. Strobl, and A. Zeileis. Party: A laboratory value players in casual social games. In Computational Intelligence and
for recursive partytioning, 2010. Games (CIG), 2014 IEEE Conference on, pages 1–8. IEEE, 2014.[49] A. Saas, A. Guitart, and A. Perianez. Discovering playing patterns: Time
series clustering of free-to-play game data. Computational Intelligence
and Games (CIG), 2016 IEEE Conference on, 2016.
[50] S. L. Salzberg. by j. ross quinlan. morgan kaufmann publishers, inc.,
1993. Machine Learning, 1:6, 1994.
[51] V. Saradhi and G. K. Palshikar. Employee churn prediction. Expert
Systems with Applications, 38(3):1999–2006, 2011.
[52] T. Sing, O. Sander, N. Beerenwinkel, and T. Lengauer. Package
’ROCR’: visualizing the performance of scoring classifiers, 2007.
http://rocr.bioinf.mpi-sb.mpg.de.
[53] T. Sing, O. Sander, N. Beerenwinkel, and T. Lengauer. ROCR:
visualizing classifier performance in R. Bioinformatics, 21(20):3940–
3941, 2005.
[54] M. Stepanova and L. C. Thomas. Survival analysis methods for personal
loan data. Operations Research, 50(2):277–289, 2002.
[55] A. Tamaddoni Jahromi, M. M. Sepehri, B. Teimourpour, and S. Choob-
dar. Modeling customer churn in a non-contractual setting: the case of
telecommunications service providers. Journal of Strategic Marketing,
18(7):587–598, 2010.
[56] Terry M. Therneau and Patricia M. Grambsch. Modeling Survival Data:
Extending the Cox Model. Springer, New York, 2000.
[57] T. M. Therneau and T. Lumley. Package ’survival’, 2015.
[58] W. Verbeke, D. Martens, C. Mues, and B. Baesens. Building compre-
hensible customer churn prediction models with advanced rule induction
techniques. Expert Systems with Applications, 38(3):2354–2364, 2011.
[59] M. N. Wright, T. Dankowski, and A. Ziegler. Random forests for
survival analysis using maximally selected rank statistics. arXiv preprint
arXiv:1605.03391, 2016.
[60] S. Yoon, J. Koehler, and A. Ghobarah. Prediction of advertiser churn
for google adwords. In JSM proceedings, 2010.
[61] X. Yu, S. Guo, J. Guo, and X. Huang. An extended support vector
machine forecasting framework for customer churn in e-commerce.
Expert Systems with Applications, 38(3):1425–1430, 2011.
[62] C. Zhang and Y. Ma. Ensemble machine learning. Springer, 2012.You can also read


