Assessment of Knowledge, Attitudes, and Practices on Water, Sanitation, and Hygiene in Some Selected LGAs in Kaduna State, Northwestern Nigeria
←
→
Page content transcription
If your browser does not render page correctly, please read the page content below
Hindawi
Journal of Environmental and Public Health
Volume 2020, Article ID 6532512, 14 pages
https://doi.org/10.1155/2020/6532512

Research Article
Assessment of Knowledge, Attitudes, and Practices on Water,
Sanitation, and Hygiene in Some Selected LGAs in Kaduna State,
Northwestern Nigeria

          M. K. C. Sridhar,1 O. T. Okareh,1 and M. Mustapha                            2

          1
            Department of Environmental Health Sciences, Faculty of Public Health, College of Medicine, University of Ibadan,
            Ibadan, Nigeria
          2
            Department of Agricultural and Environmental Resources Engineering, Faculty of Engineering, University of Maiduguri,
            Maiduguri, Nigeria

          Correspondence should be addressed to M. Mustapha; mohammedmusty88@gmail.com

          Received 6 February 2020; Revised 4 August 2020; Accepted 16 August 2020; Published 31 August 2020

          Academic Editor: Issam A. Al-Khatib

          Copyright © 2020 M. K. C. Sridhar et al. This is an open access article distributed under the Creative Commons Attribution License,
          which permits unrestricted use, distribution, and reproduction in any medium, provided the original work is properly cited.
          Access to safe water, sanitation, and hygiene (WASH) facilities is a basic necessity for human livelihood, survival, and well-being.
          Adequate WASH facilities provision is a critical issue to most developing countries around the world including Nigeria.
          Knowledge, attitudes, and practices regarding WASH are integral to effective and sustainable WASH facilities provision. This
          study assessed the level of knowledge, behavior, and practices towards water, sanitation, and hygiene in Kaduna state, Nigeria,
          with a view to ensuring sustainable WASH facilities intervention in the region. Data collection tools included spot check
          observation and questionnaire involving 854 participants, selected from five local government areas (LGAs): Chikun, Kajuru,
          Soba, Kachia, and Zango Kataf. From the results, major drinking water sources were surface waters (52.5%) and unprotected hand
          dug wells (44.8%); only 46.2% treated their water supply and few (16.6%) used chlorination method. Pit latrine toilets were the
          major (76.5%) excreta disposal means, and open defecation practices were widespread (41.4%). Level of personal and envi-
          ronmental hygiene understanding was fairly good in all the local government areas, and 65.4% claimed to use water and soap for
          washing hands after defecation. Incidence of water related diseases is generally low in the area. Despite the commendable findings
          in the study areas, communities are still at risk due to lack of safe water supply and poor practices of home treatment and excreta
          disposal. Therefore provision of WASH facilities and WASH education is fundamental for ensuring public health in the study area.

1. Introduction                                                          facilities [6, 7]. Children are one of the most vulnerable
                                                                         groups affected by lack of water, sanitation, and hygiene
Access to safe water, sanitation, and hygiene (WASH) fa-                 facilities [2]. In developing countries, the high mortality rate
cilities is considered a basic human necessity for survival and          resulting from diarrheal among children under the age of
well-being [1], without these basic needs, the health con-               five was majorly due to WASH challenges [2, 5].
ditions of millions of people especially children are at risk                The provision of safe WASH facilities has been greatly
[2]. However, 2.3 billion and 844 million people across the              influential on people’s health status and livelihood; however,
globe lack access to basic drinking water and sanitation                 the availability of these facilities remains critical in Nigeria
facilities, respectively [3], causing 842,000 deaths every year          especially in the rural areas [8–12]; a large percentage of rural
[4], which is undoubtedly a major public health concern.                 communities in Nigeria live without access to safe WASH
WASH services are considered means of contacting and at                  facilities [13]. The situation has thus subjected the com-
the same time preventing diseases [5]. It has been estimated             munities to the utilization of water from rivers, ponds, and
that overall 9% of the global burden of disease could be                 streams for drinking and domestic activities [14] and to the
prevented through improvement in adequate WASH                           practice of open defecation [15] which consequently has
2 Journal of Environmental and Public Health
often led to deaths, illnesses, and spread of waterborne water, excreta disposal systems used and related perceptions,
diseases [16–18]. The few improved water facilities from personal and environmental hygiene, and water related dis-
boreholes and wells with hand pumps available are largely eases relevant to the study.
insufficient; women and children mostly travel far distances
to access water, which is energy and time consuming, thus
affecting children’s education and women’s household and
2. Materials and Methods
economic productivity [19]. On the other hand, hygiene 2.1. Study Area. Figure 1 shows the map of Kaduna state. It is
facilities such as excreta disposal (toilets) have also been located on the southern end of the high plains of Northern
inadequate for usage at community households and public Nigeria. The state is situated between longitudes 06.00 and
places such as schools [20], markets [21], and even hospitals 09.00 east of the Greenwich Meridian, and between latitudes
[22], which left people with no alternative but to defecate 09.00 and 11.00 north of the Equator. The major cities of
openly and sometimes in and around water sources [23] Kaduna state are Kaduna town, Zaria, and Kafanchan. Other
with no use of soap or any cleaning agents for protection cities include Kachia, Zonkwa, Saminaka, Birnin Gwari,
[24]. Moreover, toilet facilities available were poorly Makarfi, Ikara, Giwa, Zango Kataf, and Kagoro. Kaduna is the
maintained and mostly shared among numerous people with capital of the state and consists of two LGAs (Kaduna North
no consideration of gender segregation and women integrity and Kaduna South). The state shares common borders with
[21]. However, government failures have led to the inter- Zamfara, Katsina, and Kano to the north; Niger to the west;
vention by organizations such as UNICEF and WHO for aid Nasarawa to the south; Bauchi and Plateau to the east; and the
through their programs known as WASH. UNICEF’s WASH Federal Capital Territory, Abuja, to the southwest. Kaduna state
team works in over 100 countries globally to provide water has an area of 46,053 square kilometers. The current projected
and sanitation facilities [25]. population of Kaduna state (based on the 2016 population
Knowledge, attitudes, and practices (KAP) associated with census) is estimated at 8,252,366. For conducting the KAP
WASH are of pertinent concern towards sustainable and survey, 5 LGAs (Chikun, Kajuru, Soba, Kachia, and Z/Kataf)
effective implementation of WASH programs in communities were selected from 23 LGAs (Figure 1). From each LGA, one
[26]. KAP regarding WASH are contributing factors to wa- community was picked up randomly for the KAP survey. The
terborne disease prevalence in communities; poor WASH communities are Gwagwada (Chikun LGA), M/Kajuru
knowledge leads to unhygienic practices and poor attitudes (Kajuru LGA), Soba (Soba LGA), Kachia (Gumel) (Kachia
which pollute water and spread illness [27, 28]. Such inad- LGA), and Gukwu (Z/kataf LGA).
equate WASH knowledge leads to wrong perception of
quality of water resulting in large dependence on surface
waters for drinking [14, 29], open defection practices being 2.2. Sample Size and Survey Procedure. Scientific steps were
perceived normal and commonly practiced, minimal followed to ensure the technical appropriateness of the
household water purification practices to prevent diseases survey sample size and sampling procedure. The following
[30, 31], and poor water collection and storage behaviors formula was used to determine the sample size [38]:
contaminating water and causing illnesses [32–34]. House-
hold and environmental hygiene also tend to be poor, and D∗ · Z2(1−α)/2 p(1 − p)N
n� , (1)
children stool is often overlooked and perceived harmless in d2 (N − 1) + Z2(1−α)/2 p(1 − p)
sanitation programs, hence increasing the risk of disease
transmission [35–37], all due to limited WASH under- where n is the sample size estimate, D is the design effect, p is
standing and poor attitudes and practices towards WASH. the proportion practicing hand washing as a hygiene prac-
Therefore, there is a need to provide hygiene education tice, Z1−α/2 is the standard score corresponding to 95%
programs and increased awareness towards promoting good confidence level, N is the total population, and d is the degree
WASH practices and ensuring good public health in the of precision.
communities. In Nigeria, it is expected that there is currently a Using hand washing as a proxy for the indicators, p was
dearth of data on the status of WASH; thus, it is increasingly chosen to be 50% (the value that will yield the largest sample
becoming difficult to plan any meaningful WASH program to size). The design effect was estimated at 2 because of the
improve health and well-being. Therefore, this study aims at clustering in the target population, and the level of precision
assessing the knowledge, attitudes, and practices related to was set to 0.05. The total population of Kaduna state was
WASH in 5 local government areas in Kaduna state, Nigeria, obtained from the official gazette of the Federal Republic of
with a view to providing reliable and sufficient data for ef- Nigeria for the 2016 population census and used as N. After
fective implementation of WASH programs and ensuring the application of the above formula, the estimate obtained
good public health. The KAP survey is a follow-up of an for Kaduna state was adjusted for a nonresponse rate of 10%.
earlier nationwide survey on water, sanitation, and hygiene A three-stage sampling procedure was adopted for se-
carried out by UNICEF, Nigeria, during the years 2007–2009. lection of respondents. In Kaduna state, the IYS (Interna-
The study objectives are to assess the demographic charac- tional Year of Sanitation) LGAs were 5 (Table 1). The first
teristics of the study areas relevant to the survey, the various stage was a random selection of 40% of the IYS LGAs in each
water sources for drinking and domestic activities, home of the state LGAs. The NPC population estimates of the
water treatment methods and practices, water collection and selected LGAs were obtained from the 2016 census [39]. The
storage attitudes and practices, knowledge of quality drinking proportion of the total population constituted by each LGAJournal of Environmental and Public Health 3
Landuse map of Kaduna state by local government area
N
W E
S
0 30 60 120 kilometers
Land use description
Agricultural tree crop plantation Discontinuous grassland dominated by grasses and bare surface
Disturbed forest Dominantly shrubs and dense grasses with a minor tree component
Floodplain agriculture Dominantly trees/woodlands/shrubs with a subdominant grass component
Forest plantation Extensive (grazing, minor row crops) small holder rainfed agriculture
Grassland Extensive small holder rainfed agriculture with denuded areas
Gullies Graminoid/sedge freshwater marsh
Livestock project Intensive (row crops, minor grazing) small holder rainfed agriculture
Major urban Natural waterbodies: Ocean, river, lake
Minor urban Shrub/sedge/graminoid freshwater marsh/swamp
Reservoir Teak/gmelina plantation
Riparian forest Undisturbed forest
Rock outcrop Sand dunes/aeolian
Figure 1: Map of Kaduna state with various LGAs.4 Journal of Environmental and Public Health
Table 1: Sample size and number of selected IYS LGAs in Kaduna state.
S/N LGA Community Sample size/LGA
1 Chikun Gwagwada 236
2 Kajuru M/Kajuru 71
3 Soba Soba 188
4 Kachia Kachia (Gumel) 156
5 Z/Kataf Gukwu 203
Total 854
was computed. Sample sizes for each LGA were then pro- 3.2. Sources of Water for Drinking and Other Activities in the
portionately allocated to the selected communities. Communities. As shown in Table 3, across the 5 LGAs,
The second stage involved the random selection of 40% sources of drinking water include surface waters (52.5%),
of the IYS communities in each of the selected LGA. The unprotected hand dug wells (44.8%), and protected hand dug
sample sizes allocated to each LGA were equally allocated to wells (36.2%). Rain water harvesting was practiced by 52.5%
the selected communities. Table 1 shows the breakdown of of the communities. Kachia and Zango/K collect rain water to
sample sizes for the state and selected LGAs and commu- a large extent, 85.8% and 63.9%, respectively. These com-
nities. The last stage was the random selection of street munities also utilize surface waters to a great extent, 89.0%
blocks (as clusters) based on the map of the selected and 95.1%, respectively. During dry season, unprotected hand
community. Household heads (or representatives) were dug wells (36.2%) and surface waters (51.9%) were the main
interviewed in selected clusters. sources. However, some still sought additional water from
vendors. The sources of water for other domestic purposes
were as follows: surface waters (47.8%), unprotected hand dug
2.3. Data Collection and Analysis. The study is a cross-
wells (39.16%), and protected hand dug wells (34.9%).
sectional field survey involving the use of structured ques-
tionnaire and field observation. A total of 854 questionnaires
were administered and retrieved. The number was distrib-
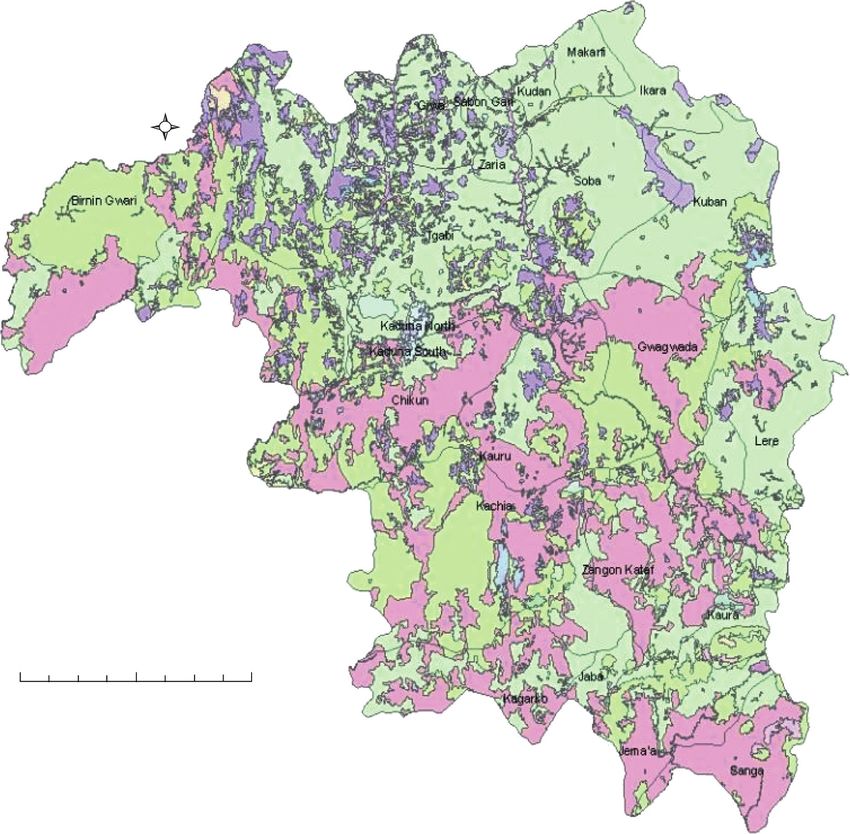
3.3. Water Treatment Methods Used and Communities Level of
uted across the LGAs as follows: Chikun: 236 (27.6%);
Practice. About 46.2% of the respondents claimed to have
Kachia: 156 (18.3%); Kajuru: 71 (8.3%); Soba: 188 (22.0%);
treated their water supply (Table 4). The most common
and Zango/K: 203 (23.8%). The study variables include
method was filtration through cloth (45.2%). Other methods
sociodemographic characteristics, water sources, and KAP
mentioned were boiling (44.4%) and chlorination, though
regarding household water treatment, water collection and
very few (16.6%) as shown in Figure 2. There is frequency of
storage systems, excreta disposal, and household and en-
household water treatment in all the LGAs as 43.3% indi-
vironmental hygiene. In order to support the questionnaire
cated that they treated water that day, 22.6% the previous
data, observational checklists were used to capture and
day, 15.8% less than one week ago, 3.3% less than a month
ensure the practices of household compound cleanliness,
ago, and 5.7% more than a month ago, and very few (9.3%)
excreta disposal, and storage systems. Data collection was
could not remember the last time they treated water.
performed and supervised by 3 trained and experienced
environmental and public public health professionals with
assistant from various trained field staff members and re-
3.4. Household Drinking Water Storage Practices, Handling
searchers in Kaduna state. The survey was closely monitored
Attitudes, and Knowledge of Quality Drinking Water. The
for data quality assurance. Results of the surveys were en-
facilities used for storing drinking water were mostly cov-
tered into EpiData and analyzed.
ered clay pots (54.1%) and covered plastic containers
(48.4%) (Table 5). Open containers were also common
3. Results among 15.1% of the respondents. Plastic buckets with taps
3.1. Background Characteristics of the Study Population. were used only in Kachia by 24.5% of the respondents. Items
Table 2 shows the background characteristics of the survey used in fetching drinking water from the storage facility
respondents of which the majority (84.5%) were males. included cup with handle (84.9%), cup without handle
About 81.8% of them have been residents for more than 10 (4.9%), calabash (8.3%), and bowl (2.0%). These items were
years. Some 47.6% were aged 30–50 years, and about 88.8% common in all the LGAs studied. These items were either
were married. Some 80.2% reported that they have been to kept on the storage container (59.4%), kept in a basket or
school. However, 36.1% of them had Quranic education, shelf (22.5%), or hung (12.6%). Cleaning of the storage
20.4% primary schooling, and 24.4% secondary schooling, facilities was done daily by 72.6%, weekly by 15.0%, and
while 14.0% had postsecondary education. Hausa accounted when dirty by 11.5%. Again, the frequency of cleaning varied
for 39.7% of the ethnic groups; others accounted for 58.4% in widely across the LGAs. When respondents were asked
the selected LGAs. Christianity is the most common religion about the qualities of safe drinking water, there were re-
of the respondents (63.4%) followed by Islam (32.6%). Major sponses such as visually clear (65.4%), free from germs
occupations were farming (50.9%), civil service (17.1%), and (40.0%), odourless (36.0%), and sweet taste (30.0%). These
self-employed (7.9%), and unemployment stood at 3.4%. views were consistent among the LGAs.Journal of Environmental and Public Health 5
Table 2: Characteristics of the communities in Kaduna state.
Variable Chikun (236) Kachia (156) Kajuru (71) Soba (188) Zango/K (203) Total (854)
Gender
Male 86.6 73.5 90.4 98.9 75.1 84.5
Female 13.4 26.5 9.6 1.1 24.9 15.5
Residency in the household
Less than 1 year 0.4 0.6 0.0 0.0 1.0 0.5
1–10 years 12.2 16.1 23.3 13.3 7.8 13.0
Above 10 years 84.5 83.2 76.7 86.7 75.1 81.8
Always 2.9 0.0 0.0 0.0 16.1 4.7
Age
Below 30 years 21.4 13.5 13.7 13.3 17.6 16.6
30–50 years 50.0 47.1 61.6 47.3 40.5 47.6
Above 50 years 27.3 38.7 24.7 38.8 27.8 31.8
Marital status
Single 2.1 4.5 9.6 6.9 2.0 4.2
Married 91.2 84.5 82.2 91.0 89.8 88.8
Divorced 1.3 1.9 0.0 1.1 0.5 1.0
Widowed 5.5 9.0 8.2 1.1 7.8 5.9
Ever attended school
Yes 61.8 86.5 90.4 99.5 75.6 80.2
No 38.2 13.5 9.6 0.5 24.4 19.8
Highest school attended
Quranic school 45.4 11.0 11.0 66.5 25.4 36.1
Basic literacy 1.3 4.5 1.4 3.2 6.8 3.6
Primary school 25.2 21.3 21.9 10.1 22.9 20.4
Vocational school 0.8 0.0 4.1 1.1 2.9 1.5
Secondary school 17.2 37.4 34.2 10.6 32.2 24.4
Postsecondary school 10.1 25.8 27.4 8.5 9.8 14.0
Religion
Christianity 66.8 91.6 69.9 0.5 93.7 63.4
Islam 28.2 2.6 28.8 96.3 3.4 32.6
Others 5.0 5.8 1.4 3.2 2.9 4.0
Occupation
Student 3.8 4.5 4.1 2.7 2.0 3.3
Housewife 2.5 3.9 4.1 1.1 10.2 4.4
Retired/pensioner 4.2 9.7 0.0 1.6 1.0 3.5
Farmer 46.6 38.1 35.6 60.6 62.0 50.9
Private employment 2.9 9.0 5.5 6.9 1.0 4.7
Self-employed 13.0 5.2 12.3 5.3 4.9 7.9
Civil servant 17.2 21.3 31.5 16.0 9.8 17.1
Others 4.2 3.9 2.7 1.6 2.4 3.0
3.5. Excreta Disposal, Preferences, and Affordability toilets (27.1%). Those who were not willing to stop open
defecation cited lack of money as being the reason.
3.5.1. Excreta Disposal Methods and Practices in the Study In the communities, it was common for under-5 children
Area. The use of traditional pit latrine was a common to defecate around the house (25.4%), in the toilet (28.32%),
practice in all the 5 LGAs as 76.5% claimed usage (Ta- and in the potty/chamber pot (24.7%). Defecation around the
ble 6). However, about 41.4% still practice open defeca- house is most common in Zango (47.8%). The use of potty/
tion. Kachia and Kajuru had large number of traditional chamber pot was more frequent in Kajuru (37.0%) and Chikun
pit toilets. Improved pit toilets and VIP toilets were also (34.0%). After children defecation, the feces were dropped into
found in Kachia (47.1%) and Kajuru (23.3%). In the a toilet facility (63.0%), thrown into the bush (16.3%), or eaten
households, 65.7% use traditional pit latrines, 5.9% use by dogs (10.4%). Dropping of children feces into toilet facility
improved pit toilets, and 22.8% practice open defection. was generally a common practice across the LGAs as shown in
People use these facilities because they are cheap (25.7%) Table 7.
or easy to maintain (31.9%) or because they cannot afford
to build a better one (30.5%). Among those practicing 3.5.2. Perception of a Good Toilet, Type of Toilet, and Pre-
open defecation, 90.3% were willing to stop and start ferred Ownership by the Population. The information on
using traditional pit latrine (37.9%) and improved pit how the respondents perceive a good toilet, the type of toilet,6 Journal of Environmental and Public Health
Table 3: Sources of water for drinking and other domestic purposes (expressed as %).
Feature Chikun Kachia Kajuru Soba Zango/K Total
Sources of water for households
Motorized borehole 0.4 0.0 0.2 2.1 0.0 0.8
Hand pump borehole 0.4 1.9 45.2 21.8 5.4 10.4
Protected dug well with hand pump 2.5 0.0 6.8 2.1 0.0 1.7
Protected hand dug well 39.5 2.6 61.6 69.1 18.5 36.2
Unprotected hand dug well 49.6 92.9 11.0 21.3 36.6 44.8
Developed spring 1.3 0.6 0.0 0.5 0.5 0.7
Undeveloped spring 14.3 1.3 0.0 1.1 2.0 4.9
Rain water harvesting 26.0 85.8 17.8 36.2 63.9 54.2
Bottled water 0.0 1.3 0.0 0.5 0.0 0.3
Sachet (pure) water 0.0 0.6 2.7 5.3 0.5 1.6
Tanker water vendor 0.4 5.2 0.0 2.1 0.5 1.6
Truck water vendors 0.4 78.7 0.0 26.1 0.5 20.1
Surface water (river/pond/lake) 37.4 89.0 30.1 3.7 95.1 52.5
Others 0.0 1.3 0.0 1.6 0.5 0.7
Main source of drinking water during dry season
Motorized borehole 0.0 0.0 0.0 1.6 0.0 0.3
Hand pump borehole 0.4 0.6 45.2 20.7 2.0 9.1
Protected dug well with hand pump 1.3 0.0 11.0 2.7 0.5 2.0
Protected hand dug well 35.7 2.6 39.7 68.1 12.7 31.7
Unprotected hand dug well 34.0 91.6 11.0 16.0 24.4 36.2
Developed spring 0.8 0.0 1.4 0.0 0.5 0.5
Undeveloped spring 12.2 0.0 2.7 0.5 0.5 3.8
Rain water harvesting 8.8 20.0 2.7 12.8 6.8 10.7
Bottled water 0.4 1.3 0.0 0.5 0.0 0.5
Sachet (pure) water 0.4 9.7 1.4 5.3 1.0 3.4
Tanker water vendor 0.4 30.3 0.0 4.3 1.0 6.8
Truck water vendors 1.3 60.6 0.0 31.4 0.0 18.2
Surface water (river/pond/lake) 35.7 89.7 21.9 3.7 97.1 51.9
Others 0.0 0.6 0.0 3.7 0.0 0.9
Main source of drinking water during wet season
Motorized borehole 0.0 0.0 0.0 1.6 0.0 0.3
Hand pump borehole 0.0 1.3 34.2 12.2 5.4 7.1
Protected dug well with hand pump 1.7 0.0 4.1 2.7 0.0 1.4
Protected hand dug well 13.4 2.6 60.3 62.8 13.2 26.2
Unprotected hand dug well 36.6 92.3 6.8 9.6 34.6 37.7
Developed spring 0.0 0.0 0.0 0.0 0.5 0.1
Undeveloped spring 3.4 1.9 0.0 0.5 0.5 1.5
Rain water harvesting 72.7 87.7 42.5 55.3 85.9 72.2
Bottled water 1.7 1.3 0.0 0.5 0.0 0.8
Sachet (pure) water 0.4 1.9 0.0 1.1 0.0 0.7
Tanker water vendor 0.0 0.6 0.01.6 1.6 0.5 0.6
Truck water vendors 0.0 13.5 0.0 27.7 1.0 8.7
Surface water (river/pond/lake) 13.4 14.8 13.7 0.5 83.9 27.7
Others 0.0 0.6 0.0 0.0 0.0 0.1
Main source of water for other domestic purposes
Motorized borehole 0.0 0.6 2.7 1.6 0.0 0.7
Hand pump borehole 0.0 1.3 37.0 13.8 6.3 7.9
Protected dug well with hand pump 2.5 0.0 0.0 2.1 0.0 1.2
Protected hand dug well 36.6 3.9 64.4 67.6 16.1 34.9
Unprotected hand dug well 44.5 85.2 8.2 16.0 30.2 39.1
Developed spring 0.4 0.0 0.0 0.0 0.0 0.1
Undeveloped spring 13.9 0.6 0.0 1.1 1.0 4.4
Rain water harvesting 52.5 70.3 11.0 21.3 42.0 42.8
Tanker water vendor 0.4 1.3 0.0 1.6 0.0 0.7
Truck water vendors 0.0 69.0 0.0 26.6 1.0 18.5
Surface water (river/pond/lake) 30.3 79.4 23.3 3.7 93.7 47.8
Others 0.0 1.3 0.0 1.6 0.5 0.7Journal of Environmental and Public Health 7
Table 4: Water treatment practice by communities.
Water treatment for safe drinking Chikun Kachia Kajuru Soba Zango Total%
Yes 30.3 16.8 38.4 56.4 65.9 42.7
No 67.2 83.2 60.3 43.1 33.7 56.2
Never 1.7 0.0 1.4 0.0 0.5 0.7
0.5
0.3 1.9
3.5
3.8
16.6
45.2
44.4
Water treatment options Chlorination
Sedimentation only Ceramic/sand filtration
Sedimentation and filtration Solar disinfection
Filtration through cloth Others
Boiling
Figure 2: Household water treatment methods used.
and preferred ownership is displayed in Table 8. In terms of hands, there was a consensus among the respondents from the
perception, the respondents were of the opinion that privacy LGAs that hands should be washed before meal (85.1%), after
(46.4%), disease prevention (46.0%), and safety (33.1%) meal (73.5%), after defecation (46.8%), and after cleaning
mean a good toilet. Most (70.9%) of the respondents pre- children feces (13.5%). After defecation, hand washing is
ferred private toilet, some preferred compound toilet practiced the most in Kachia (76.8%) followed by Zango
(22.4%), and very few opted for communal toilets (6.8%). (53.7%). Items used for hand washing include soap with water
Flush toilet (56.5%) and traditional pit toilet (25.4%) are the (65.4%), water only (21.6%), and sand and water (8.8%). A
most preferred types in the selected LGAs followed by VIP sizable number understood that personal hygiene means
(14.6%) and San Plat (3.5%) types. About 73.8% could afford bathing (87.5%), washing of clothes (63.0%), cutting of hair
the preferred toilet type, and only 7.8% are willing to (46.4%), and cutting of nails (46.9%). The knowledge was
contribute towards the preferred toilet. comparable among the communities.
3.6. Personal, Household, and Environmental Hygiene 3.6.2. Household and Environmental Hygiene. Sweeping of
Practices of the Respondents the house (90.6%), cleaning of kitchen (42.8%), proper
disposal of waste water (35.5%), cleaning of toilets
3.6.1. Personal Hygiene. The respondents used soap for (46.6%), and proper disposal of solid waste (30.6%)
washing clothes (77.5%), taking bath (85.4%), bathing children regularly are practices referred to as household and en-
(49.4%), and washing hands after defecation (31.3%) as shown vironmental hygiene by the respondents. This under-
in Table 9. When asked about when is it important to wash standing of household/environmental hygiene is fairly8 Journal of Environmental and Public Health
Table 5: Handling and storage of household drinking water and knowledge of qualities of safe drinking water.
Features Chikun Kachia Kajuru Soba Zango Total%
Containers/fetching methods
Open container 8.8 11.0 4.1 26.1 19.5 15.1
Covered plastic container 29.8 72.9 39.7 46.8 56.1 48.4
Clay pots with cover 53.4 65.8 58.9 41.5 56.1 54.1
Clay pots without cover 12.6 7.7 1.4 8.5 20.0 11.6
Iron bucket containers without cover 0.4 5.2 0.0 18.1 1.5 5.4
Plastic buckets with tap 2.5 24.5 11.0 11.7 2.4 9.2
Basins without cover 1.3 2.6 0.0 4.3 1.5 2.1
Others 4.6 0.0 0.0 0.5 0.0 1.4
Item used in fetching drinking water from storage facility
Cup with handle 81.1 81.9 91.8 85.6 88.3 84.9
Cup without handle 5.5 5.8 2.7 4.8 4.4 4.9
Calabash 13.0 11.0 1.4 6.4 4.9 8.3
Bowl 0.4 1.3 4.1 3.2 2.4 2.0
Place where item for fetching drinking water is kept
On the storage container 72.3 47.1 49.3 46.8 68.8 59.4
In a basket/shelf 14.7 33.5 39.7 16.5 22.4 22.5
On the floor 4.2 1.3 4.1 10.1 6.8 5.6
Hanging 8.8 18.1 6.8 26.6 2.0 12.6
Frequency of cleaning of storage container
Daily 55.5 61.3 87.7 84.0 85.4 72.6
Weekly 26.9 23.2 1.4 10.1 4.4 15.0
Monthly 0.4 3.2 0.0 0.0 0.5 0.8
When dirty 17.2 12.3 11.0 5.9 9.8 11.5
Table 6: Excreta disposal methods and practices.
Feature Chikun Kachia Kajuru Soba Zango Total
Types of excretal disposal facilities in community
Open defecation 48.3 3.2 41.1 10.1 47.3 41.4
Digging, defecating, and burying in soil 2.5 6.5 13.7 8.0 3.9 5.7
Traditional pit toilet 87.4 90.3 93.2 76.6 91.2 76.5
Improved pit toilets 1.7 22.6 23.3 6.4 12.2 10.8
VIP toilets 0.0 47.1 8.2 3.7 0.0 10.0
Pour flush toilets 0.0 10.3 20.5 11.7 1.0 6.4
Water closet toilets 0.0 8.4 8.2 1.1 0.0 2.4
Others 0.0 0.0 0.0 0.5 0.0 0.1
Types of excretal disposal facilities in households
Open defecation 2.8 0.0 9.6 8.0 29.8 22.8
Digging, defecating, and burying in soil 0.4 0.6 1.4 7.4 0.5 2.1
Traditional pit toilet 72.7 85.8 74.0 76.1 62.0 65.7
Improved pit toilets 2.5 0.6 12.3 6.4 9.8 5.9
VIP toilets 0.0 3.9 2.7 2.1 0.0 1.4
Pour flush toilets 0.0 0.0 1.4 1.6 0.0 1.5
Water closet toilets 0.4 0.6 1.4 0.5 0.0 0.5
Others 0.0 0.0 0.0 0.0 0.0 0.0
uniform in all the LGAs. When asked how often they and the lowest in Chikun (2.9%). In order to prevent
clean their compounds, respondents said once daily water stagnation, 81.0% said they would clear it, while
(54.6%), every other day (8.7%), and only when dirty 3.0% said they would divert it to farms. There was
(10.4%). Taking refuse to the dump sites (56.5%) is the however a consensus (94.5%) that community members
most common way of household waste disposal, while should be responsible for prevention of stagnated water.
other practices are open dumping (26.2%) and burning
26.1%. With respect to animal waste, the majority (79.9%) 3.7. Water Related Diseases Perceived in the Households and
take it to the farms while 6.4% dump it openly. Presence Communities. There were reports of epidemics of water
of stagnant water around water points was reported by related diseases within the last year by 40.9% of all re-
only 23.3%, and this was the highest in Kajuru (41.1%) spondents. The common diseases are malaria (88.6%),Journal of Environmental and Public Health 9
Table 7: Disposal of children’s feces.
Feature Chikun Kachia Kajuru Soba Zango/K Total
Under-5 defecation
Around the house 22.3 19.4 13.7 14.4 47.8 25.4
In the potty/chamber pot 34.0 0.6 37.0 26.1 26.3 24.7
In the toilet 22.3 67.7 17.8 31.4 6.3 28.3
In pampers 1.3 0.0 0.0 4.8 0.5 1.5
Within the compound 10.5 0.0 5.5 1.6 2.9 14.7
Others 9.2 12.3 16.4 21.3 16.1 14.7
Methods of disposal of children’s feces
Dropped into a toilet facility 59.7 83.9 72.6 81.9 30.2 63.0
Eaten by dogs 3.8 6.5 2.7 0.5 32.7 10.4
Buried in the soil 9.7 3.9 1.4 5.3 8.3 6.6
Thrown into the bush 18.1 1.3 6.8 2.1 42.0 16.3
Disposed with solid waste 3.4 0.6 2.7 1.1 0.5 1.6
Nothing/left there 0.4 0.6 0.0 1.1 8.8 2.6
Table 8: Perception of a good toilet, type of toilet, and preferred ownership.
Feature Chikun Kachia Kajuru Soba Zango Total (%)
Perception of a good toilet
Privacy 58.4 52.3 41.1 26.6 48.3 46.4
Safety 31.1 36.1 26.0 34.0 34.6 33.1
Preventing diseases 21.8 66.5 41.1 58.5 48.8 46.0
Easy to use 8.0 26.5 19.2 22.9 18.0 17.9
Well covered and clean 9.7 11.6 47.9 5.3 29.8 17.1
Used by children on their own 7.1 16.1 1.4 2.1 11.2 8.1
Built close to the house 0.8 0.6 4.1 0.0 2.0 1.2
Others 0.0 0.0 2.7 0.5 0.0 0.3
Table 9: Personal hygiene practices.
Feature Chikun Kachia Kajuru Soba Zango Total (%)
Uses of soap
Washing clothes 71.8 89.7 83.6 78.2 72.2 77.5
Taking bath 84.9 80.0 94.5 80.3 91.7 85.4
Bathing children 38.7 83.2 21.9 60.6 36.5 49.4
Washing child’s bottom 2.9 36.1 12.3 28.7 16.1 18.5
Washing children’s hands 1.3 36.1 11.0 38.8 16.6 20.3
Washing hands after defecating 5.9 56.8 28.8 47.9 27.3 31.3
Washing hands after cleaning child 1.3 29.0 12.3 28.7 14.6 16.4
Washing hands before feeding child 1.7 34.8 16.4 38.4 15.1 20.4
Washing hands before preparing food 0.4 40.0 19.2 46.3 18.0 23.4
Washing hands before eating 5.9 53.5 47.9 50.0 33.7 34.3
Others 0.4 5.8 1.4 3.7 0.0 2.1
Important time to wash hands
Before meal 91.6 71.0 75.3 87.2 89.8 85.1
After meal 68.5 65.8 65.8 71.3 89.8 73.5
After defecation 26.9 76.8 38.4 43.1 53.7 46.8
After cleaning the children feces 4.6 11.0 17.8 15.3 22.4 13.5
Others 0.4 15.5 13.7 5.9 2.0 5.8
Immediate practice after defecation
Cleaning up 71.4 60.0 20.5 18.1 59.5 50.5
Going own way 1.7 1.3 2.7 6.4 2.9 3.0
Washing hands 26.9 38.7 76.7 75.5 37.6 46.4
Items for hand washing
Water only 32.8 8.3 30.4 9.2 39.0 21.6
Water with soap 53.1 63.3 58.9 78.9 57.1 65.4
Water with ashes 0.0 0.0 3.6 9.2 0.0 3.8
Sand and water 0.0 0.0 3.6 21.8 2.6 8.8
Others 0.0 0.0 0.0 1.4 1.3 0.810 Journal of Environmental and Public Health
Table 10: Major problems of diseases perceived in communities and households.
Feature Chikun Kachia Kajuru Soba Zango Total (%)
Common diseases in community
Malaria 81.9 98.1 91.8 88.3 88.3 88.6
Measles 41.6 42.6 60.3 61.7 58.5 51.8
Diarrhea/dysentery 40.3 24.5 17.8 21.3 47.3 33.1
Cholera 13.4 12.9 30.1 11.2 48.3 22.6
Yellow fever 8.4 60.6 13.7 28.2 30.2 27.8
Chicken pox 9.7 31.0 41.1 23.9 30.2 24.2
Meningitis 11.8 23.2 6.8 9.0 25.4 16.1
Typhoid 45.4 76.8 47.9 37.8 74.1 56.5
Guinea worm 0.0 0.0 0.0 0.0 0.0 0.0
Onchocerciasis 0.0 1.3 0.0 3.7 4.4 2.1
Trachoma 0.0 3.2 0.0 3.7 1.0 1.6
Schistosomiasis 0.0 0.0 0.0 2.7 1.0 0.8
Worm infestations 0.8 6.5 0.0 3.2 13.2 5.2
Scabies 0.4 4.5 1.4 3.2 7.8 3.6
Others 0.4 0.6 1.4 2.1 2.4 1.4
Major childhood diseases
Malaria 70.6 85.2 78.1 76.6 79.0 77.2
Measles 67.2 58.1 64.4 71.3 56.1 63.6
Diarrhea/dysentery 39.5 12.9 13.7 21.3 40.5 28.8
Cholera 8.4 5.2 11.0 13.8 13.8 15.8
Yellow fever 4.2 54.2 23.3 28.7 26.3 25.5
Chicken pox 10.5 25.8 52.1 18.1 27.8 22.6
Meningitis 10.1 32.3 1.4 7.4 17.6 14.6
Typhoid 24.8 24.5 8.2 24.5 46.8 28.5
Guinea worm 0.0 0.0 0.0 0.0 0.0 0.0
Onchocerciasis 0.0 0.0 1.4 2.7 1.5 1.0
Trachoma 0.4 0.0 0.0 2.7 0.5 0.8
Schistosomiasis 0.0 0.0 0.0 2.1 0.5 0.6
Worm infestations 0.4 7.1 0.0 2.1 10.7 4.4
Scabies 0.0 1.9 2.7 1.6 9.3 3.1
Others 0.0 1.3 2.7 1.1 2.9 1.4
typhoid (56.5%), measles (51.8%), and diarrhea/dysentery were located inside the house (21.7%) or within walking
(33.1%) as shown in Table 10. These are prevalent in all the distance (11.5%) and next to the toilet (18.6%).
LGAs. Diseases of great concern are typhoid and diarrhea
which were relatively more in Kachia and Zango LGAs. 4. Discussion
Yellow fever was reported to be high in Kachia (60.6%), and 4.1. Sources of Water for Drinking. Access to safe water
no Guinea worm was reported in any of the LGAs. supply is integral to health and survival [1]. In the study area,
there is virtually total absence of improved source of water;
3.8. Structured (Spot Check) Observations Findings. The re- thus, communities extensively utilize surface water and
sults of the spot checks are summarized in Table 11. Presence unprotected wells for drinking which can be infectious [12];
of feces was reported around the house (38.6%), inside the this is similar to many KAP surveys in developing areas
house (25.1%), and near the water source (7.2%). Kachia [32, 40] including a recent counterpart study in Kaduna [41],
showed the highest presence of feces around the households Nigeria, where the majority of surveyed communities uti-
(63.2%), and all the LGAs showed high presence inside the lized polluted water sources due to lack of adequate clean
households. Cow dung and animal excreta (42.3%) and water sources. However KAP studies by Pradhan et al. [42]
children’s feces (26.3%) were also seen around the premises. and Hothur et al. [20] depict otherwise where almost 73.6%
However, water sources were kept fairly free from the feces. of the households were consuming water from improved
Traditional pit toilets (89.5%) were the most observed. The source of water; this disparity is not unconnected to lack of
observed features of the toilets are as follows: small enough effective water policy and governmental commitments in the
hole (34.5%), adequate privacy (25.5%), safe floor (35.5%), respective study locations; efficient water policy can be
presence of slab (16.1%), and having superstructure (23.1%). helpful extensively towards mitigating the high WASH re-
Locations of the toilets were mostly outside the compound lated mortality and morbidity rate in Nigeria [13].
(56.0%). In terms of the indicators for the current usage of
the toilet, the following results were obtained: clear paths 4.2. Home Water Treatment Methods and Practices.
leading to it (50.4%), cleanliness (41.2%), being free of smell Household water treatment practices can improve dra-
(23.4%), and being free of flies (22.0%). Hand wash facilities matically microbial drinking water quality and preventJournal of Environmental and Public Health 11
Table 11: Structured observations.
Feature Chikun Kachia Kajuru Soba Zango/k Total
Evidence of feces around the premises
Inside the house 30.3 36.1 21.9 29.8 7.8 25.1
Outside/around the house 9.7 63.2 31.5 19.1 74.1 38.6
Near the water source 3.8 14.8 4.1 9.0 4.9 7.2
Observations on the feces around the premises
Infants/young children’s feces 34.5 26.5 15.1 22.3 24.4 26.3
Adults’ feces 5.5 25.2 4.1 11.2 12.7 11.9
Cow dung and other animal feces 15.5 63.9 56.2 24.5 68.3 42.3
Type of toilet observed
Digging, defecating, and burying in soil 1.3 1.3 1.4 6.9 4.9 3.4
Traditional pit toilet 97.5 91.0 84.9 83.0 86.8 89.5
Improved pit toilets 0.8 3.2 8.2 4.3 7.3 4.2
VIP toilets 0.0 4.5 2.7 2.7 0.0 1.6
Others 0.0 0.0 0.0 0.0 0.5 1.2
Features of the toilet in the household (if available)
Having superstructure 21.0 25.2 35.6 30.9 12.2 23.1
Safe floor 8.8 72.3 74.0 45.3 16.1 35.5
Having a slab 27.3 12.3 23.3 16.0 3.4 16.1
Small enough hole 17.2 55.5 58.9 35.6 28.8 34.5
Adequate privacy 18.5 28.4 60.3 30.3 14.6 25.5
Location of toilet
Inside the compound 48.7 29.7 52.1 75.0 18.0 44.0
Outside the compound 51.3 70.3 47.9 25.0 82.0 56.0
Toilet in current use
Clear path leading to it 45.8 75.5 78.1 51.1 26.3 50.4
Being clean 18.9 72.3 75.3 57.4 16.6 41.2
Being reasonably free of smell 9.7 38.1 64.4 30.9 6.8 23.4
Being reasonably free of flies 9.2 41.3 58.9 24.5 6.8 22.0
Cleansing materials 2.5 63.9 42.5 18.1 2.9 20.5
Presence of water in the vicinity 1.3 48.4 39.7 22.9 2.9 18.2
Presence of ash in the vicinity 0.8 28.4 46.6 13.8 1.5 12.7
Any other evidence of use 8.8 41.3 43.8 18.6 3.4 18.5
Presence of hand washing facility
Next to the toilet 2.1 45.2 19.2 33.5 3.9 18.6
Within walking distance 0.4 30.3 15.1 16.5 4.4 11.5
Inside the house 0.4 29.0 30.1 21.8 37.6 21.7
Observing the presence of the following
Storage container 22.7 26.5 32.9 41.5 46.8 34.1
Separate bowl/cup to fetch water 5.0 19.4 34.2 43.1 43.9 27.7
diseases [43]; it is found to reduce rate of diarrhea infection drinking water and preventing waterborne diseases at
among children [31] and shown to decrease level of cholera households [50–52]; uncovered water storage containers and
outbreak and disease transmission among people [44]. In the those with wide openings make water susceptible to con-
study area communities’ level of home water treatment tamination; frequent cleaning of containers is essential in
practices was considerably low as 54.8% do not treat water mitigating household water bacterial recontamination [33],
particularly using efficient methods such as chlorination. and it is highly recommended as part of sanity that cups used
The absence of home treatment practices is often consistent to retrieve water from storage containers should have ladles
in many communities across developing countries in the or handles [46], to avoid unclean hands dipped into water in
world as shown by many studies [28, 40, 45–47], being more the process of fetching, and be kept on clean surface [40] or
pathetic in the rural areas [48, 49]; it is perceived unim- hung after usage. In the study area, different storage systems
portant by the rural dwellers due to lack of education and used are safe for storing water and are fairly covered and
awareness on WASH, which has continued to impact cleaned periodically; this is similar to findings by Reddy et al.
negatively on their health status. [46], Pradhan et al. [42], and Ssemugabo et al. [53]. However
the study population lacks knowledge of quality drinking
4.3. Storage System Practices, Handling, and Knowledge of water as many responded that quality water means visually
Quality Drinking Water. Appropriate use of storage vessels clear water. This understanding affects home water treat-
and handling attitudes are vital to maintaining quality ment practices, consequently subjecting communities to12 Journal of Environmental and Public Health
diarrhea and waterborne diseases [31]. Contrarily, some infections associated with the study area. Effectiveness of
similar studies show that water consumers are knowl- WASH does not depend on facilities provision alone.
edgeable about safe drinking water [53]. Therefore, WASH education is fundamental for pro-
moting good practices and behavior towards WASH in
order to protect public health. The study further suggests
4.4. Excreta Disposal Practices. The lack of improved toilets
investigation regarding personal and environmental
facilities was a huge concern in the study areas, resulting in
hygiene practices and the related disease implication in
open defecation being a common practice especially by
the study area.
children at households, which is a major health and social
burden for the community at large [54]; this corresponds to
various findings in developing countries [30, 46]. None- Data Availability
theless, the respondents have positive perception regarding
good toilet facilities and are willing to stop open defecation; The data used to support the findings of this study are
however, it was reported that unavailability of improved available from the corresponding author upon request.
toilets was due to lack of financial capability. Toyobo et al.
[55] and Miner et al. [15] reported similar scenarios, where Conflicts of Interest
communities suffer WASH challenges due to lack of fund.
Livelihood empowerment and poverty eradication in the The authors declare that there are no conflicts of interest
rural areas are vital to sustainable toilet facilities in the area. regarding the publication of this paper.
4.5. Personal and Environmental Hygiene. In the study area Acknowledgments
adequate knowledge of personal hygiene led many to the Thanks are due to various staff members from Kaduna state,
good practices of using water and soap for cleaning hands the selected LGAs, WASH Coordinator, UNICEF Zone C
after defecation, which is essential in preventing diseases WASH Coordinator and others, community leaders, and
[31], similar to studies by Orimoleye et al. [30] in Ibadan and several research and field staff members who assisted in the
Miner et al. [15] in Jos, Nigeria; practices of environmental data collection, data entry, and data analysis. The authors
hygiene were also fairly good as children feces were majorly thank in particular Dr. Bolu Onabolu, Ms. Yetunde Ade-
perceived as harmful and were disposed in a toilet facility as goke, and Dr. Gloria Onyilo for their contributions to the
reported by 63% of the respondents. However increased design of data collection.
education is essential at critical times as children feces were
observed in many households (38.6%) during inspection.
References
4.6. Waterborne and Water Related Diseases. Relating to the [1] IWA (International Water Association)/WHO (World Health
KAP on WASH in the study area, waterborne diseases of Organisation), Promotion of Tap Water Drinking and Public
diarrhea, malaria, and dysentery seem to be prominent in the Relation Practices in Water Utilities Water Safety Plans, IWA
(International Water Association), Beijing, China, 6th IWA-
area; dysentery and diarrhea were more common among
JWWA Workshop, 2011.
children under 5, relating to the findings by Yaya et al. [2] [2] S. Yaya, A. Hudani, O. Udenigwe, V. Shah, M. Ekholuenetale,
and Prüss-Ustün et al. [5] where leading cause of death and G. Bishwajit, “Improving water, sanitation and hygiene
under the age 5 in developing countries was diarrhea. practices, and housing quality to prevent diarrhea among
Generally, the disease prevalence was low among the under-five children in Nigeria,” Tropical Medicine and In-
communities. fectious Disease, vol. 3, no. 2, p. 41, 2018.
[3] WHO and JMP, “Launch version July 12 2017,” in Progress
on Drinking Water, Sanitation and Hygiene—2017 Update
4.7. Constraints, Challenges, and Strength of the Research. and SDG Baselines, WHO Library Cataloguing-in-Publi-
During the research exercise, we were faced with some cation Data, Geneva, Switzerland, 2017.
constraints and challenges which can affect the quality of the [4] WHO, Water, Sanitation and Hygiene: Transforming the
exercise which are lack of efficient means of transportation, Regional Agenda towards Equitable Access to Safe and Sus-
poor accessibility to some communities, noncooperative tainable Services, World Health Organization, Copenhagen,
attitude of some few respondents due to bulky nature of the Denmark, 2017.
questionnaire, and inadequate time for the exercise; how- [5] A. Prüss-Ustün, J. Wolf, J. Bartram et al., “Burden of disease
ever, the strength is the general cooperation of the com- from inadequate water, sanitation and hygiene for selected
adverse health outcomes: an updated analysis with a focus on
munity and stakeholders.
low- and middle-income countries,” International Journal of
Hygiene and Environmental Health, vol. 222, no. 5, pp. 765–
5. Conclusion and Recommendations 777, 2019.
[6] WHO, “Valuing water, valuing livelihoods,” in Paul Jagals and
The deficiency in knowledge, poor attitudes, and lack of Katherine Pond, J. Cameron and P. Hunter, Eds., IWA
practices of WASH, particularly with regard to home Publishing, London, UK, 2011.
water treatment, use of unsafe water sources, and open [7] WHO, “Water safety plans: risk-based preventive manage-
defecation, are routes of exposure to waterborne ment of drinking-water supplies,” in Proceedings of the 3rdJournal of Environmental and Public Health 13
Municipal Water Quality Conference, Cape Town, South [23] J. O. Okullo, W. N. Moturi, and G. O. Morara, “Open
Africa, June 2011. defacation and its effects on the bacteriological quality of
[8] UNICEF, Water Sanitation and Hygiene in Nigeria, UNICEF, drinking water sources inisiolo country, Kenya,” Environ.
New York, NY, USA, FACT SHEET, 2010, http://www.uni- Health Insights, vol. 11, pp. 1–8, 2017.
cef.org/nigeria/ng. [24] M. V. Shrestha, N. Manandhar, and S. K. Joshi, “Study on
[9] H. T. Ishaku, M. R. Majid, A. A. Ajayi, and A. Haruna, “Water knowledge and practices of water, sanitation and hygiene
supply dilemma in Nigerian rural communities: looking to- among secondary school students,” Journal of College of
wards the sky for an answer,” Journal of Water Resource and Medical Sciences-Nepal, vol. 14, no. 3, pp. 160–165, 2018.
Protection, vol. 3, no. 8, pp. 598–606, 2011. [25] UNICEF, Water, Sanitation and Hygiene, UNICEF, New
[10] M. S. Isa, I. A. Allamin, H. Y. Ismail, and A. Shettima, York, NY, USA, 2020, http://www.unicef.org/wash/#.
“Physiochemical and bacteriological analysis of drinking [26] USAID, The KAP Survey Model (Knowledge, Attitudes and
water from wash boreholes in Maiduguri Metropolis, Borno Practices), USAID, Washington, DC, USA, 2011, https://
state, Nigeria,” African Journal of Food Science, vol. 7, no. 1, www.springnutrition.org/sites/default/filespublicationsan
pp. 9–13, 2013. notationspring_kap_survey_model.pdf.
[11] A. Hyeladi and J. E. Nwagilari, “Assessment of drinking water [27] A. S. Yusuf, W. John, and A. C. Oloruntoba, “Review on
quality of Alau dam Maiduguri, Borno state, Nigeria,” In- prevalence of waterborne disease in Nigeria,” Journal of
ternational Journal of Scientific and Research Publications, Advancement in Medical and Life Sciences, vol. 1, no. 2,
vol. 4, no. 10, pp. 2250–3153, 2014. pp. 1–3, 2014.
[12] S. Lukman, A. Ismail, M. A. Asani, K. A. Bolorunduro, [28] C. A. Miner, A. P. Dakhin, A. I. Zoakah, T. O. Afolaranmi, and
P. U. Foghi, and I. A. Oke, “Effect of Selected factors on water E. A. Envuladu, “Household drinking water; knowledge and
supply and access to safe water in Nigeria,” Ife Journal of practice of purification in a community of Lamingo, Plateau
Science, vol. 18, p. 3, 2016. state, Nigeria,” E3 Journal of Environmental Research and
[13] M. C. Obeta, “Rural water supply in Nigeria: policy gaps and Management, vol. 3, pp. 230–236, 2015.
future directions,” Water Policy, vol. 20, no. 3, pp. 597–616, [29] A. Omarova, K. Tussupova, P. Hjorth, M. Kalishev, and
2018. R. Dosmagambetova, “Water supply challenges in rural areas:
[14] A. Kaoje, M. Yahaya, M. Raji, S. Hadiza, A. Sylvanus, and a case study from Central Kazakhstan,” International Journal
T. Musa, “Drinking water quality, sanitation and hygiene of Environmental Research and Public Health, vol. 16, no. 5,
practices in a rural community of Sokoto state, Nigeria,” p. 688, 2019.
International Journal of Medical Science and Public Health, [30] E. O. Orimoloye, C. O. A. Amadi, A. N. Amadi et al., “As-
vol. 7, no. 11, p. 1, 2019. sessment of water sanitation and hygiene practices in Ibadan,”
[15] C. A. Miner, Y. O. Tagurum, Z. Hassan, T. O. Afolaranmi, International Journal of Research, vol. 2, no. 2, pp. 94–100,
D. A. Bello, and A. Dakhin, “Knowledge and practice of 2015.
sewage disposal in abbatoir community of Jos south LGA, [31] N. E. Soboksa, A. B. Hailu, S. R. Gari, and B. M. Alemu,
Plataeu state, Nigeria,” Research Journal of Health Sciences, “Water supply, sanitation and hygiene interventions and
vol. 4, no. 1, pp. 74–82, 2016. childhood diarrhea in Kersa and Omo Nada districs of Jimma
[16] O. A. Emmanuel, A. Prossy, A. S. Abdul-Azeez, and S. Eunice, Zone, Ethiopia: a comparative cross-sectional study,” Journal
“Spatial analysis of factors responsible for incidence of water of Health, Population and Nutrition, vol. 38, no. 1, 2019.
borne disease in Ile Ife, Nigeria,” J. Sustainable Society, vol. 1, [32] E. J. Kurui, G. M. Ogendi, W. N. Moturi, and D. O. Nyawanga,
no. 4, pp. 96–113, 2012. “Household water handling practices in the arid and semi arid
[17] E. E. Ibok and E. E. Daniel, “Rural water supply and sus- lands in Kenya,” in The Relavance of Hygiene to Health De-
tainable development in Nigeria: a case analysis of Akwa Ibom veloping Countries, London, UK, 2019, IntechOpen, https://
state,” American Journal of Rural Development, vol. 2, no. 4, www.intechnopen.com/books/the-relavance-of-hygiene-to-
pp. 68–73, 2014. health-in-developing-countries/household-water-handling-
[18] N. Forstinus, N. Ikechukwu, M. Emenike, and A. Christiana, in-the-arid-and-semi-arid-lands-in-kenya.
“Water and waterborne diseases: a review,” International [33] R. Meierhofer, B. Wietlisbach, and C. Matiko, “Influence of
Journal of Tropical Disease & Health, vol. 12, no. 4, pp. 1–14, container cleanliness, container disinfection with chlorine,
2016. and container handling on recontamination of water collected
[19] B. Adeleye, S. Medayese, and O. Okelola, “Problems of water from a water kiosk in a Kenyan slum,” Journal of Water and
supply and sanitation in Kpakumgu area of Minna (Nigeria),” Health, vol. 17, no. 2, pp. 308–317, 2019.
Glocalism: Journal of culture, politics and innovation, pp. 1-2, [34] S. L. McGuiness, J. O’ Toole, S. F. Barker et al., “Household
2014. water storage management, hygiene practices and associated
[20] R. Hothur, S. Arepalli, and A. D. Veera Bhadreshwara, “A drinking water quality in rural India,” Environmental Science
KAP study on water, sanitation and hygiene among residents & Technology, vol. 54, no. 8, pp. 4963–4973, 2020.
of Parla village, Kurnool district, Andra Pradesh,” Interna- [35] J. Brown, S. Cairncross, and J. H. J. Ensink, “Water, sanitation,
tional Journal of Community Medicine and Public Health, hygiene and enteric infections in children,” Archives of Dis-
vol. 6, no. 5, p. 2081, 2019. ease in Childhood, vol. 98, no. 8, pp. 629–634, 2013.
[21] F. Eremutha, B. Hammed Taiwo, M. K. C. Sridhar, and [36] R. Bawankule, A. Signh, K. Kumar, and S. Pedgaonkar,
A. Aluko Olufemi, “Evaluation of sanitary conditions in kuje “Disposal of children’s and its association with childhood
market in Abuja, Nigeria with diverse cultural practices and diarrhea in India,” BMC Public Health, vol. 17, no. 1, 2017.
provision of a dry ecological toilet system,” Sociology and [37] M. Islam, A. Ercumen, S. Ashraf, M. Rahman, A. K. Shoab,
Anthropology, vol. 4, no. 11, pp. 1011–1019, 2016. and S. P. Luby, “Unsafe diposal of faecec of children < 3 years
[22] WHO, Water Sanitation and Hygiene in Health Care Facil- among households with latrine access in rural Bangladesh:
ities: Practical Steps to Achieve Universal Access, World Health association with houdrhold characteristics, fly presence and
Organization, Geneva, Switzerland, 2016. child diarrhea,” PLoS One, vol. 13, no. 4, 2018.14 Journal of Environmental and Public Health
[38] K. Suresh and S. Chandrashekara, “Sample size estimation Emerging Infectious Diseases, vol. 10, no. 6, pp. 1179-1180,
and power analysis for clinical research studies,” Journal of 2004.
Human Reproductive Sciences, vol. 5, no. 1, pp. 7–13, 2012. [52] E. O. Oloruntoba, T. F. Babalola, O. M. Morakinyo, and
[39] National Population Commission (NPC), 2017 Census A. Mumuni, “Effects of improved storage containers on the
Will Complement the Change Agenda, National Population bacteriological quality of household drinking water in low-
Commission, Abuja, Nigeria, 2017, http://www. income urban communities in Ibadan, Nigeria,” Water
population.gov.ng/index.php/material/290-2017-census- Supply, vol. 16, no. 2, pp. 378–387, 2016.
will-complement-the-change-agenda. [53] C. Ssemugabo, S. T. Wafula, R. Ndejjo et al., “Knowledge and
[40] G. K. Genet and H. H. Desta, “Assessment of water and practices of households on safe water on safe water chain
handling and sanitation practices among rural communities maintenance in a slum community in Kampala City, Uganda,”
of Farta Woreda, northwest Ethiopia,” American Journal of Environmental Health and Preventive Medicine, vol. 24, no. 1,
Health Research, vol. 5, no. 5, pp. 119–124, 2017. p. 25, 2019.
[41] J. M. Ibrahim, B. M. Sufiyan, A. A. Oloruko-Oba, A. A. Gobir, [54] S. Lahiri, R. N. Yegbemey, N. Goel, L. Mathew, and J. Puri,
H. Adam, and L. Amadu, “Knowledge, attitudes, and practices Promoting Latrine Use in Rural India, International Initiative
of household water purification among caregivers of under- for Impact Evaluation, New Delhi, India, 3ie Scoping Paper 8,
five children in Biye community, Kaduna State,” Archives of 2017.
Medicine and Surgery, vol. 1, pp. 35–41, 2017. [55] A. E. Toyobo and N. B. Tanimowo, “Evaluation of rural water
[42] S. K. Pradhan, U. Sinha, D. M. Satapathy, A. P. Swain, and supply scheme in selected communities in Oke-Ogun area,
Oyo State, Nigeria,” Global Journal of Science Frontier Re-
R. P. Mishra, “Assessment of household water treatment and
search, vol. 11, no. 9, 2011.
storage practices,” International Journal of Community
Medicine and Public Health, vol. 5, no. 3, pp. 1060–1063, 2018.
[43] UNICEF, Water Sanitation and Hygiene (WASH) in School,
United Nations Interntional Children’s Emergency Fund,
New York, NY, USA, 2018, http://www.unicef.org/
publications/files/CFS-WASH-E-web.pdf.
[44] D. Lantagne and T. Yates, “Household water treatment and
cholera control,” The Journal of Infectious Diseases, vol. 2018,
no. suppl_3, p. S147, 2018.
[45] L. S. Mudau, M. S. Mukhola, and P. R. Hunter, “Cholera and
household water treatment why communities do not treat
water after a cholera outbreak: a case study in Limpopo
Province,” Southern African Journal of Infectious Diseases,
vol. 32, no. 1, pp. 5–8, 2017.
[46] V. B. Reddy, Y. S. Kusuma, C. S. Pandav, A. K. Goswani, and
A. Krishnan, “Water and sanitation hygiene practices for
under-five children among households of Sugali tribe of
Chittoor district, Andhra Pradesh, India,” Journal of Envi-
ronmental and Public Health, vol. 2017, Article ID 7517414,
7 pages, 2017.
[47] B. D. Bitew, T. T. Adafrie, G. A. Biks, and Y. K. Gete,
“Knowledge, attitude, and practice of mothers/caregivers on
household water treatment methods in northwest Ethiopia: a
community-based cross-sectional study,” The American
Journal of Tropical Medicine and Hygiene, vol. 97, no. 3,
pp. 914–922, 2017.
[48] G. Rosa, M. L. Huaylinos, A. Gil, C. Lanata, and T. Clasen,
“Assessing the consistency and microbiological effectiveness
of household water treatment practices by urban and rural
populations claiming to treat their water at home: a case study
in Peru,” PLoS One, vol. 2014, no. 9, p. 12, Article ID e114997,
2014.
[49] G. Rosa, T. Clasen, and P. Kelly, “Consistency of use and
effectiveness of household water treatment practices among
urban and rural populations claiming to treat their drinking
water at home: a case study in Zambia,” The American Journal
of Tropical Medicine and Hygiene, vol. 94, no. 2, pp. 445–455,
2016.
[50] T. F. Clasen and S. Cairncross, “Editorial: household water
management: refining the dominant paradigm,” Tropical
Medicine and International Health, vol. 9, no. 2, pp. 187–191,
2004.
[51] T. F. Clasen and E. D. Mintz, “International network to
promote household water treatment and safe storage,”You can also read