Kenya Water Resources Profile Overview - WATER RESOURCES PROFILE SERIES - Winrock International
←
→
Page content transcription
If your browser does not render page correctly, please read the page content below
WATER RESOURCES PROFILE SERIES
The Water Resources Profile Series synthesizes information on water resources, water quality, the water-related dimen-
sions of climate change, and water governance and provides an overview of the most critical water resources challenges
and stress factors within USAID Water for the World Act High Priority Countries. The profile includes: a summary of avail-
able surface and groundwater resources; analysis of surface and groundwater availability and quality challenges related
to water and land use practices; discussion of climate change risks; and synthesis of governance issues affecting water
resources management institutions and service providers.

Kenya Water Resources Profile Overview
          Water resources are stressed and unevenly distributed throughout Kenya, with approximately 85 percent of the
          country classified as arid or semi-arid. Overall, 33 percent of Kenya’s water resources originate outside of the
          country. Water stressi is high as the total volume of freshwater withdrawn by major economic sectors amounts to
          33 percent of the total resource endowmenti and total annual renewable water resources per person is only 617
          m3, below the Falkenmark Water Stress Indexii threshold for water scarcity.

          Climate change will compound high inter-seasonal variability through increased precipitation and more
          frequent and intense floods. Studies suggest that Kenya will experience net hydrological gains from increased
          precipitation, although droughts are also projected to increase.

          Five major hydropower dams on the Tana River that also support irrigation have decreased wet season flows
          to downstream wetlands. Development plans outline additional dams and expanded irrigation to reduce
          poverty and improve resiliency to drought, which could result in over-abstraction of surface water and impact
          downstream water users and ecosystems.

          Agricultural development and widespread deforestation in the central highlands contribute to increased siltation,
          sedimentation, turbidity, and runoff into downstream watercourses and reduce recharge needed to sustain base
          flow rates of rivers, particularly in the Lake Victoria Basin, which accounts for more than half of Kenya’s freshwater.

          Over abstraction of the Nairobi (Tana Basin) and Merti (Ewaso Ng’iro Basin) aquifers due to poor regulation and
          concentrated demand for domestic and public water supply have lowered water tables. Nationally, groundwater
          is underdeveloped, with approximately one-quarter of total renewable groundwater currently exploited.

          Groundwater quality issues are not well understood. Saline groundwater has been detected in the northwestern
          Turkana region, coastal aquifers, and the Merti Aquifer. High concentrations of naturally occurring fluoride have
          also been detected in parts of the Nairobi Aquifer and throughout the Rift Valley. Pathogenic contamination
          and high nitrate levels caused by the infiltration of agricultural runoff and poor sanitation systems have been
          detected in shallow aquifers along the coast and near Lake Victoria.

          Water resource management responsibilities have been devolved to provincial and county-level authorities,
          however, overlapping roles and responsibilities, institutional capacity constraints, and funding shortfalls
          contribute to sector coordination challenges and impede sound water management.

iSDG  6.4.2 measures water stress as the percentage of freshwater withdrawals against total renewable freshwater resources. The water stress thresholds
are: no stress 100%.
iiThe Falkenmark Water Stress Index measures water scarcity as the amount of renewable freshwater that is available for each person each year. A

country is said to be experiencing water stress when water availability is below 1,700 m3 per person per year; below 1,000 m3 is considered water
scarcity; and below 500 m3 is absolute or severe water scarcity.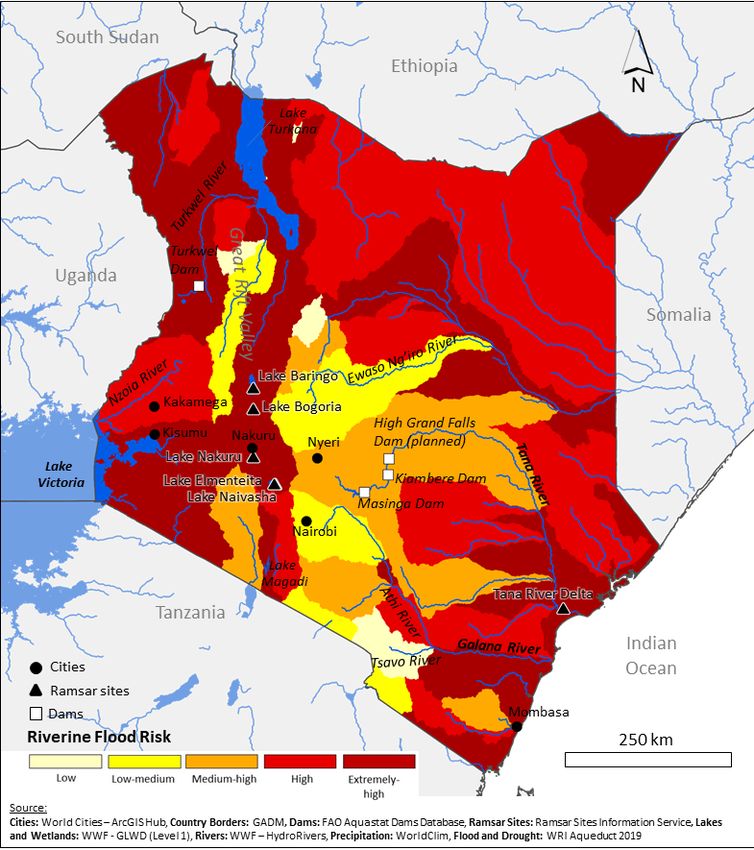
Water Resources Availability
KEY TAKEAWAYS
Most of Kenya is arid or semi-arid and three-quarters of all surface water originate in the central highlands. Lake Victoria and the Tana
River, which is the longest in Kenya, are the two main surface water bodies.
The highest-yielding aquifers are in the Rift Valley, Athi, Tana, and Ewaso Ng'iro Basins, although recharge rates are often very low in
the arid and semi-arid zones.
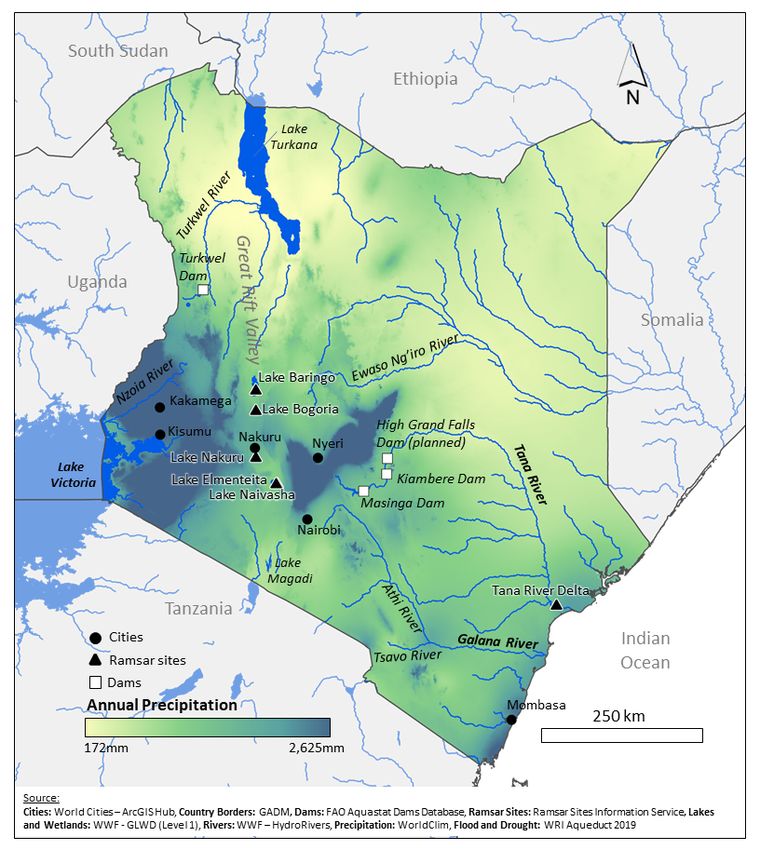
This section summarizes key characteristics of surface and groundwater resources. Table 1 summarizes key water
resources data and Figure 1 presents key surface water resources, wetlands, and dams.
Surface Water Resources through arid and semi-arid lands before discharging
Five basins account for 90 percent of Kenya’s total annual into the Indian Ocean. The Rift Valley Basin is an internal
renewable supply. An estimated 75 percent of surface drainage basin with no outlets. Its headwaters are in the
water originates as precipitation runoff from five “water Mau Forest Complex and it accounts for 14 percent of
towers” in central and western Kenya.5 The Lake Victoria Kenya’s surface water, and includes Lake Turkana, the
Basin is the most productive, accounting for 59 percent world’s largest permanent desert lake, and Baringo,
of surface water and 54 percent of total renewable Naivasha, and Magadi, which range from fresh to brackish
freshwater. It features several important but relatively to saline. The Athi River Basin accounts for less than 6
short rivers that drain into Lake Victoria, including the percent of Kenya’s surface water and extends southwest
Nzoia, Yala, Nyando, Sondu, and Gucha.6 Lake Victoria is from Nairobi through the Athi River, which ultimately
the largest lake in Africa, spanning the borders of Kenya, drains into the Indian Ocean north of Mombasa. The
Uganda, and Tanzania. Over 80 percent of Lake Victoria’s Ewaso Ng’iro Basin covers 36 percent of Kenya in the
renewable water supply is from direct precipitation, while northeast but only accounts for two percent of the
rivers and streams originating in Kenya and Tanzania country’s surface water resources.
account for the rest.7,8 The Tana River Basin supplies 19
percent of freshwater resources and includes the Thika Groundwater Resources
River, which is a key source of water for Nairobi. The Tana Renewable groundwater constitutes less than 12 percent
River is the longest in Kenya and flows 1,050 kilometers of total renewable supply.1 Most boreholes are located
southeast from the Aberdare mountains and Mt. Kenya in central, southwestern, and southeastern Kenya along
TABLE 1. WATER RESOURCES DATA Sub-Saharan
Year Kenya
Africa (median)
Long-term average precipitation (mm/year) 2017 630 1,032
Total renewable freshwater resources (TRWR) (MCM/year) 2017 30,700 38,385
Falkenmark Index - TRWR per capita (m3/year) 2017 618 2,519
Total renewable surface water (MCM/year) 2017 30,200 36,970
Total renewable groundwater (MCM/year) 2017 3,500 7,470
Total freshwater withdrawal (TFWW) (MCM/year) 2002 4,032 649
Total dam capacity (MCM) 2015 10,188iii 1,777
Dependency ratio (%) 2017 32.57 22.78
Interannual variability 2013 3.2 1.55
Seasonal variability 2013 1.9 3.15
Environmental Flow Requirements (MCM/year) 2017 18,570 18,570
SDG 6.4.2 Water Stress (%) 2002 33.24 5.70
Source: FAO Aquastat
iiiThis
excludes the theoretical storage potential of the Owen Falls Dam in Uganda, which would increase national storage by raising Lake Victoria’s
water level, as the Dam currently operates as a run-of-the-river hydropower plant.
2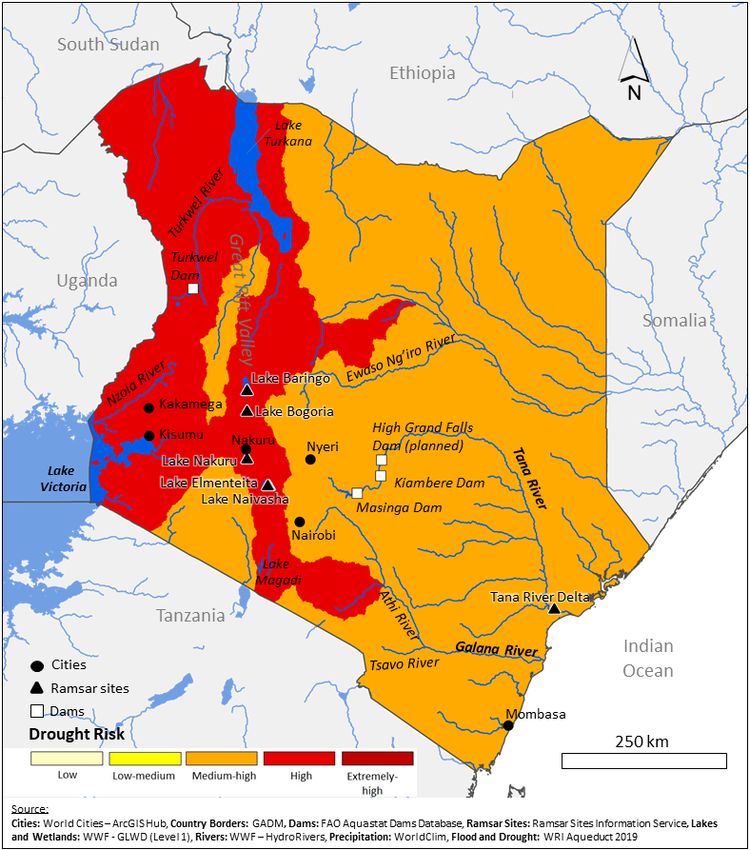
FIGURE 1: MAP OF WATER RESOURCES

                                   3
the coast, however, groundwater is critical in the arid and Ewaso Ng’iro Basins.12 Complex volcanic aquifers,
and semi-arid areas where surface water is less available, especially the Nairobi Aquifer, are deep and semi-
including the Ewaso Ng’iro Basin and the northwestern confined, and underlay shallower, unconfined sedimentary
Turkana County.3 Groundwater salinity in shallow aquifers layers. This creates highly variable well yields as well as
is high throughout drought-prone Turkana County, 9 thickness, depth, and artesian pressure.13 Aquifers in the
however, recent studies have identified large deep Lake Victoria Basin have less total water supply due to
aquifer systems that hold approximately 250,000 million their smaller size. Recharge rates, however, are high at
cubic meters (MCM). Initial testing indicates that these approximately 30 percent.6 Boreholes are deep in most
aquifers have naturally high salinity that may render them locations, with the average depth ranging between 50
unusable for agriculture and domestic use.10,11 and 150 meters (m) across all provinces, although more
shallow aquifers can be found in the coastal plains in the
Kenya’s highest-yielding aquifers are the often-confined east, near Lake Victoria, and in alluvial fans along rivers.13
volcanic rocks underlying the Rift Valley and Nairobi, and
in unconfined sedimentary formations in the Athi, Tana,
Surface Water Outlook
KEY TAKEAWAYS
Approximately 80 percent of total water demand is met by surface water. Irrigation constitutes almost half of total surface water
demand in the Athi and Tana Basins while withdrawals for domestic consumption and industrial use account for the rest.
Surface water demand for irrigation in the Athi and Tana Basins account for half of national surface water use and may soon exceed
renewable supply in the basins. Plans to increase irrigation could lead to a 10-fold increase in surface water use.
Dams on the Tana River generate hydroelectricity and support irrigation, but poor regulation and storage management reduces flow
for downstream users and threatens wetland ecosystems in the Tana River Delta.
Naturally occurring minerals and human activities have reduced surface water quality. Deforestation and soil erosion in the water
towers have increased turbidity, sedimentation, and flooding, and are reducing overall storage capacity in Lake Victoria and Lake
Naivasha. Sediment levels have also increased 15-fold since the 1970s in the Ewaso Ng’iro and Tana Rivers. Agricultural runoff and
untreated industrial effluents has led to eutrophication in the Athi River and its tributaries, as well as Lake Victoria.
This section describes key sources of demand and uses of surface water, and associated challenges stemming
from water availability and water quality challenges.
National irrigation goals could increase stress on and crop irrigation and is almost entirely dependent
surface water by 2030. Kenya’s 2010-2030 National on upstream flows to maintain wetland coverage. The
Water Master Plan (NWMP) proposes a fivefold increase dams have increased minimum flows by 40 percent
in irrigated cropland, which represents a tenfold increase during the short rainy season and decreased maximum
in demand.3,15 This would account for 80 percent of flows by 20 percent during the long rainy season.16,18
renewable water supply.3 Over-abstraction from irrigation Sediment load to the delta has declined by more
already threatens the sustainability of surface water than half, degrading soil and ecosystem health.16 The
in the Tana Basin and Lake Naivasha, one of only two planned High Grand Falls Dam on the lower reaches of
freshwater lakes in the Rift Valley Basin. Commercial the Tana River would be Africa’s third-largest dam with
floriculture and high-value horticulture farms irrigate 2,756 a capacity of 5,600 MCM and could more than double
hectares, abstracting 59.8 MCM/year from the Malewa irrigated cropland. The High Grand Falls Dam, however,
and Gilgil Rivers, which are the main sources of inflow to could further deplete downstream flows, which would
Lake Naivasha. Lake Naivasha, which has nearly dried up impact mangrove forest habitats and pastoral and fishing
during recent droughts, is projected to decline by three livelihoods around the Tana Delta.19
meters as a result of these abstractions.21–23
Total water demand is expected to exceed renewable
Reservoirs on the Tana River have reduced wet season supply in the Athi and Tana Basins by 2030. The Athi
flows to the Tana River Delta and reduced sediment Basin, which supplies Nairobi and Mombasa, is already
load needed to rejuvenate soils and sustain agriculture stressed and inter-basin transfers from the Tana River are
and ecosystems. Five dams on the Tana River produce required to meet demand. The Tana Basin’s maximum
60 percent of Kenya’s hydroelectric power.16 The Tana transfer capacity is 181 MCM/year, namely through the
River Delta, which is a Ramsar site, supports livestock Thika and Sasumua Dams in the upper Tana. Water
conveyed from the Tana Basin is equivalent to 90 percent
4of Nairobi’s water supply24 and covers most demand in Nzoia River, the largest inflow from Kenya into Lake
the Athi Basin.25 However, the populations of Nairobi Victoria, carries effluents discharged from paper mills,
and Mombasa are projected to increase by three million sugar factories, breweries, tanneries, slaughterhouses,
by 2030, which will double domestic water demand to and other industries.33 Raw sewage from Kenya’s
941 MCM/year.3,26 third-largest city, Kisumu, is dumped directly into the
lake, and fertilizer runoff from 1.47 million hectares of
Solid waste, sewage, and industrial effluent contribute surrounding farmland have contributed to eutrophication,
to high levels of biological oxygen demand (BOD), algal blooms, and invasive hyacinth outbreaks.34
heavy metals, and bacteriological contamination, This has resulted in prolonged anoxic dead zones, a
particularly on the Athi River and its tributaries. fivefold increase in algal biomass since the 1960s, and
High BOD levels, indicating significant pollution from water supply reductions due to clogged intakes.34
organic matter, have been measured in the Ngong Eutrophication in Lake Victoria has caused massive fish
and Nairobi Rivers.28,29 Traces of heavy metals such as die-offs35 and a recent study found that 76 percent of
cadmium, chromium, zinc, lead, and copper also exceed endemic freshwater species in the Lake Victoria Basin are
national and WHO guidelines.28,30 E. coli concentrations under threat of extinction.36
also exceed national and WHO guidelines for human
consumption and irrigation of certain crops in the Nairobi Gold mining in the Lake Victoria Basin threatens
River, which is used by over three million people and water quality with heavy metals, especially mercury.
for irrigating 44,000 hectares of farmland.3,31 E. coli has Artisanal gold mining, namely in the Lake Victoria Basin,
been sourced to the Dandora Sewage Treatment Plant provides livelihoods for over 40,000 people.37 Heavy
outside of Nairobi.31 Contaminant loads from agricultural metal contamination in excess of WHO guideline values
and industrial wastes are high and progressively increase for drinking water, including cadmium, lead, arsenic,
on the lower reaches of the Athi River.32 and mercury, has been detected downstream of the
Migori Gold Belt. Maximum mercury values were found
Inflows of untreated industrial effluent, wastewater, to exceed guidelines values ninefold in surface waters
and agricultural runoff have reduced water quality flowing to Lake Victoria.38
and caused mass fish die-offs in Lake Victoria. The
Groundwater Outlook
KEY TAKEAWAYS
Groundwater is underutilized relative to surface water, although it is an important source for domestic water, with most abstractions
occurring in the Athi and Rift Valley Basins.
Concentrated pumping and over-abstraction have depleted the Merti (Ewasgo Ng’iro Basin) and Nairobi (Tana Basin) aquifers. Over-
exploitation of the Nairobi Aquifer has reduced the Athi River’s base flow rate. Over-exploitation has also increased groundwater
salinity in some aquifers.
High groundwater salinity has been detected throughout northwestern Turkana County, along the coast, and in the eastern Merti
Aquifer. High fluoride levels have restricted groundwater development and pose public health risks in northern Kenya, throughout
the Rift Valley, and in the Nairobi Aquifer.
Infiltration from agricultural runoff and poor sanitation have led to high concentrations of nitrate and pathogenic contaminants in
shallow aquifers.
This section describes key sources of demand and uses of groundwater, and associated challenges stemming from
water availability and water quality challenges.
Groundwater is predominantly used for domestic and the Ewaso Ng’iro.14 Public and domestic water supply
needs and irrigation, although there is low risk of in the Athi Basin and irrigation in the Rift Valley Basin
over-abstraction. Only 950.9 MCM of the estimated account for approximately 60 percent of all groundwater
total renewable 3,500 MCM/year is utilized annually.1,14 withdrawals.14
Groundwater accounts for 15 percent of all irrigation
withdrawals, mostly in the Rift Valley Basin, although the Unsustainable groundwater abstraction from the
NWMP projects that 8 percent of new irrigation coverage Nairobi Aquifer is causing the water table to fall and
by 2030 will depend on groundwater. Groundwater is the is reducing base flow rates in downstream reaches of
primary resource for domestic supply for water users not the Athi River. The Nairobi Aquifer is the most abstracted
served by public water systems in all basins except the Tana groundwater source in Kenya and exploitation rates (58
5MCM/year) exceed sustainable yield (37.4 MCM/year).39,40, values.29,42,43 The prevalence of dental fluorosis, which is
iv Studies suggest that the water table underlying Nairobi caused by high fluoride consumption, is estimated to affect
has declined six meters per decade (four meters across 79 percent of the population in this in the Rift Valley.43 In
the regional aquifer). The Athi River’s base flow rates have general, comprehensive water quality mapping is needed
also declined nine percent since the 1950s due to the to better understand fluoride concentrations, which can be
interconnectivity of surface and groundwater systems.40 highly variable within and across aquifers.
The average depth of boreholes is already quite high (about
150m) due to overexploitation of shallow aquifers. In fact, Sedimentary aquifers in the east, along the coast,
the government recommends that new wells should drill and in the northwest have high salinity and total
about 300m to protect the upper aquifer.13,40 dissolved solids attributed to natural sources and over-
abstraction. Total dissolved solids (TDS) in the coastal
Groundwater abstraction from the Merti Aquifer within provinces are well above the WHO’s guideline values,
the Ewaso Ng’iro Basin is reaching unsustainable rates with some aquifers showing signs of seawater intrusion
due to population growth. The Merti Aquifer is commonly caused by over-abstraction.13,44 Concentrated pumping in
exploited for livestock, domestic needs, and to sustain the Daadab refugee camps has altered groundwater flow
large refugee camps in the Dadaab area. Abstraction rates resulting in the mixing of freshwater reserves with saline
(5.3 MCM/year) exceed the aquifer’s recharge rate (3.3 zones in the Merti Aquifer.45 In northwestern Kenya, many
MCM/year), which will create sustainability challenges in of the recently discovered aquifers cannot be feasibly
the long-term as the Merti Aquifer is predominantly non- exploited for human consumption or agriculture due
renewable fossil water.39,v Total water demand in the Ewaso to naturally occurring salinity.10,11 The government has
Ng’iro Basin is projected to increase 13-fold by 2030, which plans to build a groundwater desalination plant in Turkana
will increase projected use of groundwater to 40 percent of County.3,46
renewable supply.3,39
Agricultural runoff and poor sanitation systems
Groundwater quality is predominantly affected by naturally contaminate shallow groundwater resources with
occurring fluoride, high salinity, and are contaminated by nitrates and pathogens. Unlined pit latrines and soak
agricultural runoff and poor sanitation. Collectively, these away pits, which are common in peri-urban and rural
can limit the development and use of groundwater for areas, have introduced bacteriological contamination and
domestic use as well as certain livelihoods. organic compounds into shallow, unconfined aquifers.47
One study conducted in the urban and peri-urban areas
Naturally high fluoride in groundwater is common of Kisumu in the Lake Victoria Basin found that pit latrines
throughout Kenya, and public health risks are with an average depth of four meters were interspersed
particularly high in northern Kenya, the Rift Valley with shallow, poorly protected wells. Coliform bacteria
Basin, and the Nairobi Aquifer. Tests indicate that were consistently detected in well samples, in addition to
naturally occurring fluoride may be widespread. 41 elevated levels of nitrates, chlorides, and other chemical
Boreholes in the Nairobi Aquifer and in Nakuru County contaminants.48 In rural areas such as the Kano Plains
in the Rift Valley have recorded fluoride concentrations outside of Kisumu, manure and fertilizer have also increased
well above the WHO and national standard guidelines nitrate concentrations in shallow wells.49
Water Resources and Climate
KEY TAKEAWAYS
Inter-seasonal water availability is high during long (March-May) and short (October-December) wet seasons. Naturally high inter-
annual variability in precipitation and La Niña-driven droughts will continue to threaten rainfed agriculture and pastoralists, despite
increased precipitation caused by climate change.
The frequency and severity of flooding is projected to increase due to increased rainfall intensity, threatening livelihoods,
infrastructure, and populations nationwide.
This section covers the climate variability and climate change, their impacts on water availability and water quality,
and the risks they pose to local communities and their economies.
Climate change is affecting precipitation patterns and 200 mm in the northeast arid zones compared to 1,800
increasing temperatures. Average annual precipitation mm in the humid zones around Lake Victoria, in the
is only 630 mm, the lowest in East Africa,1,4 and is only highlands, and along the Indian Ocean. Kenya has a
iv
Recharge rate is 109 MCM/year (World Bank). Based on WRMA’s assumption that sustainable yield is conservatively 10 percent of the recharge rate.
See WRMA 2010 and Meyland 2011.
v
Fossil water is nonrenewable groundwater often found in deeper geologic layers and derives from precipitation in prehistoric eras.
6long rainy season from March–May and short wet season particularly vulnerable to drought due to the prevalence
from October–December. Climate change is expected of rainfed agriculture and because 60 percent of livestock
to raise average temperatures by 1.2-2.2 °C by 205050 are in arid and semi-arid lands. The impacts of the 2019
and annual precipitation will increase between five to severely impacted over 3 million people, particularly
six percent, with more precipitation in the short rainy in the northwestern Turkana Region where up to 25
season (October-December). 51 Over the past four percent of the population experienced malnutrition. 56
decades, total rainfall during the long rainy season has
declined in parts of eastern Kenya, whereas short wet Increased precipitation and intense storms due to
season precipitation rates have increased in western and climate change will contribute to frequent and severe
northwestern Kenya.52 Most emissions scenarios indicate flooding nationwide. Climate change is projected to
that precipitation increases will exceed higher evaporation increase extreme rainfall events between seven and
rates and result in net hydrological gains, although the 30 percent later this century.51 Heavy rainfall events,
frequency of extreme drought will also increase. 51,53 coupled with land use changes and development, cause
damaging floods that worsen soil erosion, lead to siltation
Climate change is expected to increase the frequency of watercourses, threaten infrastructure and human life,
of extreme droughts, posing significant threats to spread water-borne diseases, and cause economic losses.57
livelihoods and food security. Kenya is naturally prone Record rains in late 2019 caused extensive flooding and
to drought due to high inter-seasonal and inter-annual landslides in 36 out of 47 counties, displaced more than
variability, with recent severe droughts in 2010-2011, 161,000 people, destroyed more than 8,000 hectares of
2016-2017, and in 2019 driven by La Niña.1,54,55 Kenya is agricultural land, spurred a cholera outbreak, and created
ideal breeding conditions for desert locusts.58,59
FIGURE 2: DROUGHT RISK FIGURE 3. RIVERINE FLOOD RISK
77Water Policy and Governance
KEY TAKEAWAYS
Sector fragmentation and poor coordination, limited funding, and slow progress in the establishment of new WRUAS have impeded
strategic planning objectives for basin management and hydraulic development. Limited implementation of basin management
plans has contributed to land uses that reduce water quality and limited application of environmental mitigation measures.
Sectoral actors often have overlapping mandates and inconsistent priorities, standards, and targets that affect efforts to coordinate
basin management.
The WRA and NEMA lack the financial and institutional capacity to consistently enforce their water quality monitoring protocols,
which are needed to prevent the direct discharge of industrial effluents.
This section provides an overview of key policies, institutions, and management challenges. Key laws, policies,
and plans are summarized in Table 2 and the roles and responsibilities of select transboundary, national, and sub-
national water management entities are summarized in Table 3.
TABLE 2. KEY LAWS, POLICIES, AND PLANS
Name Year Purpose
The Water Act 2016 Establishes the regulatory structure for water resources management,
defines stakeholders’ responsibilities at the national, basin, and county
level, and establishes Basin Water Resource Committees (BWRC).
Water Resources 2019 Key operational planning document for the Water Resources Authority
Authority Strategic (WRA) detailing organizational objectives, activities, resource needs, and
Plan (2018-2022) monitoring and evaluation approaches during the 2018-2022 timeline.
National 2013 Establishes governmental responsibilities for water quality protection,
Environment Policy including the development of basin management plans, emphasizing
(NEP) wetland protection, and espouses user and polluter-pays principles.
National Water 2014 Creates detailed national level plan for development and use of water
Master Plan (NWMP) resources through the 2030 timeframe.
Implementation of water policy is inhibited by low participation and ownership, and the national Water
organizational and technical capacity, monitoring Services Trust Fund (WSTF). However, only 150 WRUAs
and enforcement capabilities, and funding. Following have secured funds from the WSTF. The WRA’s Strategic
the adoption of the 2010 constitution, Kenya devolved Plan calls for increasing its annual budget by 40 percent,
water management responsibilities from the central or approximately $40 million, from the government of
government to counties and basin-level institutions. Kenya, public-private partnerships, and development
The WRA leads water resources policy implementation assistance in order to meet water management goals.61
through a decentralized management structure. The
WRA has developed six Catchment Management Overlapping mandates and non-uniform basin
Strategies (CMS) areas across five hydrological management standards for regulators, service
catchments (Lake Victoria is administratively divided providers, and government ministries and agencies
between north and south), which detail plans for data impede sector coordination. The WRA regulates the use
collection methodologies, water allocation plans, and of surface and groundwater whereas the National Water
public participation. The WRA often lacks resources and Harvesting and Storage Authority (NWHSA), which was
monitoring and enforcement mechanisms needed to established by the 2016 Water Act, develops public water
oversee implementation of the plans.62 WRUAs are meant projects for water harvesting, infrastructure, storage,
to play an important role in local management of water and flood and drought control. The NWHSA, which is a
resources through implementation of Sub-catchment statutory institution of MWSI, does not always coordinate
Management Plans (SCMPs).61 However, only 670 out water permits with the WRA.3 The WRA's 2018-2022
of 1,237 proposed WRUAs have been established due Strategic Plan notes that the water sector's legal and
to resource and capacity constraints within BRWCs, regulatory frameworks and enforcement mechanisms
impeding implementation of CMSs at the sub-catchment need to be strengthened to address these challenges
level. Additionally, WRUAs rely on membership dues, and implement the Water Act.
income-generating activities designed to increase
8TABLE 3. WATER RESOURCES MANAGEMENT ENTITIES
Mandate Institution Roles and Responsibilities
Lake Victoria Transboundary commission under the East African Community, represented
Basin Commission by Kenya, Uganda, Tanzania, Rwanda, and Burundi. Coordinates water
(LVBC) resources management and policy towards economic development goals.
Transboundary
International partnership consisting of 11 countries within the Nile Basin,
Nile Basin Initiative which encompasses the Lake Victoria Basin as part of its upper watershed.
(NBI) Coordinates basin development through a Council of Ministers, Technical
Advisory Committee, and Secretariat.
Ministry of Water, Sets policy on Integrated Water Resources Management (IWRM) and water
Sanitation and services, develops national level plans and strategies for the water sector,
Irrigation (MWSI) and coordinates sectoral actors and investments.
State agency under MWSI that designs and enforces standards and
regulations for the protection and management of water resources at the
Water Resources catchment-level, including flood mitigation and conservation. Manages six
Authority (WRA) regional and 26 sub-regional offices nationwide. Sets fees and distributes
National permits for water use and abstraction. Oversees regional Basin Water
Resource Committees (BWRC).
National
Environmental
Licenses and monitors permit compliance for effluent discharge.
Management
Authority (NEMA)
Highest-level judicial body to resolve water disputes, supported by branch
Water Tribunal
offices nationwide.
Manage water resources in each basin by convening stakeholders from
Basin Water the WRA, agriculture, business, and civil society. Advise WRA officials
Resource of local needs concerning water resource management, water use, and
Committees conservation issues. Submits annual reports and basin area water resources
Sub-national (BWRC) management strategies to WRA. Establish and support county-level Water
Resource User Associations (WRUAs).
Water Resource
Manage water resources at sub-basin level. Resolves local-level disputes
User Associations
over water access and management.
(WRUA)
Water Quality Monitoring effluent discharge through environmental inspections.
Limited funding and data collection and monitoring Both NEMA and WRA may conduct water quality testing
challenges impede surface and groundwater quality to verify self-reporting from permit holders, however,
monitoring systems. The WRA is responsible for effluent monitoring and enforcement is not conducted
monitoring ambient surface and ground water quality. systematically by licensees, NEMA, or WRA.
Limited funding, however, has resulted in irregular
water quality assessments and functionality issues with Water Service Providers (WSPs) are primarily responsible
telemetric monitoring equipment, which are subject to for monitoring drinking water quality, which were
vandalism, exposed to floods, and not well maintained. established by the national Water Services Regulatory
As of 2017, only 69 percent of 274 surface water Board (WASREB). However, many WSPs lack water safety
monitoring stations and 61 percent of 140 groundwater plans and the frequency and sampling protocols vary
stations were operational. From these, only an average significantly. WASREB published guidelines for water
of 28 percent of available water quality data was actually safety plans in 2019 that, if implemented successfully,
transmitted.14 Further, the data obtained from these will contribute to standardization and more rigorous
stations is often limited, with measurements occurring monitoring of drinking water quality by the WSPs.
infrequently and only for limited parameters such as pH,
temperature, conductivity, and salinity.14 WRA and the
National Environment Management Authority (NEMA)
share responsibilities for monitoring the water quality of
9References
(1) FAO. Aquastat Main Database http://www.fao.org/nr/water/aquastat/data/query/results.html (accessed Jul 8, 2020).
(2) FAO. Country Profile - Kenya; 2015.
(3) WRMA. National Water Master Plan 2030; 2013.
(4) USAID. USAID Water and Development Country Plan for Kenya; 2017.
(5) USAID. Promoting Self-Reliance and Community Engagement for Water Towers; 2020.
(6) NEMA. State of the Environment Report 2015-2018; 2018.
(7) Awange, J. L.; Ogalo, L.; Bae, K.-H.; Were, P.; Omondi, P.; Omute, P.; Omullo, M. Falling Lake Victoria Water Levels: Is Climate a Contributing Factor? Clim. Change 2008, 89, 281–297.
(8) Lake Victoria Basin Commission. Special Report on the Declining of Water Levels of Lake Victoria; 2006.
(9) Japan International Cooperation Agency (JICA); Nippon Koei Co., L. THE PROJECT FOR ENHANCING COMMUNITY RESILIENCE AGAINST DROUGHT IN NORTHERN KENYA: ANNEX E
WATER POTENTIAL STUDY IN TURKANA COUNTY; 2015.
(10) Ruvaga, L. Tests Show Kenya’s Turkana Water Unfit for Consumption.” Voice of America, March 10, 2015 https://www.voanews.com/africa/tests-show-kenyas-turkana-water-unfit-consumption
(accessed Jan 27, 2021).
(11) NASA. Vast Water Reserves Found in Drought-Prone Northern Kenya.” NASA Landsat Science, September 12, 2013 https://landsat.gsfc.nasa.gov/vast-water-reserves-found-in-drought-prone-
northern-kenya/ (accessed Jan 27, 2021).
(12) Kuria, Z. Groundwater Distribution AndAquifer Characteristics in Kenya. In Kenya: A Natural Outlook Geo-Environmental Resources and Hazards; Paron, P., Olago, D. O., Omuto, C. T., Eds.; 2013;
pp 83–107.
(13) Barry, B.; Obuobie, E. Groundwater Availability and Use in Sub-Saharan Africa: A Review of 15 Countries; Pavelic, P., Giordano, M., Keraita, B., Ramesh, V., Rao, T., Eds.; International Water
Management Institute: Battaramulla, 2012.
(14) WRA. Water Resources Impact Report; 2017.
(15) Mery Corps. Policy Brief: Achieving Food Security in Kenya Through Smart Solar Irrigation; 2020.
(16) Odhengo, P.; Matiku, P.; Nyangena, J.; Wahome, K.; Opaa, B.; Munguti, S.; Koyier, G.; Nelson, P.; Mnyamwezi; Misati, P. Tana River Delta Strategic Environmental Assessment 2014; 2014.
(17) Baker, T.; Kiptala, J.; Olaka, L.; Oates, N.; Hussain, A.; McCartney, M. Baseline Review and Ecosystem Services Assessment of the Tana River Basin, Kenya; 2015.
(18) Kiringu, K. Consideration of Factors That Affect Flood Levels in the Tana River Delta in Kenya; 2015.
(19) UN Environment Programme. Tapping the Tana https://www.unenvironment.org/news-and-stories/story/tapping-tana (accessed Jan 26, 2021).
(20) Mwangasha, J. British Firm to Build Kenya’s Largest Water Reservoir https://www.constructionkenya.com/933/high-grand-falls-dam-kenya/ (accessed Jan 27, 2021).
(21) Becht, R. Environmental Effects of the Floricultural Industry on the Lake Naivasha Basin http://ftp.itc.nl/pub/naivasha/ITC/Becht2007.pdf (accessed Jan 27, 2021).
(22) Murage, G. Water Levels in Lake Naivasha Drops Further https://www.the-star.co.ke/news/2019-04-24-water-levels-in-lake-naivasha-drops-further/ (accessed Jan 27, 2021).
(23) Mekonnen, M. M.; Hoekstra, A. Y.; Becht, R. Mitigating the Water Footprint of Export Cut Flowers from the Lake Naivasha Basin, Kenya. Water Resour. Manag. 2012, 26 (13), 3725–2742. https://
doi.org/https://doi.org/10.1007/s11269-012-0099-9.
(24) ETC East Africa Ltd. Upper Tana-Nairobi Water Fund; 2012.
(25) Water Resources Authority. Kenya’s Six River Basins https://www.arcgis.com/apps/MapJournal/index.
html?appid=32fcda4882094ffb944544d41edc818c (accessed Mar 19, 2021).
(26) Kenya National Bureau of Statistics. 2019 Kenya Population and Housing Census Results https://www.knbs.or.ke/?p=5621 (accessed Jan 27, 2021).
(27) MOWI. The National Water Resources Management Strategy 2006-2008; 2006.
(28) Bell, B.; Bremner, J.; Cohen, S.; Mulligan, J.; Odbert, C.; Schneider, A. Site, Settlement, Watershed: Nairobi River Basin Baseline Report http://blog.kounkuey.org/wp-content/uploads/2015/02/
Watershed_REV00.pdf.
(29) Water Services Regulatory Board (WASREB). Guidelines on Drinking Water Quality and Effluent Monitoring.
(30) Mbui, D.; Chebet, E.; Kamau, G.; Kibet, J. The State of Water Quality in Nairobi River, Kenya. Asian J. Res. Chem. 2016, 9 (11), 579. https://doi.org/https://doi.org/10.5958/0974-4150.2016.00078.X.
(31) Musyoki, A.; Mbaruk, S.; Mbithi, J.; Maingi, J. Water-Borne Bacterial Pathogens in Surface Waters of Nairobi River and Health Implication to Communities Downstream Athi River. Int. J. Life Sci.
Pharma Res. 2013, 3 (1), 4–10.
(32) Awaya, J.; Gikuama-Njuru, P.; Muendo, P. Suitability of Athi River Water for Irrigation within Athi River Town and Its Environs. Curr. Res. Int. 2016, 6 (4). https://doi.org/10.9734/ACRI/2016/31995.
(33) Kithiia, S. M. Water Quality Degradation Trends in Kenya over the Last Decade. In In Water Quality Monitoring and Assessment; Voudouris, K., Vouts, D., Eds.; InTech, 2012. https://doi.org/https://
doi.org/10.5772/32010.
(34) Odada, E. O.; Olago, D. O.; Kulindwa, K.; Ntiba, M.; Wandiga, S. Mitigation of Environmental Problems in Lake Victoria, East Africa: Causal Chain and Policy Options Analyses. Jouranl Hum.
Environ. 2004, 33 (1), 13–23. https://doi.org/https://doi.org/10.1579/0044-7447-33.1.13.
(35) Gikuma-Njuru, P.; Hecky, R. E. Nutrient Concentrations in Nyanza Gulf, Lake Victoria, Kenya: Light Limits Algal Demand and Abundance. Hydrobiologia 2005, 534, 131–140.
(36) Sayer, C. A.; Máiz-Tomé, L.; Darwall, W. R. T. Freshwater Biodiversity in the Lake Victoria Basin: Guidance for Species Conservation, Site Protection, Climate Resilience and Sustainable Livelihoods,
1st ed.; IUCN, Ed.; International Union for Conservation of Nature, 2018. https://doi.org/https://doi.org/10.2305/IUCN.CH.2018.RA.2.en.
(37) Canadian International Resources and Development Institute. Artisanal and Small-Scale Mining in Migori, Kenya https://cirdi.ca/resource/video-artisanal-and-small-scale-mining-in-migori-kenya/
(accessed Mar 19, 2021).
(38) Ngure, V.; Davies, T.; Kinuthia, G.; Sitati, N.; Shisia, S.; Oyoo-Okoth, E. Concentration Levels of Potentially Harmful Elements from Gold Mining InLake Victoria Region, Kenya: Environmental and
Health Implications. J. Geochemical Explor. 2014, 144, 511–516. https://doi.org/https://doi.org/10.1016/j.gexplo.2014.04.004.
(39) Mumma, A.; Lane, M.; Kairu, E.; Tuinhof, A.; Hirji, R. Kenya Groundwater Governance Case Study; 2011.
(40) Oiro, S.; Comte, J.-C.; Soulsby, C.; MacDonald, A.; Mwakamba, C. Depletion of Groundwater Resources under Rapid Urbanisationin Africa: Recent and Future Trends in the Nairobi AquiferSystem,
Kenya. Hydrogeol. J. 2020, 28, 2635–2656. https://doi.org/UKhttps://doi.org/10.1007/s10040-020-02236-5.
(41) Thole, B. Ground Water Contamination with Fluoride and Potential Fluoride Removal Technologies for East and Southern Africa. In Perspectives in Water Pollution; Thole, B., Ed.; 2013. https://doi.
org/10.5772/54985.
(42) Malago, J. Fluoride Levels in Surface and Groundwater in Africa: A Review. Am. J. Water Sci. Eng. 2017, 3 (1). https://doi.org/https://doi.org/10.11648/j.ajwse.20170301.11.
(43) Gevera, P.; Mouri, H.; Maronga, G. Occurrence of Fluorosis in a Population Living in a High-Fluoride Groundwater Area: Nakuru Area in the Central Kenyan Rift Valley. Environ. Geochem. Health
2019, 41 (2), 829–840. https://doi.org/https://doi.org/10.1007/s10653-018-0180-2.
(44) Idowu, T. E.; Nyadawa, M.; Odondi K’Orowe, M. Hydrogeochemical Assessment of a Coastal Aquifer Using Statistical and Geospatial Techniques: Case Study of Mombasa North Coast, Kenya.
Environ. Earth Sci. 2017, 76 (12), 422. https://doi.org/https://doi.org/10.1007/s12665-017-6738-y.
(45) Oord, A.; Collenteur, R.; Tolk, L. Assessing Risks of Investment in Groundwater Development in Sub-Saharan Africa; 2014.
(46) Mulyungi, P. Kenya to Construct a Desalination Plant in Turkana County https://constructionreviewonline.com/2019/11/kenya-to-construct-a-desalination-plant-in-turkana-county/ (accessed Jan 27,
2021).
(47) Barasa, M.; Crane, E.; Upton, K.; Dochartaigh, O.; Bellwood-Howard, I. Africa Groundwater Atlas: Hydrogeology of Kenya http://earthwise.bgs.ac.uk/index.php/Hydrogeology_of_Kenya (accessed
Jun 25, 2020).
(48) Wright, J. A.; Cronin, A.; Okotto-Okotto, J.; Yang, H.; Pedley, S.; Gundry, S. W. A Spatial Analysis of Pit Latrine Density and Groundwater Source Contamination. Environ. Monit. Assessment2 2013,
185 (5), 4261–4272. https://doi.org/https://doi.org/10.1007/s10661-012-2866-8.
(49) Nyilitya, B.; Mureithi, S.; Boeckx, P. Tracking Sources and Fate of Groundwater Nitrate InKisumu City and Kano Plains, Kenya. Water 20AD, 12 (401). https://doi.org/https://doi.org/10.3390/
w12020401.
(50) USAID. Climate Risk Profile Kenya.
(51) World Bank Group. Kenya Projections https://climateknowledgeportal.worldbank.org/country/kenya/climate-data-projections (accessed Jan 26, 2021).
(52) Gebrechorkos, S. H.; Hülsmann, S.; Bernhofer, C. Long-Term Trends in Rainfall and Temperature Using High-Resolution Climate Datasets in East Africa. Sci. Rep. 2019, 9 (1), 1–9. https://doi.
org/10.1038/s41598-019-47933-8.
(53) Haile, G. G.; Tang, Q.; Hosseini‐Moghari, S.; Liu, X.; Gebremicael, T. G.; Leng, G.; Kebede, A.; Xu, X.; Yun, X. Projected Impacts of Climate Change on DroughtPatterns Over East Africa. Earth’s
Futur. 2020, 8. https://doi.org/10.1029/2020EF00150.
(54) Uhe, P.; Sjoukje, P.; Kew, S.; Shah, K.; Kimutai, J.; Mwangi, E.; van Oldenborgh, G. J.; Singh, R.; Arrighi, J.; Jjemba, E.; Cullen, H.; Otto, F. Attributing Drivers of the 2016 Kenyan Drought. Int. J.
Climatol. 2017, 38, 554–568.
(55) Gro Intelligence. La Niña Brings Drought to East Africa’s Key Grain Producing Countries https://gro-intelligence.com/insights/articles/la-nina-brings-drought-to-east-africas-key-grain-producing-
countries (accessed Jan 26, 2021).
(56) Walsh, G. Responding to drought, hunger and climate change in Kenya https://reliefweb.int/report/kenya/responding-drought-hunger-and-climate-change-kenya#:~:text=Kenya is experiencing
severe drought,with one meal a day.&text=The dry and arid Turkana,drought this year in Kenya. (accessed Jan 26, 2021).
(57) NEMA. KENYA State of the Environment and Outlook 2010; 2011.
(58) OCHA, U. Kenya: Floods Flash Update https://reliefweb.int/report/kenya/kenya-floods-flash-update-no-1-7-may-2020 (accessed Jan 27, 2021).
(59) GEOGLAM. East Africa 2020 Flood Impacts on Agriculture.
(60) Kunene River Awareness Kit. River Basin Organizations http://www.kunene.riverawarenesskit.com/KUNENERAK_COM/EN/GOVERNANCE/SADC/RIVER_BASIN_ORGANIZATIONS.HTM (accessed
Mar 4, 2021).
(61) MWSI. Strategic Plan 2018-2022; 2018.
(62) Kibiiy, J.; Kosgei, J. R. Long-Term Water Planning: A Review of Kenya National Water Master Plan 2030. Water Resour. Manag. 2017, 193–208.
(63) Ministry of Environment and Forestry. WATER TOWERS CONSERVATION AND COORDINATION POLICY; 2019.
10ABOUT THIS PROFILE
This profile was produced by USAID's Sustainable Water Partnership activity.
DISCLAIMER
The author’s views expressed in this publication do not necessarily reflect the views of the United States Agency for International
Development or the United States Government
11You can also read