BALTIMORE'S WATER UTILITY CRISIS AND THE POTENTIAL OF PRIVATIZATION - Studies in Applied Economics - Johns ...
←
→
Page content transcription
If your browser does not render page correctly, please read the page content below
SAE./No.149/February 2020

           Studies in Applied Economics

            BALTIMORE'S WATER UTILITY
            CRISIS AND THE POTENTIAL OF
                   PRIVATIZATION
                                        Hunter Hopkins

  Johns Hopkins Institute for Applied Economics,
Global Health, and the Study of Business Enterprise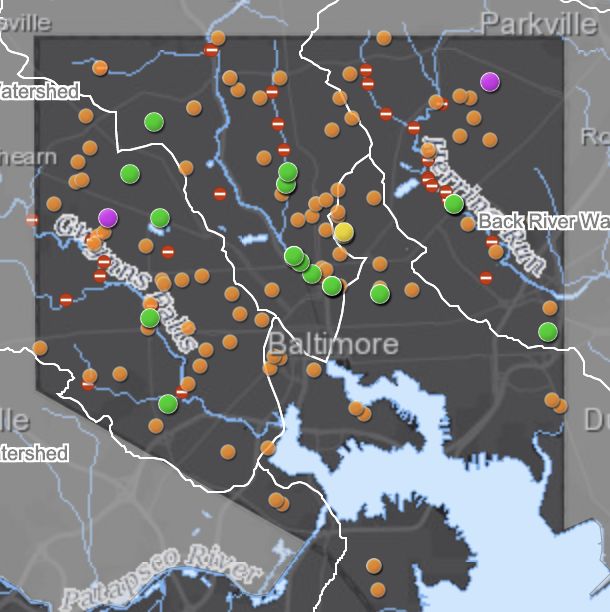
Baltimore’s Water Utility Crisis and the Potential of Privatization
                                      By Hunter Hopkins

                                        About the Series

The Studies in Applied Economics series is under the general direction of Professor Steve H.
Hanke, Founder and Co-Director of the Institute for Applied Economics, Global Health
and the Study of Business Enterprise (hanke@jhu.edu).

                                       About the Author

Hunter Hopkins (hhopkin8@jhu.edu) is a student in the Krieger School of Arts and Sciences at
the Johns Hopkins University in Baltimore, pursuing an Economics and International Studies
double major, expecting to graduate in May 2021. On campus, Hunter is a member of Alpha
Kappa Psi, a coed business fraternity, and is a course assistant for International Marketing.

                                            Abstract

This paper analyzes the Baltimore water utility crisis. In 2018, there were around 64 million
gallons (MG) of water supplied to Baltimore City and County through the public water system
managed by the Baltimore Department of Public Works (DPW). However, before it could reach
consumers, over 16 of the 64 MG leaked as a result of an outdated and mismanaged utility.
This paper explores how Baltimore reached the point where 25% of its water supply leaks
before it reaches consumers as well as how privatization could help solve Baltimore’s water
crisis.

                                      Acknowledgements
I thank Professor Steve H. Hanke and Professor Stephen J.K. Walters for their guidance. I also
thank Spencer Ryan for his edits and comments.

                                               1
Glossary of Terms
Revenue Water / Billed Authorized Consumption: All water consumption that is billed and
authorized, it includes metered and unmetered (estimated) consumption.
Unbilled Authorized Consumption: water consumption that is unbilled but authorized, including
landscaping, frost protection, flushing, and firefighting.
Real Losses: physical water loss from the distribution system, including water loss due to leaks
and breaks in the transmission and distribution mains, service connections, tanks, reservoirs,
and overflow of water in the reservoirs.
Apparent losses: non-revenue water that is not lost through real sources, including water loss
due to customer metering inaccuracies, systematic data handling errors in the meter reading
and billing procedures, unauthorized consumption/theft from the utility, and any calculation,
reporting, and adjustment errors in the water billing.
Water exported: water sold by the water utility to neighboring water systems outside the
utility’s service area.
Contract Operations: water and wastewater public utilities that are outsourced to the private
sector.
2History of the Baltimore Water System
Shortly after Baltimore was incorporated in 1797, the city began to create and maintain water
pumps. In the early 1800s, a stock company known as the Baltimore Water Company formed.
The company used water from Jones Falls and built a reservoir to provide water to the city. In
1854, the Baltimore Water Company was sold to the city of Baltimore for $1,350,000. Since
then, as Baltimore has grown, the city government has continued to add reservoirs, dams, and
filtration plants. The Lake Roland Dam and Reservoir, Johns Fall conduit, Lake Hampden, Mount
Royal Reservoir, Druid Hill Reservoir, and permanent supply lines and a dam at Gunpowder Falls
were all constructed in the mid to late 1800s. In 1918, new land annexed by the city increased
the need and construction of an additional water treatment plant. In the first half of the 20th
century, growing water demands were met with more dam construction and the Ashburn
Filtration Plant. However, since then, only a few refurbishments have taken place (“History of
the Water System”, Baltimore City Department of Public Works, n.d.). The Baltimore water
utility system continues to age, without being updated as necessary. The result, as this paper
will discuss, are high levels of real and apparent water losses.
A Brief Overview Baltimore’s Water Distribution System
Baltimore’s distribution system, referred to as the Central System, delivers treated water to the
surrounding metropolitan area. The service area is around 560 square miles and the system
provides potable water to approximately 1.8 million people. The water distribution system
consists of over 4,500 miles of water mains, ranging from three inches to twelve feet in
diameter. The water mains connect to a series of pumping stations, reservoirs, and elevated
storage tanks; together the system provides water to Baltimore City as well as parts of
Baltimore County, Howard County, and Anne Arundel County (“Distribution.” Baltimore City
Department of Public Works, n.d.).
The Current Water and Wastewater Problem in Baltimore
Open a copy of the Baltimore Sun on any given day, and it is likely there will be a headline along
the lines of “Baltimore experiencing widespread water problems after water main break”
(Jackson, 2019) or “Poe Homes’ water issues continue.” (Merton et al, 2019). These are just a
couple of the many Baltimore Sun articles documenting Baltimore’s Water Crisis. Which leads
one to wonder, just how many main breaks, sewage overflows and other miscellaneous water
and wastewater problems are occurring in Baltimore?
3In December 2018, the Baltimore Sun published an article “By the Numbers: The Toll Winter
Takes on Baltimore’s infrastructure.” The author, Christine Zhang, was able to collect a
comprehensive list of water main breaks in Baltimore from January 2, 2015 to November 30,
2018. The result for the three-year period showed 4234 reported water main breaks. (Zhang,
2019.) Zhang then examined the water main breaks over a one-year period in Baltimore,
finding that most main breaks occur in the winter months. The same cold weather that causes
household pipes to freeze and burst is also known to cause breakage for the larger,
underground water mains. The results are staggering. In January 2018 there were 508 main
breaks in Baltimore city and county, with as many as three dozen in one day.
Water main breaks in Baltimore city and county, Nov ‘17 – Nov ‘18
Number of Main Breaks
Source: Zhang, Christine. “By the Numbers: The Toll Winter Takes on Baltimore’s
Infrastructure.” Baltimore Sun. 18 Dec 2018.
The wastewater system of Baltimore is in as bad a condition, if not worse, than the water
distribution system. In addition to water main breaks, there were over 189 MG of sewage
tainted water that leaked into Baltimore’s waterways in 2018. Rain and heavy snowfall tend to
instigate sewage overflows.
Even the city of Baltimore has acknowledged this wastewater problem and has stated “The
public is advised to avoid direct contact with the receiving waters identified as impacted by
these sanitary sewer overflows (SSOs). The water in all of our streams is considered impaired
and may not meet applicable standards for full body contact recreation, including swimming,
regardless of the impact of a specific sewer overflow. Accordingly, the City discourages full-
4body contact with all surface waters.” (“Sanitary Sewer Overflow (SSO) Public Notice.”
Baltimore City Department of Public Works). The Baltimore City Department of Public Works
(DPW) has created an interactive map outlining these overflows, shown below. The green dots
represent SSOs over 10,000 gallons that have occurred in the last four months. The orange dots
show the same but for under 10,000 gallons, and the yellow dots are for ongoing SSOs.
Source: Sanitary Sewer Overflow (SSO) Map, Baltimore DPW.
Date Accessed: 19/12/19
Each year, the situation seems to worsen. In 2004, there were 622 sewage backups reported in
Baltimore. By 2017, the number had grown close to 5,000. This problem has escalated to the
point that the city is under a $1.6 billion federal consent decree to reduce sewage pollution and
modernize the system, designed over a century ago, by 2030. This new target date is a result of
the city’s failure to meet the original 2016 deadline. Necessary renovations include an upgrade
to the Back River Wastewater Treatment Plant, clearing a 10-mile backup of sewage
underground, and replacing sewage mains amongst other projects. The result of these
problems building up over time is skyrocketing sewer rates. On average, customers in 2017 paid
$30 per month for their wastewater, three times as much as they paid in 2002 (Dance & Scott,
2017).
5Baltimore’s Capital Budgeting Issue
Haleemah Qureshi, a Master of City Planning student at the Massachusetts Institute of
Technology, wrote her thesis on “Binding Civil and Civic Infrastructure: The Need for
Transparency and Accountability in Baltimore’s Water Crisis.” She says civil and environmental
engineers have the technical expertise and knowledge to fix the United States’ infrastructure,
but the problem is paying for it. Baltimore is one of many U.S. cities with decades of
underinvestment resulting in physical deterioration of utilities. The primary causes of
underinvestment are typically considered to be physical invisibility, ease of access, and political
paralysis. Physical invisibility comes from an “out of sight, out of mind” philosophy that often
keeps water utility crises from the forefront until there is a burst or a leak that can no longer be
ignored. Additionally, the ease of access to water systems and distributed safe water in the
United States are taken for granted because they have been readily available for so long.
As a result, large swaths of Baltimore’s water infrastructure remain outdated, with some of the
oldest parts of the system built in 1855. Qureshi focuses her thesis on Baltimore from 2013-
2017 but takes time to note that this is not a new issue. Past studies point to reduced
nationwide infrastructure spending in the 70s and 80s that was not simply due to a lack of
available funds, but primarily the result of budget decisions made by elected officials and voter
who failed to grasp the consequences of deferring infrastructure repairs (Qureshi, 2018).
The DPW’s Budget is divided into operating and capital costs. Operating costs include day to
day costs of running the utilities and administrative costs, while the capital budget is for
construction and acquisition of assets. The DPW’s operating budget is about 20% of the city’s
entire budget, the largest subset (Qureshi & Haleemah N, 2018). However, the DPW annual
budget has been on the decline, with funds allocated to the capital budget taking the biggest
hit. In full year 2014, $1,600 million was allocated to the capital budget, but by 2017, less than
$400 million was given to the capital budget. Given the deterioration of Baltimore’s
infrastructure, if the problem is going to be fixed, the capital budget needs to be moving in the
opposite direction.
6Source: Qureshi, Haleemah. “Binding Civil and Civic Infrastructure: The Need for
Transparency and Accountability in Baltimore’s Water Crisis.” MIT, 2018.
This increased need for capital budgeting is one of several causes leading to heightened interest
in privatization. Hanke and Walters list three main causes for increased interest in private
ownership or management of utilities. The first is local budgetary pressures as a result of the
2008 recession. The second is the old age and general decay of systems. The final reason:
capital spending requirements could reach $1 trillion by 2031, primarily due to federal
regulations surrounding water and wastewater treatment (Hanke & Walters, 2011).
The age of the system and legal regulations have increased the cost of running the water
utilities in Baltimore. While the system was built to last 50 years, the water mains in many areas
now average 75 years and require replacement. As for regulations that have increased the cost
of running utilities, there is the $1.6 billion Consent Decree that was mentioned earlier in this
paper. Baltimore is one of many cities facing increased utility costs as a result of outdated
facilities following the Clean Water Act. In 2002 Baltimore was given a mandate from the
federal government to improve its sewage system. Before the problem could be fixed though,
the source of the problem had to be determined. At that point, the city did not even have
complete maps of the water distribution system and was unaware of the conditions of pipes
underground. One of the main capital budget projects following the consent decree was fixing a
misaligned pipe at the head of the Back River Wastewater Treatment plant, which was causing
a sewage backup for 10 miles. By the end of 2016, this project had cost $900 million, and it is
just the start of necessary fixes outlined by the Consent Decree, which has been extended to
2030 (Qureshi & Haleemah N., 2018).
7Starting in 2014, the DPW has been rehabilitating over 4000 miles of underground water
infrastructure at a rate of 40 miles per year (Qureshi & Haleemah N., 2018). While this is a
start, repairs at a rate of 1% of the system per year would take 100 years to update the system.
At which point, the watermains that were renovated at the beginning will likely already be long
due for an update.
Summary of Baltimore Office of Asset Management: FY 2018 Water Audit
Every year, the Baltimore City DPW Office of Asset Management publishes a water audit. The
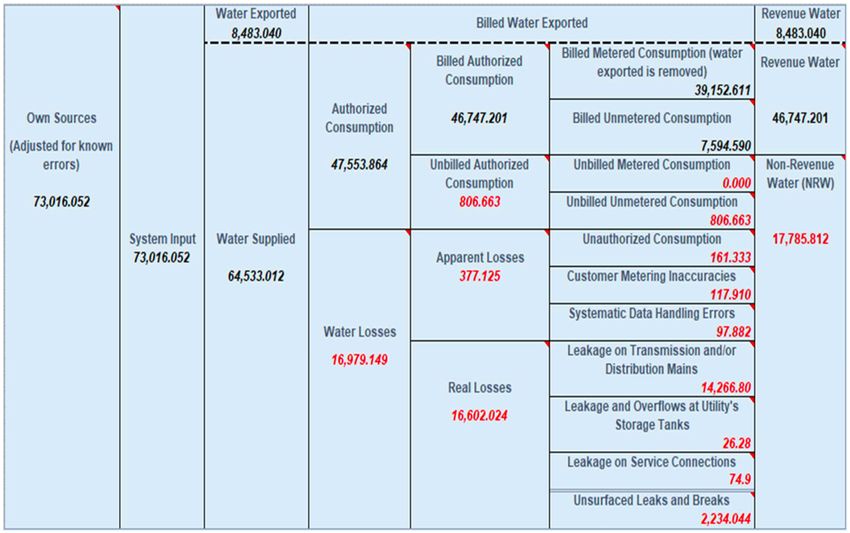
most recent audit is FY 2018. Per the report, 73,016 million gallons (MG) of water were
produced by Baltimore’s three water treatment plants in 2018. 8,483.05 MG of this water was
exported to Howard County, which pays a lump sum for its water. This leaves 64,533.01 MG of
water supplied to Baltimore city and county. However, only 72.4% of this water supplied
becomes revenue water. As depicted by the graphic below, water main leaks and breaks caused
16,602.02 MG of real losses. Meaning 25.7% of the total water supply of Baltimore is wasted
and unbilled. The DPW places a $3.8 million price tag on these losses (Baltimore DPW: Office of
Asset Management, 2019).
Water Balance According to the FY 2018 Water Audit
Source: “FY 2018 Water Audit.” Baltimore DPW: Office of Asset Management. September 2019.
8Following these staggering numbers, it is logical to wonder if this level of water loss is normal
for utility systems like Baltimore. The graph below uses data from the American Water Works
Association’s (AWWA) annual report to compare Baltimore’s real losses in MG to similar sized
systems. Baltimore’s real losses are almost double that of many other systems. Excluding
Philadelphia, which also appears to be experiencing a real loss crisis, every other similar sized
utility system had lower real losses than Baltimore. Based on this data, it can be seen that the
water loss experienced by Baltimore is a result of the mismanagement of an outdated system
and is not inherent to all water utilities.
Real Losses Comparison for Similar Size Systems
30,000
25,000
Real Losses (MG)
20,000
15,000
10,000
5,000
0
b…
em
W
rd
ny
er
t
y…
t
ks
en
ric
at
oa
DP
pa
or
nt
ob
st
tm
st
W
sB
W
m
y
ou
ty
(C
Di
rS
ar
o
tin
Ci
rk
er
C
rC
em
p
er
e
o
llo
De
s
at
at
e
at
Au
rW
e
or
st
W
W
ali
at
yW
er
Sy
m
W
rn
te
ti
o
at
lti
na
ni
er
lle
Be
a
e
W
Ba
W
to
at
l
in
Va
vil
e
ia
An
W
c
m
qu
us
n
ph
as
a
i
ty
rC
Lo
n
er
gh
eg
el
Sa
un
qu
te
ilid
in
sV
Co
rm
ea
bu
Ph
La
Gr
bb
Al
Bi
Co
Source: “FY 2018 Water Audit.” Baltimore DPW, September 2019.
Prepared By: Hunter Hopkins, The Johns Hopkins University
Further supporting this consensus that Baltimore’s real losses exceed what they should is the
calculation of Unavoidable Losses in the Utility (UARL). In which, the Baltimore DPW is able to
calculate the unavoidable losses specifically for the Baltimore System. According to the FY 2018
Water Audit, only 2.8 of the 16 MG of real losses are unavoidable losses. (Baltimore DPW:
Office of Asset Management, 2019).
How to Have Efficient Leak Detection & Control in Baltimore
The Baltimore DPW’s Water Audit divides Baltimore city and county into 10 zones. Leak
detection is used to determine the amount of water lost as a result of leaks and main breaks in
each zone. From this data, it is possible to compare water loss in different zones and determine
the location most in need of refurbishment. However, in the water audit, it was not specified
9how the area to be repaired would be chosen each year. According to the audit, “The city can
greatly benefit from focusing its proactive and reactive efforts on these areas to reduce system
loss.” This view is in line with the cost-benefit model that ought to be used when evaluating the
allocation of capital. “The greatest level of capital replacement expenditure should be given to
areas where leakage is greatest” (Hanke, 1981).
Billing Issues in Baltimore
User fees payed by Baltimore City and County residents make up the principle revenue source
for water and wastewater utilities (Qureshi & Haleemah N., 2018). However, Baltimore has
recently had difficulties with their billing system. In May 2019 there was a ransomware attack
on Baltimore’s computer network, preventing Baltimore from issuing water bills for three
months. Once the system was finally working, Baltimore mailed a combined bill for the months
of May, June, and July. This naturally led to concerned, low-income customers who find it
difficult to pay a $300-400 water bill at one time (Duncan, 2019). Then, in November 2019, the
wrong due dates were printed on 15,000 water bills for Baltimore county residents (Knezevich,
2019). These billing errors are separate from the issue of real losses of the water system, but
they still exemplify the same story of poor management by the Baltimore DPW.
Banning Private Water Utilities in Baltimore
Baltimore, unlike almost every other city in the United States, has chosen to ban water
privatization. In the 2018 election, Baltimoreans voted in favor of Ballot Question E; a charter
amendment that banned any support from professional water companies. While this led many
to consider Baltimore a “public water hero,” in reality banning privatization did not solve any of
Baltimore’s problems (Powelson, 2020).
According to Robert Powelson, president and chief executive officer of the National Association
of Water Companies, “With the passage of Ballot Question E, Baltimore has summarily taken
proven solutions for its water and wastewater system off the table. Baltimore leaders have
allowed activists to turn its water services into a political issue instead of working to address
system deficiencies and improve services to residents” (Powelson, 2020).
Water Accountability and Equity Act in Baltimore
In January 2020, Baltimore enacted the Water Accountability and Equity Act. The new law
created an Office of the Customer Advocate, meant to solve issues of unaffordable or
inaccurate bills. Additionally, the act created a program to ensure Baltimore residents do not
10spend more than 3% of their household income on water services. Third, the act is meant to
hold public works leadership accountable by decreasing delays and overbilling. Many
supporters of the act were also advocates for Baltimore’s infamous law banning privatized
water utilities. One such advocate, Reverend Alvin Gwynn said, “We’ve started to turn things
from upside down to right side up, while keeping profit out of it” (Gwynn, 2020).
Unfortunately, this new act only addresses the symptoms rather than the causes of Baltimore’s
water problems. What Reverend Gwynn failed to mention in his article to the Baltimore Sun is
the 16.6 MG of real losses due to water main leaks and breaks. At the end of the day, the cost
of the water that leaks is incurred by the customer. This act may lower the bills of some
customers, but it does not lower the costs of the water they are consuming, nor does it provide
any concrete way of improving the quality.
Size and Scope of the U.S. Water and Wastewater Contract Operations Market
Given the outdated system, high price tag for repairs, and poor track record for maintaining the
utility, it seems unlikely that Baltimore city is capable of repairing its water utilities alone. It is
time to consider alternatives. One such method is privatization of the utility. There are a
number of private companies with experience in the private water and wastewater
management industries in the United States. A few of the largest companies operating in the
United States include American States Water Company, American Water, Inframark, Jacobs,
Suez, and Veolia. It should be noted this is not an exhaustive list, as there are over 50
companies active in the market, ranging from large national corporations to smaller, regional
firms (National Association of Water Companies [NAWC], 2019).
The National Association of Water Companies (NAWC) represents regulated water and
wastewater companies, as well as companies partnered with municipal utilities. According to
the NAWC, “Contract operators bring many benefits to the municipalities with which they
partner, including more efficient operations, strict environmental and safety compliance,
shared risk liability and guaranteed performance metrics” (NAWC, 2019).
The current size and makeup of the contract operations market was largely unknown until
NAWC partnered with Mazars USA LLP to conduct a study entitled, “U.S. Water and
Wastewater Contract Operations Market Report.” The report is the first to research the water
and wastewater contract operations market and provide an overview of the number of various
contracts throughout the United States. In 2017, the most recent data available, the water
contract operations market was responsible for 761 contracts in the United States, serving over
41.1 million people and handling 6,451 million gallons of water per day (MGD) (NAWC, 2019).
11Having private utilities does not always entail full private ownership. Rather, there is a
spectrum from public to private utilities. The National Association of Water Companies lists four
distinct contract options for utilities: Operations & Maintenance (O&M), Concession, Design-
Build-Operate (DBO), and Design-Build-Operate-Finance-Maintain (DBFOM). This myriad of
contract types is not unique to the United States. Although called different names, private
ownership and management has been successfully implemented in other countries as well,
most notably in France. There, “affermage” refers to the privatization system where municipal
funding is used, but operations are handled by the private company. “Concession” is used to
describe operation contracts where the private company is entrusted with sourcing funds as
well as handling operations (Hanke & Walters, 2011).
With an Operations & Maintenance contract, the public partner contracts with a private
partner to provide a specific service, while the public partner retains ownership, rate setting
authority and overall management, including capital program investment and delivery. This is
the most common partnership in the United States, constituting 94% of utility privatization
contracts. In a Concession contract, a private partner operates, maintains and makes capital
investments in a publicly owned system for a specified period of time, while asset ownership
remains with the public agency. For a Design-Build-Operate contract, a single private partner
designs, builds and operates a facility, while the public partner finances the project. The least
common contract type is Design-Build-Operate-Finance-Maintain, where a single private
partner designs, builds, finances, operates, and maintains a facility (NAWC, 2019). The graphs
below give an idea of the makeup of the contract operations market in the United States. As
can be seen, the majority of contracts are Operations & Maintenance contracts between local,
municipal, or state governments and a private water corporation.
U.S. CONTRACT OPERATIONS CLIENT
BREAKDOWN, 2017
Regional
Local, Authority
Municipal, 6%
State Federal
90% Clients 4%
Source: “U.S. Water and Wastewater contract Operations
Market Report.” NAWC. Mazars USA LLP, 2019.
Prepared by: Hunter Hopkins, The Johns Hopkins University
12U.S. CONTRACT OPERATIONS UTILITY
BREAKDOWN, 2017
Drinking
Water Only
Drinking & 18%
Wastewater
37%
Wastewater
Only 45%
Source: “U.S. Water and Wastewater contract Operations Market
Report.” NAWC. Mazars USA LLP, 2019.
Prepared by: Hunter Hopkins, The Johns Hopkins University
U.S. CONTRACT OPERATIONS TYPE OF
CONTRACT BREAKDOWN, 2017
DBO 3%
O&M
Concession 2%
94% DBFOM 1%
Source: Source: “U.S. Water and Wastewater contract
Operations Market Report.” NAWC. Mazars USA LLP, 2019.
Prepared by: Hunter Hopkins, The Johns Hopkins University
An Explanation of Atlanta’s Failed Water Utility Privatization
In the 1990s, as economic, fiscal, regulatory, and environmental factors complicated water
supply and wastewater systems, many cities considered privatization.
Water privatization was a respectable option for large municipalities in the 1990s. However,
subsequent interest seems to have dwindled. The termination of Atlanta’s contract with United
13Water is often given as an example for the failure of private water contracts. However,
“Atlanta’s experience with water privatization is not typical. Satisfaction with water and
wastewater privatization has been very high, with over 90% of communities choosing to
continue privatization at renewal time” (Segal, 2003).
When United Water took over operations of the Atlanta system in January 1999, they took on
an outdated and uncertain system. At the time, the city was unaware that there was such a
high percentage of treated water leaking between the treatment plant and meters, going
unbilled. As such, many unfounded assumptions went into the contract between Atlanta and
United Water. For instance, the contract assumed 1,171 water meters per year would break,
when in reality the figure was 11,108. Overall, the system required a much higher level of repair
than United Water had assumed in the contract. As such, United Water requested additional
payment from the city. The city refused to pay, saying it was only seeing savings of $3 million
from the partnership. This ultimately led to an early termination of the planned 20-year
contract. However, this case is not a reason to disregard water privatization for cities
altogether. Rather, the problem was ultimately the result of poor data and a lack of record
keeping by Atlanta. As a result of this bureaucratic malfeasance, a realistic baseline of needed
annual repairs was unable to be estimated. A portion of the blame does go to United Water,
who understood the lack of data prior to submitting their $21 million bid for the contract
(Segal, 2003).
There are several important lessons that can be learned from the Atlanta experience, which can
be applied to future private water contracts. First, both sides in a concessions contract must be
diligent in their research prior to entering the contract. Second, contract terms must be specific
and focus on outcomes rather than inputs. Third, the standard utility contract length of three to
five years is perhaps more effective than the twenty-year contract. Finally, strong
communication is needed between both partners in the contract (Hanke & Walters, 2011).
Water Privatization in England and Wales
Sir Ian Byatt, the first regulator of the water and wastewater industry in England and Wales, is
able to offer unique insights into the privatization of infrastructure. In 1989, England and Wales
sold the ten Regional Water Authorities, thereby transferring them from the state to the private
sector. When asked if privatization worked well, Sir Byatt candidly answers, “Replies should be
more nuances: nothing stands still – nor should. Some things went well, and policy still needs to
move on” (Byatt, 2019, P. 301).
14Reflecting on his experience, Sir Byatt notes some important regulatory aspects that can
facilitate successful privatization of water and wastewater utilities. One of which is that England
introduced a special merger policy to preserve comparative competition. Byatt notes “there is
little evidence of economies of scale in networks beyond the low level.” Thus, it was valuable to
customers to prevent the ten regional monopolies from amalgamating into a single national
monopoly (Byatt, 2019, p. 306).
Equally vital to successful privatization is establishing price cap regulation for private utilities.
“Prices were reviewed every five years and set for five years ahead. This provided powerful
incentives to reduce operating expenditure (broadly a third of total costs of supply) and allowed
for a substantial increase in the quality of drinking water and wastewater” (Byatt, 2019, p. 307).
In England and Wales, during the first decade of privatization: customer service improved,
operating costs decreased, and output, adjusted for quality, rose almost 50%.
Examples of Water Privatization Successes
Jersey City, NJ and Boise, ID are two of many examples of successes in the water utility contract
operations market. In 1996, SUEZ, one of the largest international private utility companies, and
Jersey City entered the largest U.S. water service partnership of its time. The SUEZ-Jersey City
Contract has been renewed several times due to high satisfaction and continued success. Since
its inception, the partnership has helped save the city at least $40 million while also allowing for
needed restoration to the utility (“Building a sustainable future for Jersey City, NJ.”, SUEZ).
Boise, ID is another example of success with privatization. Ada County, where Boise is located,
is a rapidly growing area. The population grew more than 8% between 2010 and 2014. This sort
of growth can be disastrous for cities whose utilities are not prepared to accommodate the
influx of users. However, SUEZ was prepared for growth and invested the capital necessary for
new treatment plants and updated technology. This past success has led to a continued
partnership with Boise (“Building a sustainable future for Boise, ID”, SUEZ).
According to Adrian Moore, an infrastructure expert, “Private Utilities simply borrow the money
to build new water supply pipelines or treatment plants when they need them, and they have
every incentive to build them fast and keep costs down.” However, governments suffering
bureaucratic inefficiencies must go through lengthy approval processes and fight against hordes
of other political priorities in order to receive funding for improvements (Park, 2018). This
fundamental difference in the organizations and incentives provides a theoretical basis for the
superior capability of private entities to manage utilities. Examples such as Jersey City and Boise
support this theory and appear to represent the industry norm. Research speaks to the
15efficiency of private partnerships. One study of U.S. systems found operating costs savings for
private partnerships range from 10-40%. Additionally, 40% of publicly operated sampled
facilities failed to comply with federal clean drinking water standards, but within just one year
of a public-private partnership, 100% were in compliance (Hanke & Walters, “Reflections on
Private Water Supply: Agency and Equity Issues”, 2011).
Addressing the Natural Monopoly Problem
“An industry is usually said to be a natural monopoly if production can be conducted most
efficiently by a single entity. This will generally be the case if unit costs are declining over the
entire relevant range of the market demand for a product – that is, in cases where there are
massive economies of scale in the production of a good” (Hanke & Walters, “Privatizing
Waterworks: Learning from the French Experience”, 2011). Utilities, such as the water and
wastewater industries, fit this natural monopoly description well. Hanke and Roland W.
Wentworth have analyzed field data that strongly supports lower costs for one utility as
opposed to two utilities operating in the same space. Given that utilities are a natural
monopoly, it can be difficult to produce the competition needed to best benefit the consumer.
It has often been argued that hiring a private firm to run a utility is no better than having the
government run the utility, because either option will lead to monopolistic practices. However,
Edwin Chadwick, an urban sanitation reformer, proposed a solution to this dilemma. Chadwick
wisely recognized that “those markets most cheaply served by a monopoly need to be afflicted
with monopolistic conduct so long as there is meaningful competition for the rights to the
monopoly franchise” (Hanke & Walters, “Privatizing Waterworks: Learning from the French
Experience”, 2011, p. 32-33). This meaningful competition takes the form of many private
companies bidding on the right to run a utility. However, it is important that the utility is not
simply given to the bidder willing to pay the most, as that would raise the price of the utility to
the present value of expected profit. The key to the bidding process, in order to best benefit
the consumer, is to grant the utility to whichever bidder promises the best combination of
selling price and quality to the customer.
Critics of this theory question the competitiveness of the process. Indeed, there are examples
of a lack of competition leading to failures. One case is Cochabamba, Bolivia. In Cochabamba, a
single bidder won a contract with an implied 15 percent return on investment. The firm
promised to handle the utility’s pre-existing debt while also building new facilities. The end
result of this debacle was protests over 38 percent increases in water rates (Hanke & Walters,
“Reflections on Private Water Supply: Agency and Equity Issues”, 2011). However, as
mentioned earlier in this paper, this is not the norm, and there are over 50 private utility
16companies currently contracting in the United States. These companies compete for contracts
and will continue to do so. The 90 percent success rate of renewed contracts speaks to the
fulfillment of efficiencies promised by the majority of these utility contracts (Hanke & Walters,
“Reflections on Private Water Supply: Agency and Equity Issues”, 2011).
Conclusion: Why Baltimore is a Strong Candidate for Water Privatization
As outlined in this paper, Baltimore’s water and wastewater utilities are outdated and
dysfunctional as a result of years of bureaucratic malfeasance. The city failed to make necessary
repairs in a timely manner, and the problem has now escalated to the point where 25% of the
water supply leaks: a waste of water and a burden to taxpayers.
In 1993 the Environmental Protection Agency (EPA) published a “quiz” for municipal
wastewater utilities (The National Academies Press, 2002). The EPA said, if a public utility
responds ‘yes’ to most of the following questions, then it should consider using contract
operations and maintenance. The list of questions included: Does your municipality experience
Design problems? Excessive costs? Personnel problems? Public-images issues? Operating
inefficiencies? Compliance difficulties?
Baltimore certainly answers yes to many of these questions. The misalignment of the pipe at
the head of the Back River Wastewater Treatment plant, having caused a sewage backup for 10
miles, is an obvious example of design problems. Excessive costs are seen through the recent
increase of water rates for Baltimore citizens. The Baltimore Sun has published a plethora of
articles highlighting the failures of the Baltimore water system, certainly leading to public-
image issues. And most grievously, the 16 MG of real losses highlight serious operating
inefficiencies.
Privatization is perhaps Baltimore’s only hope of solving its water utility crisis. Familiar with
Baltimore’s water woes, private utility companies, such as Veolia and SUEZ have expressed
interest in managing the city’s water. However, Baltimore, with its charter amendment, is
currently prohibited from privatizing its water system (Park, 2018).
This amendment represents what some call “asset hoarding in the public sector” (Hanke, 1982,
p. 660). Because government officials do not have to pay rent for the assets they control, the
assets tend to be viewed as free. Additionally, if a public asset is sold, the revenue often does
not go to the department who made the sale. Thus, little incentive to liquidate exists.
Furthermore, if the assets a government manages decrease, then employment opportunities
are diminished. While this asset hoarding may allow bureaucrats to keep their jobs, it is not in
17the best interest of citizens. In order to privatize the Baltimore water utility, the charter
amendment needs to be revoked. Overall, “The privatization of waterworks and the proper use
of competitive franchising can and should generate substantial benefits for consumers and
reduce resource waste by society as a whole” (Hanke & Walters, “Privatizing Waterworks:
Learning from the French Experience”, 2011, p. 35).
18References
“Building a sustainable future for Boise, ID.” SUEZ. https://www.suez-na.com/en-us/our-
offering/municipalities/what-are-you-looking-for/services/water-network-management.
“Building a sustainable future for Jersey City, NJ.” SUEZ. https://www.suez-na.com/en-us/our-
offering/municipalities/what-are-you-looking-for/water-management-and-
operations/water-distribution.
Byatt, Ian. “A Regulator’s Sign-Off: Changing the Taps in Britain. The Monetization and
Privatization of the Water and Wastewater Industry.” Short Run Press Ltd, Exeter, 2019.
Dance, Scott. “Baltimore officials approve $1.6 billion, 13 year sewer repair plan.” Baltimore
Sun. 9 August 2017. https://www.baltimoresun.com/maryland/baltimore-city/bs-md-ci-
sewer-consent-decree-20170808-story.html.
“Distribution.” Baltimore City Department of Public Works.
https://publicworks.baltimorecity.gov/pw-bureaus/water-
wastewater/water/operations/distribution.
Duncan, Ian. “Baltimore expected to begin issuing water bills again this week, three months
after ransomware struck.” Baltimore Sun. 5 August 2019.
https://www.baltimoresun.com/maryland/baltimore-county/bs-md-co-water-bills-
20191101-j5356u5mjvf6tnue65tkfsqdyi-story.html.
“FY 2018 Water Audit.” Baltimore DPW: Office of Asset Management. September 2019.
Gwynn, Alvin. “City Ban on Privatizing Water System was Right Thing to Do.” Baltimore Sun,
February 10, 2020.
Hanke, Steve H. “Distribution System Leak Detection and Control.” Water Engineering and
Management, no. 81, 1981.
Hanke, Steve H. “The Privatization Debate: An Insider’s View.” Cato Journal, vol. 2, no. 3, Winter
1982.
Hanke, Steve H., and Stephen J.K. Walters. “Privatizing Waterworks: Learning from the French
Experience.” Journal of Applied Corporate Finance, vol. 23, no. 3, 2011, pp. 30–35.
Hanke, Steve H., and Stephen J.K. Walters. “Reflections on Private Water Supply: Agency and
Equity Issues .” Journal of Applied Corporate Finance, vol. 23, no. 3, 2011, pp. 36–40.
“History of the Water System.” Baltimore City Department of Public Works.
https://publicworks.baltimorecity.gov/pw-bureaus/water-wastewater/water/history.
19Jackson, Jerry. “Baltimore Experiencing widespread water problems after water main break.”
The Baltimore Sun, July 8, 2019. https://www.baltimoresun.com/maryland/117052565-
132.html.
Knezevich, Alison. “Wrong due dates printed on Baltimore County water bills.” Baltimore Sun. 1
November 2019. https://www.baltimoresun.com/maryland/baltimore-county/bs-md-co-
water-bills-20191101-j5356u5mjvf6tnue65tkfsqdyi-story.html.
Merton Ferron, Karl Sanders, Denise. “Poe Homes’ water issues continue.” Baltimore Sun. June
23, 2019. https://www.baltimoresun.com/maryland/baltimore-city/116934423-132.html.
Park, Carol. “It’s not too late to privatize Baltimore’s water system; here’s why we should.”
Baltimore Sun. 21 October 2018. https://www.baltimoresun.com/opinion/op-ed/bs-ed-
op-1022-privatize-water-20181018-story.html.
Powelson, Robert. “Privatize city’s troubled water system.” Baltimore Sun. 6 February 2020.
Privatization of Water Services in the United States: An Assessment of Issues and Experience.
“Chapter 4: Models of Water Service Provision - Considering Private Operations and
Maintenance: EPA’s Quiz for a Municipal Wastewater Utility.” The National Academies
Press. 2002. Pg. 56 https://www.nap.edu/read/10135/chapter/6#65.
Qureshi, Haleemah N. “Binding Civil and Civic Infrastructure: The Need for Transparency and
Accountability in Baltimore’s Water Crisis.” Massachusetts Institute of Technology. June
2018.
https://americanwatershutoffs.mit.edu/sites/default/files/documents/Haleemah%20Qur
eshi_Thesis_FINAL.pdf.
“Sanitary Sewer Overflow (SSO) Public Notices.” Baltimore City Department of Public Works.
Interactive Map.
https://baltimoredpw.maps.arcgis.com/apps/webappviewer/index.html?id=a0fccbcf7826
4aab91df8b6cf1466c32.
Segal, Geoffrey. “What Can We Learn From Atlanta’s Water Privatization.” Reason Foundation.
21 January 2003. https://reason.org/commentary/what-can-we-learn-from-atlanta/.
“U.S. Water and Wastewater contract Operations Market Report.” NAWC. Mazars USA LLP.
2019. https://mazarsusa.com/ledger/u-s-water-wastewater-contract-operations-market-
report/.
Zhang, Christine. “By the Numbers: The Toll Winter Takes on Baltimore’s infrastructure.” The
Baltimore Sun. 18 December 2018. https://www.baltimoresun.com/maryland/bs-md-
infrastructure-by-the-numbers-20181211-story.html.
20Zhang. “Water main breaks.” GitHub. 18 December 2019. https://github.com/baltimore-sun-
data/winter-woes-
infrastructure/blob/master/input/Water%20Main%20Breaks%20121418.csv.
21You can also read