Youth Movement: Accelerating America's Urban Renaissance - Joe Cortright June 2020 - City Observatory
←
→
Page content transcription
If your browser does not render page correctly, please read the page content below
Youth
Movement:
Accelerating America’s Urban Renaissance

Joe Cortright                       June 2020

                               cityobservatory.org
Executive
Summary

What is the future of the nation’s cities? The      The “young and restless”— 25- to 34-year-olds
latest census data, presented in this report,       with at least a four-year degree —are
shows that far from reversing, the movement of      concentrating in the close-in neighborhoods
talented young adults to urban centers is not       of large metropolitan areas.
only continuing, but is accelerating. The
number of 25- to 34-year-olds with a college           •   Their numbers have increased by 32
degree or higher living in close-in urban                  percent since 2010, to 1.3 million
neighborhoods has increased in every one of            •   A widespread trend: increasing in every
the nation’s large metro areas since 2010.                 large US metro area
                                                       •   Driving city growth: accounting for 50
In the midst of a pandemic, there are panicked             percent of the increase in population in
predictions that America’s urbanism is over.               close-in neighborhoods
But the latest data on home search activity            •   Well-educated young adults are 2.5
gathered by Zillow in April, 2020 show that the            times as likely to live in close-in
market share of urban searches is increasing,              neighborhoods as other Americans
and market share of suburban searches is
decreasing. Independently, data gathered by
ApartmentList.com show an increase in search        This is yet another premature and exaggerated
activity in New York City, leading their analysts   obituary for America’s urban revival. We were
to conclude: “The pandemic is not scaring           told technology would obviate the need to be in
renters away from New York.”                        urban locations, because the Internet would
                                                    "flatten" the world. We were told that the fear

                                                                                                  2
of terrorism after 9/11 would prompt people to The movement of young adults to close-in
move out of the city. neighborhoods has fueled overall population
growth in these areas. After recording stagnant
The best predictor of what’s likely to happen in population growth in the decade between 2000
the years ahead are the powerful trends we’ve and 2010, close-in neighborhood population
observed recently. The record of the past grew 7.5 percent, from 9.4 million to 10.1
decade shows that there's a strong and million. The increase in college-educated 25- to
sustained demand for urban living, and the 34-year-olds accounted for a majority of the
movement and concentration of talented net increase in population in close-in
workers to the heart of the nation's cities. This neighborhoods since 2010.
report shows that since 2010, the movement of
well-educated young adults to close-in urban This report defines close-in urban
neighborhoods is universal and accelerating. neighborhoods as Census Tracts within three
miles of the center of a region’s principal
business district, places that generally have the
All of the 52 most populous US metro areas densest housing, and accessibility to jobs,
recorded an increase in the number of 25- to stores and services. The three-mile radius
34-year-old residents with at least a four-year provides a consistent measure, comparable
college degree living in close-in neighborhoods. across metropolitan areas, and serves as an
indicator of the relative health of dense urban
Well-educated young adults are nearly two and neighborhoods in the nation’s largest cities.
a half times more likely to live in close-in urban
neighborhoods than other residents of large US The concentration of talent in cities, and within
metro areas. That relative preference for cities, in close-in urban neighborhoods is a key
central neighborhoods has increased steadily to characteristic of the increasingly knowledge-
an all time high. based, urban economy that primarily drives US
economic growth. Two-thirds of the nation’s
More than 1.3 million 25- to 34-year-olds with 25- to 34-year-olds with a four-year degree live
a four-year degree or higher level of education in one of the nation’s 52 largest metro areas.
lived in these close-in neighborhoods according
to the latest Census data, an increase of more The ability of cities to attract and retain
than 32 percent since 2010. talented young workers is essential to their
economic success. There’s growing evidence
Contrary to press accounts that young adults that the most productive and high-paying
are somehow growing disenchanted with urban employers are tending to locate and expand in
living, this report shows that well-educated urban locations to take advantage of the
adults are disproportionately concentrated in concentration of talent.
the most central urban neighborhoods, and
that the growth of this demographic in those Because highly innovative and productive firms
neighborhoods has actually accelerated are the foundation of any successful regional or
through 2018, compared to earlier periods. The national economy, having an urban
rate of growth of well-educated young adults in environment that both attracts and retains
close-in neighborhoods accelerated in the past these talented workers is an essential part of
six years compared to the previous decade in any local economic development strategy.
40 of the 52 largest metropolitan areas.
The movement of talented workers to cities
also provides an opportunity to promote
3greater socioeconomic and racial-ethnic This report is based on data from the Census
diversity in cities. In earlier decades, well- Bureau, and compares the latest data from the
educated and disproportionately white five-year 2014-18 tabulation of the American
households decamped to suburbs, leaving cities Community Survey with comparable data from
that were often segregated and economically 2010 and from the Decennial Census of 2000,
isolated. As the work of Raj Chetty and others as presented in our 2014 report “The Young
has shown, the prevalence of economically and Restless and the Nation’s Cities.”
segregated neighborhoods in US metropolitan
areas has been devastating to the upward
economic mobility of poor kids in many cities.
4Introduction
This report looks at the growing and a survey on attitudes about place and moving.
widespread tendency of well-educated young The result was “The Young and Restless,”
adults in the United States to increasingly which presented our initial findings (Cortright
choose to live in dense and central urban & Coletta, 2004).
neighborhoods in large metro areas in the US.
In this report, we update the data and analyses We concluded that the economic futures of
spelled out in our 2014 report, “The Young and cities and smart young people were closely
Restless and the Nation’s Cities.” This report intertwined. We found that 25- to 34-year-old
finds that the key trends we identified then college graduates were among the most likely
have not only continued, but accelerated, with to move of any demographic group, and that
the number of college-educated young adults they were systematically moving toward some
growing in the urban centers of every one of places and away from others. And, to an
the nation’s large metro areas, and that rate of apparently unprecedented degree, those moves
growth actually accelerating since our earlier seemed to be motivated by a desire for urban
report in four-fifths of them. living.
That 2014 analysis was City Observatory’s To set the context for this report, it’s helpful to
inaugural report, but we’ve been exploring the start with the answers to a few basic questions:
role played by well-educated young adults in
driving urban revitalization for more than a Why cities? There are many practical reasons
decade before that. Along with long-time to focus on cities. A majority of Americans live
collaborator Carol Coletta, we worked with an in one of the nation’s fifty-or-so largest metro
alliance of six cities around the nation in 2003 areas, each of which is anchored by a central
and 2004 to closely study what, at the time, city. During this past economic expansion,
was a nascent and largely unrecognized trend these metro economies have been the principal
of well-educated young adults living in dense engine of US economic growth (Lehner, 2017).
urban neighborhoods. We gathered an array of City economies have also long been places of
demographic data on the nation’s largest metro opportunity, enabling people to acquire skills,
areas, and did detailed interviews and focus find jobs and start businesses (Glaeser, 2011).
groups around the country. We commissioned
5Who are “the young and restless?” By young more affordable—as well as more mobile—than
and restless, we specifically mean persons aged older workers.
25 to 34 who have completed at least a four-
year college degree. Because age and What’s a “close-in” urban neighborhood? For
educational attainment are asked by the this report we use a single, fixed geographic
American Community Survey, we can develop a measure to identify “close-in” neighborhoods.
geographically detailed, time series analysis of We start from the center of the central business
where this group lives. In this report, we use district of each large metropolitan area, and
the terms “well-educated young adults,” “25- to then draw a circle with a radius of three miles
34-year-olds with a four-year degree” and around that spot, and count the number of
“young and restless” interchangeably. persons living in that circle by age and
educational attainment. We’ve chosen this
It’s important to note that our research focuses uniform, distance-based measure over
on a particular age group, rather than a birth compiling data for individual municipalities or
cohort. The terms “Millennial,” “GenX” and counties chiefly because the wide variation in
“GenY” are often used to describe different boundaries among cities and counties makes
birth cohorts, and to track the movement of a accurate cross-sectional comparisons difficult
generation as it ages. Our approach is different, and potentially misleading. The three-mile
instead comparing people who are young radius serves an indicator of the relative health
adults in one year to people who were the same of dense urban neighborhoods. More details on
age in previous years. The generational method data, definitions and methodology are provided
looks at the same people at different ages; our in the appendix.
approach looks at different groups of people at
the same age.
A growing body of
Why do they matter economically? As we’ve
increasingly become a knowledge driven research
economy, educational attainment has become a
stronger determinant of both personal and Since we released our reports in 2004 and
regional economic success. There’s an 2014, there has been a wealth of academic
extremely strong correlation between the studies that confirm the broad outlines of our
educational attainment of an area’s population findings
and the fraction of its adult population that has
completed a college degree. Three Columbia University economists looked
at decades of data on population change in 27
Young college graduates are especially large metro areas and concluded that the
important to determining the educational growing demand for accessible urban locations
attainment of a metropolitan area. A 24-year- was driven by the time pressure faced by
old graduate is more likely than any other younger, dual-earner households. City
person to move across state lines, and upwards locations helped minimize commute distances
of a million graduates move each year. And and provide convenient access to a range of
today’s 25- to 34-year-olds are more likely to consumer services (Edlund et al., 2015).
have completed a four-year degree than
previous generations; moreover, because their Nathaniel Baum-Snow of the University of
education is more recent, it’s likely that Toronto, and Daniel Hartley of the Cleveland
employers view them as both more flexible and Federal Reserve Bank looked at migration
trends to and from neighborhoods within 2
6kilometers of central business districts, to central cities when compared to older
between 1980 and 2010, and found generations when they were at the same age,
outmigration in earlier periods reversed, as suggesting that these young adults are making
highly educated workers moved closer to city a longer term commitment that is likely to
centers (Baum-Snow & Hartley, 2019). shape cities for some time (Raymond et al.,
2018). It appears that a preference for urban
Victor Couture of the University of California work, living and leisure is a deeply seated
Berkeley and Jessie Handbury of the University generational shift; the Urban Institute reports
of Pennsylvania report that the number of well that its surveys show that 55 percent of young
educated young professionals increased in the adults spend time in the principal city of their
central business districts of nearly every large metro area on a daily basis, rates considerably
US city between 2000 and 2010. Their research higher than for older generations (Scott et al.,
emphasizes the decidedly different 2020).
consumption preferences of young adults and
the importance of local urban amenities, and The remainder of this report proceeds in three
concluded that these location patterns are not parts. First, we look at the “young and restless”
driven by temporary trends (Handbury & as a group, counting the number of people aged
Couture, 2015). 25 to 34, and measuring their educational
attainment. We show how this group has
Like Edlund, et al, Stanford University’s Yichen grown nationally, and in large metropolitan
Su explores the importance of central urban areas, since 2000. Second, we focus in on the
locations providing greater convenience and close-in urban neighborhoods of large
accessibility to higher earning, but time- metropolitan areas, drawing a three-mile circle
pressed households. Demanding work around the center of each downtown, and
schedules coupled with the need to frequently counting its population, and the number of
work long hours raises the cost of leisure time young and restless. We trace the growth of
for many professionals. These high skilled these neighborhoods, and the role played by
workers find even expensive central locations well-educated young adults. Third, we conclude
worthwhile because of the savings they provide by reflecting on the broader implications of this
in time, both in commuting, and in leisure and research for thinking about urban change, for
consumption (Su, 2018). Similarly, Lee, Lee understanding whether cities are still rising, or
and Shubho find that young adults are have peaked, and how concerns about the
particularly drawn to close-in, mixed-use current pandemic are likely to affect the future.
neighborhoods with concentrations of
shopping, food services, entertainment, and
that the demand for this kind of neighborhood About City
increased notably in the decade after 2000
(Lee et al., 2019). Observatory
While most young adults in city centers rent City Observatory is a virtual think tank,
their homes, leading some to question the contributing original, data-driven research and
durability of this trend, an analysis of regular commentary on what matters to city
homebuying patterns looked at the propensity success, focused on how building great places
of different age groups to purchase homes to live can attract, develop and harness talent
within one mile of the center of the central to create widely shared opportunity. Learn
business district. It found that that Millennial more at www.CityObservatory.org.
homebuyers consistently chose locations closer
7The Young &
Restless
The United States has 15.6 million young adults educated than any of its predecessors. Today,
who have completed at least a four-year college 35.0 percent of 25- to 34-year-olds have
degree. We focus on this particular completed at least a four-year degree. That’s
demographic group because we think it plays higher than the rate for all adult Americans
an important role nationally and locally. (about 31.5 percent). It’s also noticeably higher
than it was for previous generations of young
They have the human capital that powers the adults. The fraction of 25- to 34-year-olds who
nation’s economic growth. Fast growing have completed at BA or higher degree has
technology and service companies depend on increased from 27.5 percent in 2000 to 35.1
the availability of these talented young workers percent in 2016. By any objective measure,
for their continued growth and success. In an today’s young adults are extremely well-
increasingly knowledge-driven economy, talent educated.
plays a decisive role in shaping city success.
The cities that do well are the ones that have Like all Americans, young college graduates
lots of smart young people, and to which it is have lots of choices about where to live. But by
relatively easy to attract more. The places that virtue of their youth, education and high
are struggling economically are those that have demand for their skills, 25- to 34-year-olds
few well-educated young adults, and who don’t with a college degree turn out to be the most
have the amenities and critical mass to attract mobile Americans, which is an increasingly
and anchor young talent in place. rare commodity as the tendency of Americans
to move long distances has steadily declined for
Despite the growing costs of a college decades. Therefore, the talent pool that’s “up
education, and the considerable burden of for grabs” in today’s world, is these young and
student loans, this generation is better restless adults.
8Table 1: Population in Large Metro Areas and US, 2016, by age and education
Nation Large Metros Rest of US
Population 322,903,030 178,855,171 144,047,859
Adults (Aged 25 and older) 218,446,071 121,472,353 96,973,718
Adults with a 4-year degree 68,867,051 44,298,363 24,568,688
Percent college attainment 32% 36% 25%
25- to 34-year-olds 44,567,976 26,198,513 18,369,463
25- to 34-year-olds with a 4-year degree 15,629,182 10,677,049 4,952,133
Percent college attainment 35% 41% 27%
Over time, the US is becoming better educated, For young adults, the educational attainment
and well-educated Americans are increasingly gap is even wider. Some 41 percent of 25- to
concentrated in large metropolitan areas. Table 34-year-olds living in large metro areas have
1 shows the total population, the number of completed at least a four-year degree compared
adults, and the number of 25- to 34-year-olds to 27 percent of those not living in a large
living in the nation as a whole, and in one of metro area.
the 52 largest metropolitan areas, according to
the five-year 2014-18 American Community So in the aggregate, these talented young adults
Survey. It also shows the number and fraction are already disproportionately concentrated in
of adults and 25- to 34-year-olds who have the nation’s largest metropolitan areas. City
completed at least a four-year degree. Observatory’s inaugural report in 2014 was
entitled “The Young and Restless and the
Even more than previous generations, today’s Nation’s Cities,” but we’ve explored the role
well-educated 25- to 34-year-olds are played by well-educated young adults in
increasingly gravitating to the nation’s largest driving urban revitalization for more than a
metropolitan areas. Table 1 shows the total decade before that. The twenty-first century
number of adults and according to the latest has been marked by a steady increase in the
Census data, there are about 15.6 million 25- to number and share of well-educated people in
34-year-olds who have completed a four-year the nation’s large metropolitan areas. Table 2
degree. Roughly 10.7 million of them, or more shows the overall population, adult population,
than two-thirds, live in one of the nation’s and population aged 25- to 34-in the nation’s
largest metropolitan areas, compared to just 55 52 largest metro areas as reported in the 2000
percent of all Americans. Decennial Census, and in the American
Community Survey for the two five-year
On average, adult Americans living in one of periods centered on 2010 and 2016
the nation’s largest metro areas are respectively.
considerably better educated than those living
outside these large metros. The four-year
college attainment rate for all adults living in
large metros is 36 percent, compared to 25
percent for those living outside large metros.
9Table 2: Population in Large Metro Areas, 2000, 2010 and 2016, by age and education
Change
Top 52 Metropolitan Areas 2000 2010 2016 2010-16
Total Population 151,462,220 168,029,888 178,855,171 6.4%
Adults (Aged 25 and older) 98,333,623 111,119,930 121,472,353 9.3%
Adults with a 4-year degree 27,944,982 36,766,409 44,298,363 20.5%
Percent college attainment 28.4% 33.1% 36.5%
25- to 34-year-olds 22,869,664 23,758,216 26,198,513 10.3%
25- to 34-year-olds with a 4-year
degree 7,351,293 8,744,415 10,677,049 22.1%
Percent college attainment 32.1% 36.8% 40.8%
The total population living in large metro areas
has increase by about 6.4 percent over this 16
year period. The number of adults and young
adults living in large metro areas has increased
even faster (reflecting the combined effects of
the aging of the US population and the growing
preference of young adults for large metro
areas). Since 2010, the number of adults with
college degrees has been increasing
substantially faster than the rate of population
increase. For all adults, aged 25 and over,
college attainment has risen about 20.5
percent—more than three times faster than the
overall rate of increase in population in large
metropolitan areas. That has been led by the
increased educational attainment of young
adults, who have increased 22 percent over that
same time period.
10Close-in
Neighborhoods
At the heart of the nation’s largest metro areas centers. Central locations also typically have
are the central business districts and the highest level of accessibility to all jobs in a
immediately surrounding neighborhoods. metro area, an especially important
More than 10 million Americans live in these characteristic for two-earner households.
close-in neighborhoods.
Table 3 summarizes the population and
To allow direct comparisons among different educational attainment of the nation’s close-in
metropolitan areas, we apply a consistent urban neighborhoods since 2000.
yardstick for defining “close-in” urban
neighborhoods. Following a technique The overall population level of these areas was,
developed by Ed Glaeser (E. L. Glaeser et al., in the aggregate, essentially stagnant between
2001), and applied by researchers at the 2000 and 2010, with increases in some cities
Brookings Institution (Kneebone, 2009), we more than offset by declines in others. Total
identify the center of a metro area’s principal population in close-in neighborhoods was
central business district, and then use basically unchanged at about 9.4 million. But
geographic information system software (GIS) since 2010, these close-in neighborhoods have,
to draw a three-mile radius around that spot, collectively, grown rapidly, with their aggregate
counting the number of people living inside population increasing 7.5 percent in six years,
that circle. to a total of 10.1 million.
These close-in neighborhoods tend to have Census data show that more than 10 million
higher levels of density than other parts of Americans reside in the close-in urban
metropolitan areas, and offer close access to neighborhoods of the nation’s metro areas with
the concentration of jobs, cultural and a million or more population.
recreational opportunities found in city
11Table 3: Population in Close-in urban neighborhoods of Large Metro Areas, 2000, 2010 and
2016,
by age and education
Change
Top 51 Metropolitan Areas 2000 2010 2016 2010-16
Total Population 9,420,805 9,405,328 10,107,970 7.5%
Adults (Aged 25 and older) 6,178,499 6,370,807 7,125,714 11.8%
Adults with a 4-year degree 2,001,782 2,665,490 3,389,021 27.1%
Percent college attainment 32.4% 41.8% 47.6%
25- to 34-year-olds 1,870,726 2,003,395 2,380,503 18.8%
25- to 34-year-olds with a 4-year
degree 807,544 1,108,598 1,472,522 32.8%
Percent college attainment 43.2% 55.3% 61.9%
Table 4 provides a detailed listing of the Five cities each recorded an increase of 20,000
number of well-educated young adults in close- more well-educated young adults in close-in
in neighborhoods in each of the nation’s 52 neighborhoods after 2010: Boston,
largest metro areas in 2000, 2010, and 2016. It Philadelphia, San Francisco, Seattle and
also shows the change in the number of well- Washington.
educated young adults between 2010 and 2016,
and computes the average annual growth rate Three cities recorded double-digit annual
of well-educated young adults between 2000 growth rates in the number of well-educated
and 2010, and between 2010 and 2016. young adults in these neighborhoods—Detroit,
Nashville and Phoenix. Detroit’s numbers
As noted above, in the aggregate, the close-in represent a big turnaround after decades of
neighborhoods of these 52 metropolitan areas population decline in its close-in urban
added about 363,000 25- to 34-year-olds with neighborhoods. Both Detroit and Phoenix are
a four-year degree between 2010 and 2016. exhibiting large growth rates from a very small
base (each had about than 3,000 well-educated
Perhaps the most striking finding from this young adults in close-in neighborhoods in
table is that every single one of these 2010).
metropolitan areas recorded an increase in the
number of well-educated young adults in city
center neighborhoods between 2010 and 2016.
12Table 4: Population in Close-in Urban Neighborhoods of Large Metro Areas, 2000, 2010 and 2016,
Change Average Annual Growth
Metro Area 2000 2010 2016 20010-16 2000-10 2010-16
Atlanta-Sandy Springs-Marietta, GA 16,098 22,326 29,441 7,115 3.3% 4.6%
Austin-Round Rock, TX 15,638 19,537 30,919 11,382 2.2% 7.7%
Baltimore-Towson, MD 13,170 25,223 33,637 8,414 6.5% 4.8%
Birmingham-Hoover, AL 5,392 4,537 6,015 1,478 -1.7% 4.7%
Boston-Cambridge-Quincy, MA-NH 51,367 70,090 90,889 20,799 3.1% 4.3%
Buffalo-Niagara Falls, NY 4,162 5,752 7,362 1,610 3.2% 4.1%
Charlotte-Gastonia-Concord, NC-SC 6,463 10,992 16,925 5,933 5.3% 7.2%
Chicago-Naperville-Joliet, IL-IN-WI 48,889 75,738 93,179 17,441 4.4% 3.5%
Cincinnati-Middletown, OH-KY-IN 7,106 8,179 11,923 3,744 1.4% 6.3%
Cleveland-Elyria-Mentor, OH 2,645 4,805 6,736 1,931 6.0% 5.6%
Columbus, OH 8,895 12,594 20,163 7,569 3.5% 7.8%
Dallas-Fort Worth-Arlington, TX 9,150 17,256 28,389 11,133 6.3% 8.3%
Denver-Aurora, CO 20,985 31,678 46,662 14,984 4.1% 6.5%
Detroit-Warren-Livonia, MI 3,350 3,153 8,239 5,086 -0.6% 16.0%
Grand Rapids-Wyoming, MI 5,708 7,656 12,229 4,573 2.9% 7.8%
Hartford-West Hartford-East Hartford, CT 5,417 6,816 8,661 1,845 2.3% 4.0%
Houston-Sugar Land-Baytown, TX 10,639 18,845 28,293 9,448 5.7% 6.8%
Indianapolis-Carmel, IN 3,235 5,386 10,612 5,226 5.1% 11.3%
Jacksonville, FL 1,512 2,220 3,259 1,039 3.8% 6.4%
Kansas City, MO-KS 2,640 4,294 7,574 3,280 4.9% 9.5%
Las Vegas-Paradise, NV 1,655 1,894 2,393 499 1.3% 3.9%
Los Angeles-Long Beach-Santa Ana, CA 10,380 20,161 33,408 13,247 6.6% 8.4%
Louisville-Jefferson County, KY-IN 4,418 5,683 6,612 929 2.5% 2.5%
Memphis, TN-MS-AR 3,746 4,886 6,049 1,163 2.7% 3.6%
Miami-Fort Lauderdale-Pompano Beach, FL 6,428 14,001 19,940 5,939 7.8% 5.9%
Milwaukee-Waukesha-West Allis, WI 9,557 12,614 17,001 4,387 2.8% 5.0%
Minneapolis-St. Paul-Bloomington, MN-WI 18,433 25,156 33,420 8,264 3.1% 4.7%
Nashville-Davidson-Murfreesboro-Franklin, TN 4,794 7,720 14,404 6,684 4.8% 10.4%
New Orleans-Metairie-Kenner, LA 9,418 12,278 18,580 6,302 2.7% 6.9%
New York-Northern New Jersey-L.I., NY-NJ-PA 198,447 228,505 242,380 13,875 1.4% 1.0%
Oklahoma City, OK 2,173 3,048 4,916 1,868 3.4% 8.0%
Orlando-Kissimmee, FL 6,070 7,351 10,633 3,282 1.9% 6.2%
Philadelphia-Camden-Wilmington, PA-NJ-DE-MD 28,317 50,273 71,668 21,395 5.7% 5.9%
Phoenix-Mesa-Scottsdale, AZ 2,230 2,784 6,023 3,239 2.2% 12.9%
Pittsburgh, PA 7,949 11,796 17,387 5,591 3.9% 6.5%
Portland-Vancouver-Beaverton, OR-WA 18,297 24,860 32,054 7,194 3.1% 4.2%
Providence-New Bedford-Fall River, RI-MA 9,168 11,576 13,596 2,020 2.3% 2.7%
Raleigh-Cary, NC 5,914 7,813 11,193 3,380 2.8% 6.0%
Richmond, VA 6,731 9,488 15,430 5,942 3.4% 8.1%
Riverside-San Bernardino-Ontario, CA 2,196 3,373 4,787 1,414 4.3% 5.8%
Rochester, NY 9,668 11,552 11,831 279 1.8% 0.4%
Sacramento-Arden-Arcade-Roseville, CA 7,424 10,482 14,693 4,211 3.4% 5.6%
St. Louis, MO-IL 3,094 7,371 9,559 2,188 8.7% 4.3%
Salt Lake City, UT 9,111 11,543 15,113 3,570 2.4% 4.5%
San Antonio, TX 2,125 2,995 4,779 1,784 3.4% 7.8%
San Diego-Carlsbad-San Marcos, CA 10,437 19,918 25,551 5,633 6.5% 4.2%
San Francisco-Oakland-Fremont, CA 84,425 91,035 116,248 25,213 0.8% 4.1%
San Jose-Sunnyvale-Santa Clara, CA 11,821 16,015 22,848 6,833 3.0% 5.9%
Seattle-Tacoma-Bellevue, WA 23,446 31,655 53,775 22,120 3.0% 8.8%
Tampa-St. Petersburg-Clearwater, FL 4,673 7,794 9,032 1,238 5.1% 2.5%
Virginia Beach-Norfolk-Newport News, VA-NC 3,841 5,906 7,065 1,159 4.3% 3.0%
Washington-Arlington-Alexandria, DC-VA-MD-WV 44,405 77,651 99,051 21,400 5.6% 4.1%
13Acceleration worth noting that among those with a slowing
growth rate are Chicago, New York, and
There seems to be little question that, Washington—all cities that already had
compared to 20 or 30 years ago, young adults substantial concentrations of young workers in
are more likely to live in cities. But some have their urban centers, and in the case of the latter
questioned whether this trend has run out of two, facing notable challenges in expanding
steam. To get a sense of whether the movement housing supply to meet demand.
of well-educated young adults to close-in urban
neighborhoods is accelerating or abating, its Relative Preference
useful to look at the final two columns of Table
4. These columns report the annualized growth Another way to think about whether, and to
rate in the number of 25- to 34-year-olds with a what degree well-educated young adults prefer
four-year degree or higher education in each of urban living is to look at the relative likelihood
two periods, 2000 to 2010 and 2010 to 2016. that they live in a close-in urban neighborhood
We’ve annualized these figures to allow a direct compared to the average metropolitan resident.
comparison over these two time periods of To do this, we compute an odds ratio: what
different lengths. fraction of 25- to 34-year-olds with a four-year
degree who live in large metro areas live in
The difference between these two growth rates close-in neighborhoods compared to the
indicates whether then growth of well-educated fraction of the total population of large
young adults is accelerating or slowing. If the metropolitan areas that live in these
growth rate for 2010-16 (the right-most neighborhoods. In 2016, 13.8 percent of well-
column) is higher than for the 2000-10 period, educated young adults living in large metros
that indicates that the rate of growth is live in close-in neighborhoods, compared to
accelerating. (To make this clear, we’ve bolded about 4.0 percent of all residents of large metro
the growth rates for cities that have areas. This means that the “young and restless”
accelerating rates of growth). The data in Table are about 3.5 times as likely (13.8 percent/4.0
4 show that growth rates are higher in the percent) to live in close-in neighborhoods as
latter period for 40 of the 52 metropolitan the typical large-metro resident.
areas. This means that the movement of well-
educated young adults to close-in If we’re interested in judging whether the taste
neighborhoods—which is occurring in every for urban living among young adults has
large metro area—is actually accelerating in changed over time, we can compare the relative
four-fifths of these metro areas. The remaining preference for living in close-in neighborhoods
fifth of metro areas continue to add well- today with the same figure from previous
educated young adults in their core years—as shown in Table 5.
neighborhoods, but are doing so at a slower
rate now than in the 2000-2010 decade. It’s
Table 5: Share of Population and Young and Restless in Close-in Neighborhoods
2000 2010 2016
Total Population 4.1% 3.8% 4.0%
25- to 34-year-olds with a 4-year degree 11.0% 12.7% 13.8%
Odds-Ratio 2.7 3.3 3.5
14Policy
Implications
The accelerating movement of well-educated shows that search activity is actually shifting to
young adults into the close-in neighborhoods of cities, not away from them.
the nation’s largest cities has a number of
important implications. The increase in city-
centered human capital is an essential asset for Talent and
powering metropolitan areas, promoting urban
revitalization, and if harnessed correctly opportunity:
assuring more widespread economic
opportunity. Reviving city
The information presented in this report centers
challenges claims made—based largely on
coarser, count-level data—that the urban Vibrant and productive city-centered urban
revival has slowed due to some generational economies are central to the nation’s economic
disenchantment with cities; if anything, our well-being. Many of the nation’s most
data show the ardor for urban living is important knowledge-based industries thrive
accelerating, restrained mostly by the limited on the agglomeration economies that come
supply of great urban neighborhoods and the from the kind of dense and varied interactions
difficulty of building new housing in them. that are possible in cities.
Finally, in light of the Covid-19 pandemic, Cities provide opportunity. One of the key ways
there are many concerns that density and that cities promote efficiency is through deep
urban living will somehow no longer be labor markets that allow for optimal matching
attractive in the decades ahead. The data of workers to the jobs that make best use of
actually show tenuous connections between their skills and abilities. Cities are places where
urban density and the virus’s spread; and the workers pursue employment opportunities,
latest data on Internet real estate searches
15acquire skills, and build personal and 2019). In addition, whether new residents
professional networks. displace previous residents depends
substantially on whether we allow housing
The growing presence of well-educated young supply to expand in close-in urban
adults in large metro areas and their preference neighborhoods. Since 2010, we’ve managed to
for urban living is prompting companies to add about 7 percent more residents in these
expand and locate in city centers. The neighborhoods, and some of this increase could
competition for talent has reshaped the process be accommodated by making fuller use of the
of economic development: location decisions existing housing stock. But its likely that
are typically dictated by the HR department, further growth in these neighborhoods—and
and places that have lots of talented young avoiding displacement of long-time residents
workers, or which can readily attract more are who wish to stay—will increasingly hinge on
preferred. One study found more than 500 expanding the housing stock. Contrary to many
companies had located or expanded in city popular conceptions, building new market rate
centers, primarily to have better access to housing in cities is associated with lower rents
talent (Smart Growth America et al., 2016). and less displacement (Asquith et al., 2019).
This fact was underscored by Amazon’s
decision to select New York and Washington as For urban neighborhoods that have suffered
the winners of its much ballyhooed “HQ2” from decades of disinvestment and population
competition, based on their strong decline, attracting new, well-educated residents
concentrations of talent (Badger, 2018). can provide an economic stimulus. Increased
local spending on groceries, at restaurants and
There are signs that this movement of bars and at neighborhood retailers and service
employers back to cities is blunting, if not businesses can support the creation of
reversing, the long-term pattern of additional local jobs, most of which are likely to
employment decentralization in the US be a skill-levels that are accessible to a wide
(Cortright, 2015). Recent work by the range of neighborhood residents. Writing for
Brookings Institution has pointed to a strong the Brookings Institution, Jonathan Rothwell
increase in employment density, driven largely estimates that over the course of an adult
by cities like Seattle and San Francisco (which lifetime, a college graduate spends roughly a
have been extremely successful in attracting quarter of million dollars more on local goods
well-educated young adults (Shearer et al., and services than residents with just a high
2019). school education (Rothwell, 2015). This
additional spending translates directly into
The movement of talented young workers to more jobs and opportunities in local
close-in urban neighborhoods is helping to neighborhoods.
power revitalization. As we’ve noted, college-
educated 25- to 34-year-olds account for a Economic integration that leads to better life
majority of the net new residents to close-in prospects, especially for kids from low income
neighborhoods since 2010. families. The work of Raj Chetty and his
colleagues at the Equality of Opportunity
To some, well-educated new residents are a Project has shown that segregation, including
sign of gentrification and possible economic segregation, has deleterious effects
displacement. But recent research shows that on the lifetime earnings of kids from low
an influx of newcomers seldom produces income families, and that this is reflected in
displacement, and long-time residents are generally poorer rates of economic mobility in
generally made better off (Brummet & Reed, the central counties of metro areas (Chetty et
16al., 2014). Promoting greater integration can classification systems; a county classification
potentially ameliorate these negative effects. system developed by Bill Bishop at the Daily
Yonder reports that the nation’s most urban
For too long, the problems of city counties added 6.6 million population between
neighborhoods have been fueled by a powerful 2000 and 2019 (Bishop & Gallardo, 2020). If
and self-reinforcing combination of you look closely at the densest urban
disinvestment and out-migration. The growth neighborhoods, growth is robust. A new
in property values (and the tax base) in analysis from the Brookings Institution that
revitalizing neighborhoods provides a possible uses customized census-tract level definitions
source of funding to help subsidize the of the downtowns, finds that these central
retention and construction of affordable areas have been growing robustly in large
housing. Some cities, like Portland, have metropolitan areas since 2000 (Tomer &
dedicated a significant fraction of the tax Fishbane, 2020).
increment associated with rising property
values in redeveloping areas to subsidize The data presented here show that, especially
housing, leading to the construction of compared with the decade 2000 to 2010, the
thousands of units of affordable housing in movement of well-educated young adults to
those close-in neighborhoods that are also urban neighborhoods has accelerated through
gaining talented workers (Cortright, 2019). the period covered by the latest Census data
(2014-2018), and that these close-in
neighborhoods, which had collectively
Has the tide stagnated in the earlier decade grew robustly
after 2010. These data can’t directly show—one
turned against way or another—whether that trend has
continued in the past year or two.
cities?
Even if growth has slowed, there’s little reason
In the past year or so, there have been several to believe that this signals any kind of
stories in the popular press pronouncing an disenchantment with city living. In addition to
end to, or at least a dramatic slowdown in the the simple demographics of body-counts, we
nation’s urban revival. Analyses of county-level can also look at other market data which clearly
data by Brookings Institution demographer Bill signal the enduring and increasing premium
Frey (Frey, 2020) and Indeed economist Jed that people place on urban living. Careful
Kolko show that aggregate population growth analyses of intra-urban real estate values have
in the counties that they each classify as the shown significant and sustained increases in
nation’s most “urban” have slowed since the value in central and walkable neighborhoods.
early part of the last decade (Kolko, 2017). Economists have traced a decades-long
increase in the relative value of homes in the
Both of these studies use county boundaries, center of cities relative to those on the
rather than urban neighborhoods to measure periphery (Edlund et al., 2015). Between 2012
whether urban population is increasing or not. and 2019, average property values in walkable
County lines don’t match up well with the neighborhoods have increased faster than
contours of city neighborhoods, with most those in car-dependent neighborhoods in 44 of
central counties in large metropolitan areas the 51 largest US metropolitan areas, according
being an amalgam of both denser urban to data provided by Redfin (Anderson, 2019).
neighborhoods and lower density suburban
ones. There is a certain arbitrariness to these
17High and rising property values for central and pandemic, Zillow reports that the market share
walkable locations signal both the high value of searches for urban locations increased
that consumers attach to these attributes, and nationally, and also rose in 29 of 35 large metro
their relative short supply. One of the principal areas (Tucker, 2020). The share of searches for
reasons for rising rents in these neighborhoods suburban locations declined in every one of
is that it has been essentially illegal to build these 35 markets—exactly opposite of what
places with these characteristics (high levels of you’d expect if the market were turning against
density, a mix of shops and restaurants, a range cities. Interest in cities is not just weathering
of housing types, and high levels of walkability) the pandemic, it’s increasing, relative to
in much of the United States. In addition, suburbs. Zillow’s Jeff Tucker concludes:
because of strict local zoning limits, it’s been
difficult to build new housing in some of the Will a new fear of density cause people
most in-demand neighborhoods (Murray & to flee urban cores for more spread-out
Schuetz, 2019). To the extent we are seeing a suburbs or rural areas? So far, Zillow
slowing of population growth in close-in data suggest the answer is “No.”
neighborhoods, it appears to be chiefly a
problem of limited housing supply, rather than Independently, another source of real estate
waning demand to live in America’s most market activity confirms the continued interest
urban places. in cities. ApartmentList.Com is a major
consumer-focused website for finding
What about the apartments. Like Zillow, they track search
activity by location. In April, 2020, at the
Pandemic? height of the pandemic, they found an
increased interest in moving to New York. In a
section headlined “The pandemic is not scaring
Claims about a reversal of the urban rebound renters away from New York,” they wrote:
have drawn added attention as a result of
widespread speculation about the role of In recent weeks, the New York City
density in the spread of the Covid-19 pandemic, metro has emerged as a global epicenter
and ruminations about the future of cities. For of the pandemic, to the extent that the
example, in April, 2020, The New York Times state of New York now accounts for more
headlined an article speculating on the likely COVID-19 cases than any single country
long-term effects of the Covid-19 pandemic on outside the U.S. It might reasonably be
cities, “America’s Biggest Cities Were Already expected that the severity of the
Losing Their Allure. What Happens situation would make the prospect of
Next?”(Tavernise & Mervosh, 2020), and The moving to New York appear far less
Wall Street Journal chimed in with “People attractive, but this intuition is not borne
were leaving New York City before the out in our data. We observe that prior to
Coronavirus, Now what?” (King, 2020). the pandemic, 20.3 percent of users
searching for apartments in the New
While there’s definitely some panicky York metro were searching from a
pandemic punditry predicting people will different part of the country. In more
abandon cities, the best evidence suggests recent data, however, that share
that’s not even close to happening. Real estate has increased to 26.4 percent (Salviati,
analytics firm Zillow tracks the location of 2020).
homes that people are searching for on a day to
day basis. In April 2020, in the midst of the
18There’s little reason to believe pandemic going to slow down the growth of cities.
concerns will blunt the advantages and I think the underlying economic reality
attractiveness of urban living. One of the most is that there is tremendous economic
robust decades for central city growth in the value in interacting with people and
United States, the 1920’s, followed directly sharing ideas. There’s still a lot to be
after the Spanish Flu pandemic of 1918-19. gained from interaction in close physical
Cities have weathered and adapted in the face proximity because such interaction is a
of outbreaks of contagious diseases for large part of how we establish trust. So I
centuries, and will likely do so again. think that, for the rest of my life, cities
are going to continue to be where the
Paul Romer, winner of the 2018 Nobel Prize in action is (Romer, 2020)
Economics puts this in perspective:
The fact is that the intense interaction
that cities allow is immensely
productive. I think what we’re going to
learn from this is that there are a variety
of ways to continue to interact
frequently while minimizing the risks of
transmitting viruses. I doubt that this is
19References &
Appendix
References growth-slows-but-that-doesnt-mean-a-
rural-rebound/2020/04/27/
Brummet, Q., & Reed, D. (2019). The effects of
Anderson, D. (2019, August 29). Home Prices gentrification on the well-being and
Rising Faster in Car-Dependent Than opportunity of original resident adults and
Walkable Neighborhoods. Redfin. children.
https://www.redfin.com/blog/walkable- Chetty, R., Hendren, N., Kline, P., Saez, E., &
neighborhoods-home-prices-rising-slower/ Turner, N. (2014). Is the United States Still
Asquith, B., Mast, E., & Reed, D. (2019). Supply a Land of Opportunity? Recent Trends in
Shock Versus Demand Shock: The Local Intergenerational Mobility. National
Effects of New Housing in Low-Income Bureau of Economic Research.
Areas. Available at SSRN 3507532. http://www.nber.org/papers/w19844
Badger, E. (2018, November 7). In Superstar Cities, Cortright, J. (2015). Surging City Center Job
the Rich Get Richer, and They Get Amazon. Growth. City Observatory.
The New York Times. http://cityobservatory.org/citycenterjobs/
https://www.nytimes.com/2018/11/07/ups Cortright, J., & Coletta, C. (2004). The Young and
hot/in-superstar-cities-the-rich-get-richer- the Restless: How Portland Competes for
and-they-get-amazon.html Talent. Impresa, Inc.
Baum-Snow, N., & Hartley, D. (2019). Accounting Cortright, Joseph. (2019, June 11). A solution for
for central neighborhood change, 1980- displacement: TIF for affordable housing.
2010. Journal of Urban Economics, City Observatory.
103228. http://cityobservatory.org/a-solution-for-
Bishop, B., & Gallardo, R. (2020, April 27). Major- displacement-tif-for-affordable-housing/
City Growth Slows, but That Doesn’t Mean Edlund, L., Machado, C., & Sviatchi, M. (2015).
a Rural Rebound—Daily Yonder. Daily Bright Minds, Big Rent: Gentrification and
Yonder. the Rising Returns to Skill. National Bureau
https://www.dailyyonder.com/major-city-
20of Economic Research. Murray, C., & Schuetz, J. (2019). Is California’s
http://www.nber.org/papers/w21729 Apartment Market Broken? (p. 20). Terner
Center for Housing Innovation, University
Frey, W. H. (2020, April 6). Even before
of California, Berkeley.
coronavirus, census shows U.S. cities’
growth was stagnating. Brookings. Raymond, E. L., Dill, J., & Lee, Y. (2018).
https://www.brookings.edu/research/even- Millennial first-time homebuyers and
before-coronavirus-census-shows-u-s- location choice. Journal of Planning
cities-growth-was-stagnating/ Education and Research,
0739456X18807751.
Glaeser, E. (2011). The Triumph of the City: How
our greatest invention makes us richer, Romer, P. (2020, March 25). How to Avoid an
smarter, greener, healthier and happier. Economic Catastrophe. City Journal.
The Penguin Press. https://www.city-journal.org/how-to-avoid-
an-economic-catastrophe
Glaeser, E. L., Kahn, M., & Chu, C. (2001). Job
Sprawl: Employment Location in U.S. Rothwell, J. (2015, November 7). What colleges do
Metropolitan Areas. Brookings Institution. for local economies: A direct measure based
http://www.brook.edu/es/bwpua/99papers on consumption. Brookings.
/bwpua5.pdf https://www.brookings.edu/research/what-
colleges-do-for-local-economies-a-direct-
Handbury, J., & Couture, V. (2015). Urban Revival
measure-based-on-consumption/
in America, 2000 to 2010 (Preliminary).
UC Berkeley. Salviati, C. (2020, April 28). Apartment List Renter
faculty.haas.berkeley.edu/couture/.../Coutu Migration Report: 2020 Q2. Rentonomics.
re_Handbury.pdf https://www.apartmentlist.com/rentonomi
cs/apartment-list-renter-migration-report-
King, K. (2020, April 26). People Were Leaving
2020-q2/
New York City Before the Coronavirus. Now
What? Wall Street Journal. Scott, M., Santos, R., Arena, O., Hayes, C., & Simon,
https://www.wsj.com/articles/people-were- A. (2020). Community Ties: Understanding
leaving-new-york-city-before-the- what attaches people to the place where
coronavirus-now-what-11587916800 they live. Knight Foundation & Urban
Institute.
Kneebone, E. (2009). Job Sprawl Revisited: The
https://knightfoundation.org/reports/com
Changing Geography of Metropolitan
munity-ties-understanding-what-attaches-
Employment (p. 24). Brookings Institution.
people-to-the-place-where-they-live/
Kolko, J. (2017, March 22). 2016 Population: Back
Shearer, C., Vey, J., & Kim, J. (2019). Where jobs
to the Suburbs, Back to the Past.
are concentrating and why it matters to
http://jedkolko.com/2017/03/22/2016-
cities and regions.
population-back-to-the-suburbs-back-to-
https://www.brookings.edu/research/wher
the-past/
e-jobs-are-concentrating-why-it-matters-to-
Lee, Y., Lee, B., & Shubho, M. T. H. (2019). Urban cities-and-regions/
revival by Millennials? Intraurban net
Smart Growth America, Cushman Wakefield, &
migration patterns of young adults, 1980–
Center for Real Estate and Urban Analysis,
2010. Journal of Regional Science, 59(3),
The George Washington University. (2016).
538–566.
Core Values: Why American Companies
Lehner, J. (2017, March 9). Metro Size and are Moving Downtown. Smart Growth
Employment, 2016. Oregon Office of America.
Economic Analysis. https://smartgrowthamerica.org/resources/
https://oregoneconomicanalysis.com/2017/ core-values-why-american-companies-are-
03/09/metro-size-and-employment-2016/ moving-downtown/
21Su, Y. (2018). The rising value of time and the
origin of urban gentrification. Available at
SSRN 3216013.
Tavernise, S., & Mervosh, S. (2020, April 19).
America’s Biggest Cities Were Already
Losing Their Allure. What Happens Next?
The New York Times.
https://www.nytimes.com/2020/04/19/us/
coronavirus-moving-city-
future.html?referringSource=articleShare
Tomer, A., & Fishbane, L. (2020). Big city
downtowns are booming, but can their
momentum outlast the coronavirus?
Brookings Institution.
https://www.brookings.edu/research/big-
city-downtowns-are-booming-but-can-
their-momentum-outlast-the-coronavirus/
Tucker, J. (2020, May 22). Coronavirus Not Yet
Driving a Surge in Suburban Home
Searches. Zillow Research.
https://www.zillow.com/research/coronavi
rus-suburban-searches-27070/
22Methodology
Data for this report were obtained from the
American Community Survey. The report is
compiled from census tract level data for large
US metropolitan areas—those with a
population of one million or more. Tract level
data is reported in the American Community
Survey in rolling five-year groupings. The data
for this report are drawn from the five-year
2014-2018 tabulation of the American
Community Survey.
Data in this report are compared to tabulations
prepared by City Observatory in its earlier
report (Cortright, 2014), which compiled data
for 2000 (from the decennial census and for
2010 (from the five-year 2008-2012 American
Community Survey).
Data were tabulated using geographic
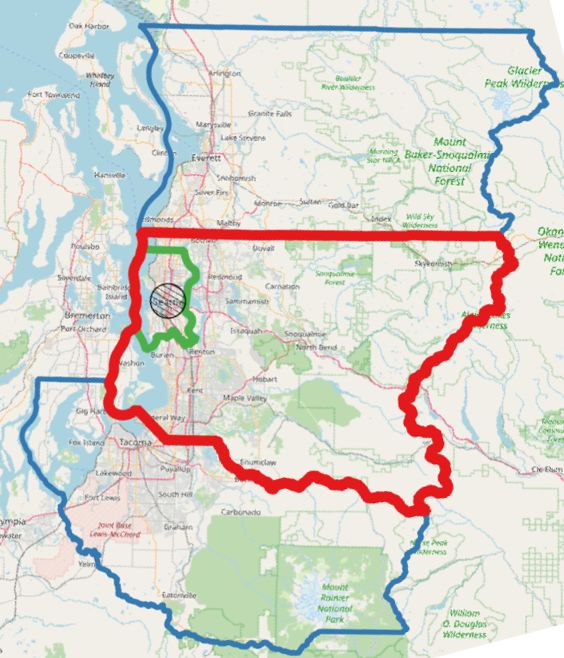
information system (GIS) software that Seattle Metropolitan Area
computed the number of persons living within
three miles of the center of the region’s
principal central business district. Locations of
central business districts were determined
from census bureau designations, following the
same approach as (Glaeser et al., 2001), and
(Kneebone, 2009).
The map opposite illustrates the various
geographies discussed in this report for the
Seattle metropolitan area. The blue-bordered
area is the entire metro area, stretching from
Tacoma on the South to Everett on the North.
The red-bordered area is King County, the
county containing the city of Seattle. Seattle’s
municipal boundaries are shown as a green
line, and our three-mile circle is shown as a
shaded, black-bordered circle.
City of Seattle and Close-in Neighborhoods
2324
You can also read