2020 ECONOMIC FORECAST - October 24, 2019 GREATER KANSAS CITY CHAMBER OF COMMERCE - Mid-America Regional Council
←
→
Page content transcription
If your browser does not render page correctly, please read the page content below

GREATER KANSAS CITY CHAMBER OF COMMERCE

2020 ECONOMIC
  FORECAST
           October 24, 2019

                              Prepared by:
                              Frank Lenk
                              Director of Research Services
                              Mid-America Regional Council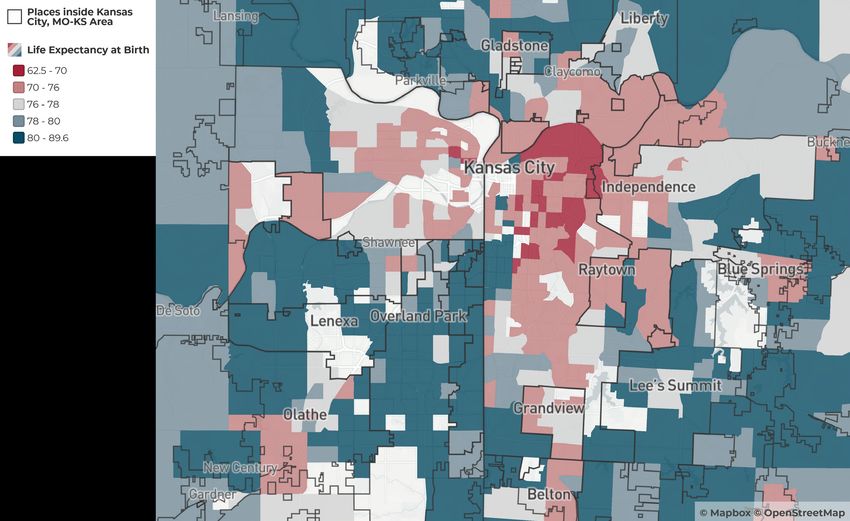
REGIONAL ECONOMIC FORECAST AGENDA

7:57 a.m.        WELCOMING REMARKS
                 Carolyn Watley
                 Vice President of Community Engagement,
                 CBIZ Benefits & Insurance Services
                 Chair-elect, KC Chamber Board of Directors

8:00 a.m.        KEYNOTE INTRODUCTION
                 Sal Guatieri
                 Director and Senior Economist, BMO Capital Markets

8:05 a.m.        LOCAL ECONOMIC FORECAST
                 Frank Lenk
                 Director of Research Services, Mid-America Regional Council

8:20 a.m.        PANEL INTRODUCTION
                 Brent Bloss
                 Chief Operating Officer, Waddell & Reed Financial, Inc.

8:25 a.m.        PANEL DISCUSSION
                 Joe Reardon
                 President & CEO, KC Chamber (Moderator)
                 Bridgette Williams
                 CEO, Heavy Constructors Association of Greater Kansas City
                 Emmet Pierson, Jr.
                 CEO, Community Builders Of Kansas City
                 John Ricciardelli
                 FM&T President, Honeywell
                 Mike DeBacker
                 Director of Transportation Global Practice, Burns & McDonnell

9:10 a.m.        AUDIENCE Q+A
                 Panelists

9:28 a.m.        CLOSING REMARKS
                 Joe Reardon, President & CEO, KC Chamber

View the full Greater KC Report at http://bit.ly/thegreaterkcreport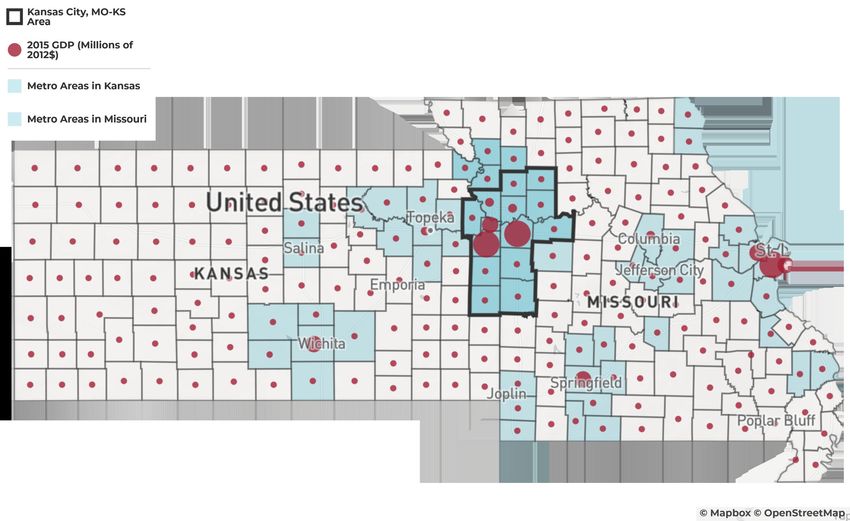
U.S. SITUATION
Reaching 124 months in September 2019, the longest recovery in the nation’s history continues,
though at a reduced pace. In the second quarter of 2019, U.S. GDP grew 2.0 percent and averaged 2.3
percent over the preceding four quarters. This average is nearly a full percentage point below that for
the prior year, when U.S. GDP grew 3.2 percent between the second quarters of 2017 and 2018 after
having been stuck near 2 percent growth for several quarters. This acceleration is likely the result of
the 2017 Tax Cut and Jobs Act plus an additional $300B in federal spending over two years as part
of the 2017 budget deal. As the initial injection of stimulus fades, U.S. GDP appears to be returning to
pre-stimulus growth rates.

   Figure 1

                                   Quarterly U.S. GDP Growth
                          (2012 dollars, seasonally adjusted at annual rates)
    4.0%
    3.5%
    3.0%
    2.5%
    2.0%
     1.5%
    1.0%
    0.5%
    0.0%

                   2015                  2016              2017                2018            2019

                                            GDP Growth         Trendline

   Source: Bureau of Economic Analysis

This deceleration is mirrored in employment data. The U.S. economy added 134,000 jobs in
September 2019, below its average of 161,000 so far in 2019 and nearly 90,000 less than its 2018
average of 223,000 per month.
Figure 2

                  Monthly Change in U.S. Total Nonfarm Employment
                                               (thousands)
  400
  350
  300
  250
  200
   150
   100
   50
     0

                2015                 2016              2017                 2018            2019

                             Change in Total Nonfarm Employment             Trendline

 Source: Bureau of Labor Statistics (CES)
Some deceleration is inevitable as population between the ages of 18 and 64 is only growing 88,000 a
month. Indeed, the current employment growth rate is only being sustained by bringing more people
into the labor force. Prime age (25-64 years) employment-to-population ratio reached 80.1 percent in
September 2019, up more than five percentage points from its December 2009 low of 74.8 percent
and just below its pre-recession peak of 80.3 percent in January 2007.

With the demand for workers outstripping supply, the nation’s unemployment hit a 50-year low
in September 2019, at 3.5 percent. Despite this, inflation remains below the Federal Open Market
Committee (FOMC) symmetrical target of 2.0 percent, as measured by core PCE price index
(personal consumption expenditures less food and energy).

Figure 3

                                      Core PCE Price Index
                              Monthly percent change from 1 year ago
  2.5%

  2.0%

   1.5%

   1.0%

  0.5%

  0.0%

                 2015                2016              2017                 2018           2019

                                            Core PCE       Trendline

Source: Federal Reserve Economic Data (FRED), Bureau of Economic Analysis
Financial markets seem more concerned with the potential for a trade war with China, though the
“phase one” deal announced on October 11 should provide some respite. With inflation still running
below its 2 percent target and the potential for trade concerns to affect business investment
and hiring, the FOMC voted to lower the Federal Funds rate by 25 basis points at both its July
and September meetings. As of this writing in mid-October, Federal Funds futures markets were
estimating an 85 percent chance of another 25 basis point reduction by the end of 2019.

U.S. FORECAST
The combination of a strong labor market and FOMC monetary accommodation mean a recession
is not likely within time frame of this forecast, which extends through 2021. Both the FOMC and the
University of Michigan’s Research Seminar in Quantitative Economics (RSQE) forecast U.S. GDP
growth to slow over the next two years. Compared to the 2.9 percent growth registered in 2018, the
FOMC expects GDP growth to range from 2.1 percent to 2.4 percent in 2019, 1.7 percent to 2.3 percent
in 2020, and 1.7 percent to 2.1 percent in 2021. (Figures are measured on a fourth-quarter to fourth-
quarter basis.) RSQE’s forecast is for GDP to grow at the low end of this range, at 2.2 percent in 2019
and 1.7 percent in 2020 before falling slightly below the FOMC’s range at 1.6 percent in 2021.

 Figure 4

                              Comparison of GDP Forecasts
                              FOMC Range vs. RSQE, 4Q/4Q

                                      2.4                      2.3
            2.5
                                                                                        2.1

                                      2.2
                                                                                          1.7
                                                               1.7
                                                                                        1.6

              2018                    2019                    2020                     2021

                                             FOMC range      RSQE

 Source: Federal Reserve Economic Data (FRED), Federal Open Market Committee

Because RSQE also provides a more detailed breakdown of GDP by its consumption, investment,
government spending, import and export components, this forecast provides the information needed
to drive Regional Economic Models, Inc.’s Policy Insight model, which is what MARC uses to translate
national input into local forecasts for the Kansas City metropolitan area.

RSQE also provides a forecast of total non-farm employment, which is used to calibrate the forecast
of future labor productivity. RSQE forecasts employment growth over the prior four quarters to drop
from 1.8 percent at the end to 2018 to 1.3 percent at the end of 2019 to 1.0 percent by the end of 2020.
At this point, annual employment growth is projected to stabilize, remaining around 1 percent through
the rest of the forecast period.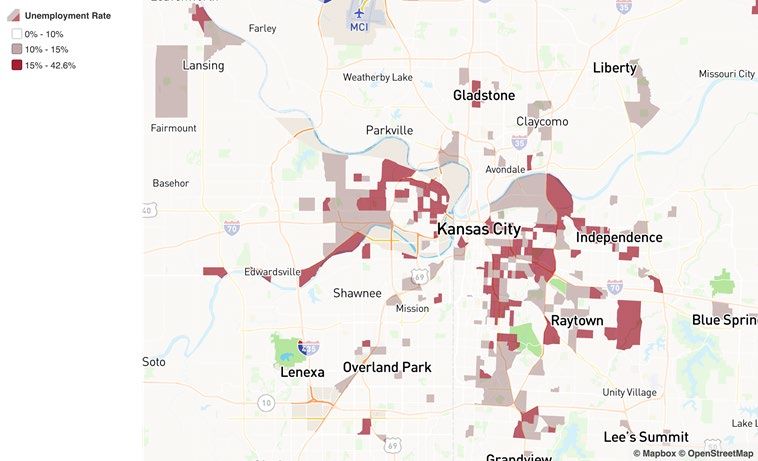
Figure 5

                       U.S. Total Non-Farm Payroll Employment
                             Quarterly percent change from 1 year ago
  2.0%                      1.8%
   1.8%
   1.6%
   1.4%                                             1.3%
   1.2%                                                                     1.0%                    1.1%
   1.0%
  0.8%
  0.6%
  0.4%
  0.2%
  0.0%

                   2018                    2019                   2020                     2021

                                        U.S. Total Non-Farm Employment

 Source: Bureau of Labor Statistics (CES), RSQE

The Kansas City Economic Story
Metropolitan regions grow fastest when they serve the larger U.S. and international markets. The
ability to find buyers in those markets depends, in part, upon being able to provide specialized
products and services not easily found elsewhere for the same quality and/or price. Such specialties
typically develop in the goods and services in which the region might have a competitive advantage
relative to other parts of the country.

One way of identifying a metropolitan area’s specialties is to examine how much of its economy is
devoted to producing a particular product compared to the national average. A region is said to
specialize in an industry when its share of local employment is greater than its share of national
employment. The ratio of an industry’s local share to its national share is called its “location quotient.”
When a location quotient reaches 1.1 or larger, then it is considered likely that the industry is serving
markets outside the region.
Figure 6

                      Kansas City Metro Area Industry Specializations
                                  (as measured by their location quotients)
            1.67
                               1.34                1.32          1.27
                                                                                     1.15                1.09

    Management of          Professional,    Finance and    Transportation Wholesale Trade              Utilities
    Companies and         Scientific, and    Insurance          and
     Enterprises            Technical                       Warehousing
                             Services

 Source: JobsEQ

Based on location quotients, the region’s largest specialization appears to be in management
of companies, probably related to Greater Kansas City’s efficiency as a place for back-office
management operations. A location quotient of 1.67 means this industry’s share of local jobs is 67
percent larger than its share of the nation’s total jobs. Professional/technical services, finance and
insurance, and transportation and warehousing also emerge as significant areas of concentration in
Kansas City relative to the rest of the nation, with location quotients around 1.3.

Within the professional/technical services industry, however, there are sub-sectors with even higher
location quotients. In particular, the share of local employment devoted to computer systems design
industry is 84 percent larger than the nation, thanks largely to Cerner. Similarly the local share of
employment in the architecture and engineering industry is 57 percent greater than the U.S. average
as a result of being the headquarters for firms such as Black & Veatch, Burns & McDonnell and
Populous.

 Figure 7

                      Professional and Technical Services Components
                                               Location Quotients
                   1.84
                                            1.57

                                                                    1.27                        1.25

      Computer Systems                Architectural,       Management, Scientific,      Advertising, Public
      Design and Related         Engineering, and Related and Technical Consulting     Relations, and Related
           Services                     Services                 Services                     Services

 Source: JobsEQ
These specialized industries overlap significantly with the sectors that export the most to customers
around the country and world. For much of the past decade, many of these industries that drive the
regional economy have grown at roughly the national average. The two exceptions are information
and professional, technical and scientific services. These deviations are strongly related to the
performance of the firms that comprise them. Information includes both telecommunications and
traditional media companies. While employment declines in media are common across the country,
Sprint’s declining market share has hit the Kansas City region particularly hard. While Sprint shows
signs of stabilizing, it has been the major factor in losing 14,400 information industry jobs during the
last eight years, an average of 1,800 jobs per year.

Figure 8

            Kansas City Employment Trends in Exporting Industries, 2010-2018
                   Dotted lines represent growth trend if Kansas City grew at the national rate

180,000
160,000
140,000
120,000
100,000
80,000
60,000
40,000
20,000
     0

           Construction   Manufacturing   Wholesale   Health Care and   Information   Finance and   Transportation Professional,
                                           Trade           Social                      Insurance         and       Scientific, and
                                                        Assistance                                   Warehousing     Technical
                                                                                                                      Services

Source: JobsEQ

Fortunately, this loss has been more than offset by growth in the professional, scientific and technical
services industry. This sector, which totals 100,000 jobs and includes Cerner and the region’s
architecture and engineering firms, such as Burns & McDonnell, Black & Veatch, Populous and BNIM
added 27,000 jobs between 2010 and 2018. The growth in health care has also buoyed the Greater
Kansas City economy, though its growth has only recently begun to tick slightly above the U.S.
average. Health care, totaling 160,000 jobs, has grown by nearly 29,000 jobs since 2010, making it
both the region’s largest industry and biggest job producer.

But when we look at peer metros, the story isn’t as rosy. The region is growing, but not as fast as
its peers. KC Rising is the region’s business-led initiative aimed at increasing Greater Kansas City’s
economic competitiveness. This collaborative effort, sponsored by the Civic Council of Greater Kansas
City, the Greater Kansas City Chamber of Commerce, the Kansas City Area Development Council
and the Mid-America Regional Council, compares the Kansas City region’s performance against 30
other peer metros, the 15 immediately larger by population and the 15 immediately smaller. KC Rising
measures the region’s overall economic competitiveness by its growth in three key metrics: GDP,
quality jobs (defined as occupations that either pay above the median wage or have a career path
leading to such a job) and median household income. Unfortunately, in recent years, growth is slower
here than the peer average on each metric.
Figure 9

                                           GDP Growth
                              KC vs. Average of KC Rising Peers
 14%
 12%                                                                                12.5%
 10%
  8%
  6%                                                                                5.7%
  4%
  2%
  0%
             2013              2014                  2015             2016      2017

                                      Kansas City        31-Peer Average

Source: Bureau of Economic Analysis

Figure 10

                           Percent Change in Quality Jobs
                              KC vs. Average of KC Rising Peers

 14%
 12%
 10%
                                                                                    9.3%
  8%
  6%                                                                                5.8%
  4%
  2%
 0%
            2015 Q2           2016 Q2               2017 Q2          2018 Q2   2019 Q2

                                      Kansas City        31-Peer Average

Source: Jobs EQ
Figure 11
Real Median Household Income Growth
KC vs. Average of KC Rising Peers
14%
12% 11.8%
10%
8% 8.5%
6%
4%
2%
0%
-2%
2013 2014 2015 2016 2017 2018
Kansas City 31-Peer Average
Source: Census Bureau, American Community Survey
Despite growing slower than its peers, the Kansas City area unemployment rate continues to run
about one-half a percentage point below the U.S. unemployment rate. As of August 2019, the latest
period where data for both areas is available, only 3.3 percent of metropolitan Kansas City’s labor
force was out of a job and actively looking for work, compared to 3.8 percent nationally.
Figure 12
Unemployment Rate, KC vs. U.S.
(not seasonally adjusted)
7%
6%
5%
4% 3.8%
3% 3.3%
2%
1%
0%
2015 2016 2017 2018 2019
KC U.S.
Source: Bureau of Labor Statistics
That local unemployment remains lower than average is remarkable because the Kansas City area’s
total employment growth has also been lower than average over the last two years, by between one-
quarter and one-half a percentage point since 2017. This may mean worker shortages are even more
severe here than elsewhere in the nation, and this is constraining the metro area’s growth.Figure 13
KC vs. U.S. Total Payroll Employment Growth
Percent change in annual average (2019 is YTD through August)
2.4%
2.1% 2.1%
1.8%
1.6% 1.6% 1.7% 1.6%
1.3%
1.1%
2015 2016 2017 2018 2019
KC U.S.
Source: Bureau of Labor Statistics (CES)
One sector where growth appears to be slowing is construction. After a year in which the value of
construction contracts in the Kansas City area ballooned by 43 percent in 2018, in the first seven
months of 2019 the total value of construction has dropped by 19 percent. Overall, the value of
construction contracts through July 2019 is down $0.9 billion from a year earlier, to $4.0 billion, with
the declines mainly split between residential construction and non-building construction, the latter
being primarily infrastructure.
Figure 14
Value of Construction Contracts
Percent change in annual average (2018-19 is YTD through July)
104%
77%
51%
38% 43%
25%
17% 20%
9% 8%
-1% -10% -11%
-12% -5%
-13%
-18% -19%
-23%
-51%
2015 2016 2017 2018 2019
Residential Non-residential Non-building Total
Source: Dodge Construction PotentialsThe decline in residential construction seems mainly to be occurring in single-family unit construction,
as single-family building permits are down by over 1000 in 2019 compared to 2018, based on data
through July, while the number units in multi-family permits is off by only 100. Overall, the number of
residential permits through the first seven months of the 2019 is 24 percent below the prior year.
Figure 15
Residential Building Permit Growth
Percent change in annual averages (2018-19 is YTD through July)
17%
13% 13% 14%
10%
8%
1%
-3%
-7% -7%
-8%
-11%
-24%
-30%
-33%
2015 2016 2017 2018 2019
SF MF Total
Source: Dodge Construction Potentials
Yet, despite this apparent sluggishness of the Kansas City area economy relative to the nation,
the most recent employment data suggests the region’s economic growth may be accelerating. If
we examine year-ago change on a monthly basis, rather than looking at annual and year-to-date
averages, we see that total employment appears to be growing at a brisk 1.8 percent clip in August
2019, more than a percentage point faster than earlier in the year and also faster than the 1.4 percent
growth rate of U.S. employment over the same period. This pattern of local economic acceleration
in the face of a slowing U.S economy is not unprecedented. In fact, it mirrors the region’s economic
performance in 18 months before the onset of the Great Recession.Figure 16
Total Non-Farm Employment
Monthly percent change from one year ago
3.0%
2.5%
2.0%
1.8%
1.5%
1.4%
1.0%
0.5%
0.0%
2015 2016 2017 2018 2019
KC U.S.
Source: Bureau of Labor Statistics (CES)KC FORECAST Methodology and assumptions MARC input the U.S. forecast into the REMI model, from which it derives the local forecast based on historical relationships between the local and national economies. In essence, the national economy creates demands for goods and services that metropolitan economies are modelled as supplying. Their success depends on the industries they specialize in, their relative costs of doing business and their overall size. Metros that specialize in producing goods and services in high demand, that produce them at lower cost, and that are large enough to have well-integrated economies and ready access to specialized labor tend to be more successful in meeting national demands. MARC uses the REMI model for both long-range (30-year) and short-range (2-year) forecasts as well as to conduct economic impact analyses of proposed major public investments and has generally found it to produce reasonable results. The REMI model works in annual increments. Therefore, the national forecast from RSQE is input on a fourth-quarter to fourth-quarter basis. The Kansas City area forecast is further calibrated so that it matches the local industry employment trends given by the Bureau of Labor Statistics Current Employment Statistics (CES) estimates of payroll employment through August 2019. However, while the trends come from BLS, the level of employment comes from the Bureau of Economic Analysis (BEA), as BEA uses a more comprehensive definition of employment that counts the self-employed as well as wage and salary workers. Finally, the $1.5 billion investment in a new terminal at KCI is substantial. Because the bonds are being retired by the airlines, the construction expenditures represent net new money injected into the region that will produce a substantial, though temporary, economic impact. This investment is not reflected in the historical trend information that drives regional economic forecasting models. Given construction has started and will extend throughout the 2-year forecasting period, the value of this construction was input into the REMI model as a policy variable. The model then calculated how those dollars would circulate through the regional economy to create jobs and income beyond the construction sector. Forecast The combination of national and local assumptions yields a forecast that the Kansas City metro economy will grow slightly faster than the U.S. economy in 2019, reflecting the local acceleration seen in the latest data. Measured on a fourth-quarter to fourth-quarter basis, GDP is expected to growth 2.3 percent in Greater Kansas City compared to the 2.2 percent growth rate projected for the nation. The region’s recent economic acceleration, in combination with the additional stimulus provided by the airport construction, carries forward into 2020 resulting in it maintaining a slight edge over the nation, though both areas see a substantial reduction in their overall GDP growth, to 1.8 percent locally vs. 1.7 percent nationally. In the absence of any additional stimulus, however, the prior historical relationship reasserts itself in 2021, with the U.S. growing slightly faster than metropolitan Kansas City as U.S. GDP grows 1.6 percent between the fourth quarter of 2020 and 2021 compared to 1.5 percent in the Kansas City area.
Figure 17

                                  KC vs. U.S. GDP Forecast
                          Fourth-quarter to fourth-quarter percent change

                   2.5%
                                  2.3%
                                          2.2%
            1.9%
                                                           1.8%
                                                                  1.7%
                                                                               1.5%   1.6%

             2017-18                2018-19                 2019-20             2020-21

                                              KC GDP   U.S. GDP

Source: RSQE, MARC

The same patterns hold for overall employment growth as for GDP. Employment growth in the region
is projected to accelerate to 1.5 percent in late 2019 compared to one year ago while U.S. employment
growth is expected to decelerate to 1.3 percent. Greater Kansas City maintains a slight edge in job
growth relative to the nation during 2020, 1.1 percent to 1.0 percent for the nation. This advantage
slips away, though, in 2021 when local employment growth by the fourth quarter is forecast to slip to
0.9 percent while the U.S. employment growth stabilizes at 1.1 percent.

Figure 18

                             KC vs. U.S. Employment Forecast
                          Fourth-quarter to fourth-quarter percent change

                   1.8%

                                   1.5%
                                          1.3%
                                                           1.1%
            1.0%                                                  1.0%                1.1%
                                                                               0.9%

              2017-18                2018-19                 2019-20             2020-21

                                   KC Employment       U.S. Employment

Source: RSQE, MARC
Over the entire period over which the REMI model was run, 2017 to 2021, the Kansas City area’s overall
economic growth as measured by inflation-adjusted (real) GDP is expected to grow an average 2.0
percent per year. Wage growth, as indicated by the growth rate in real personal income per job,
is expected to follow closely behind, at 1.8 percent over and above the rate of inflation. This is a
substantial improvement from earlier in the recovery when wages were tracking just barely above the
inflation. Together, increased production and incomes produce an increase in the demand for workers,
which is projected to grow an average of 1.1 percent over the modelled period.
Figure 19
KC Economic Indicators
Average annual percent change, 2017-2021
2.0%
1.8%
1.1%
Real GDP Real Personal Income/job Employment
Source: MARCEmployment by Industry
Due to differences in scale and sectoral variability, Figure 20 breaks the model period into two in
order to more clearly describe the industrial employment changes taking place. The first, FIgure 20A,
displays the changes expected between 2017 and 2019, a period that is mostly, though not entirely,
historical. The second, Figure 20B, describes the changes between 2019 and 2021 that are purely a
forecast. All changes are measured on a fourth-quarter to fourth-quarter basis.
Overall, the Kansas City area economy is projected to add 33,200 jobs over the two-year period
between 2017 and 2019, with total job growth of 13,200 in 2017-18 and 20,400 jobs in 2018-19,
reflecting the regional economy’s recent acceleration. Health care is projected to add more than
12,000 jobs, with two-thirds of that growth the result of a 2019 acceleration. Somewhat surprisingly,
state and local government employment is expected to increase the second fastest during this two
year period, by more than 8,000 jobs. Not all of this is in general purpose government, as this industry
also includes public schools. Professional/technical services employment is projected to add the third
most jobs during the period, at about 6,000, while transportation and warehousing is anticipated to
add 4,000 jobs during the two-year period, though most of that occurred in 2018.
Construction, manufacturing, wholesale trade and federal civilian government all are expected to
see significant spikes in job growth during 2019 as compared to 2018, the latter partly due to the
relocation of USDA research agencies to the Kansas City area. On the downside, finance and insurance
are expected to lose 5,000 jobs during 2017-18 and 2018-19, while retail will lose an estimated 3,000
jobs and information another 2,000 jobs. While the declines in information employment have become
routine locally and brick and mortar retail’s troubles are national in scope, finance and insurance had
been mostly stable in the Kansas City area until recently, and the reasons for its decline in jobs is not
well understood.
Figure 20A
Employment Change (4Q/4Q) by Industry, 2017-2019
Industries with more than 20,000 employees
Health care
State and Local Government
Professional/technical services
Figure 19
Transportation and warehousing
Administrative; Waste
Construction KC Economic Indicators
Manufacturing
Average annual percent change, 2017-2021
Wholesale trade
Real estate
2.0%
Federal Civilian
Accommodation and food 1.8%
Management of companies
Leisure
1.1%
Other services
Education; private
Information
Retail trade
Finance and insurance
Real GDP -4,000 Real-2,000 0
Personal Income/job2,000 4,000 6,000
Employment 8,000 10,000
2017-18 2018-19
Source: MARCFigure 20B
Employment Forecast (4Q/4Q) by Industry, 2019-2021
Industries with more than 20,000 employees
Health care
Professional/technical services
Accommodation and food
Construction
Administrative; Waste
Other services
State and Local Government
Real estate
Transportation and warehousing
Education; private
Finance and insurance
Leisure
Management of companies
Wholesale trade
Information
Federal Civilian
Retail trade
Manufacturing
-1,000 0 1,000 2,000 3,000 4,000
2019-20 2020-21
Source: MARC
Moving forward, the forecast calls for job growth at reduced rates across virtually all sectors of the
Kansas City metropolitan economy. Over the two-year forecast period between the end of 2019 and
the end of 2021, overall job growth is expected to ratchet down to 29,300, with 16,200 occurring
in 2019-20 and 13,100 occurring in 2020-21. Health care is forecast to again lead the way, with
jobs growing by close to 6,000 over the two-year period. It is followed by professional/technical
services, which is forecast to add 4,500 jobs. Accommodation and food will grow by 3,500 jobs while
construction, in part due to the new KCI terminal, will add 3,000 jobs between fourth-quarter 2019
and fourth-quarter 2021.
While overall growth is projected to slow, some sectors that have been losing jobs rapidly are
projected to be less of a drag on the regional economy in the near-term future. In particular,
information is expected to stabilize while finance and insurance is projected to add back roughly 700
jobs, perhaps as a result of additional lending activity spurred by lower interest rates. Retail trade still
loses jobs, but only about 500. Manufacturing is unable to continue to grow in the face of slowing
national and international economies, but its losses are also modest at about 600 jobs over the
two-year period.Figure 21
Total KC Employment Growth
Change in jobs, fourth-quarter to fourth-quarter
25,000
20,400
20,000
16,200
14,300
15,000 13,100
10,000
5,000
-
2017-18 2018-19 2019-20 2020-21
Source: MARC
Conclusion
With the daily news filled with international conflicts, impeachment inquiries and trade uncertainties
occurring simultaneously with a slowing U.S. economy, the prospects for continued economic
growth seem shakier now than at any time since the Great Recession. Yet these worrisome signs
are in conflict with a strong labor market achieving 50-year low unemployment rates, rising labor
force participation with inflation still running below established targets. Combined with the FOMC
willingness to undertake accommodative monetary policy to keep the economic expansion continuing
as long as possible, this makes a recession unlikely in the time frame of this forecast.
Locally, the Kansas City economy has been growing slower than the nation and its peers over the last
couple of years. However, it has begun to accelerate just as the U.S economy slows. This, combined
with extra stimulus coming from the construction of a new terminal at KCI, means it is forecast to
grow slightly faster than the U.S. in 2019 and 2020 before once again dropping below the national
pace. Nonetheless, it is projected to add close to 30,000 jobs over the next two years.
The region’s lackluster pace of growth might reverse should Sprint’s recently approved merger with
T-Mobile pan out as promised, with the Overland Park campus becoming a second headquarters.
Historically, the region’s economic performance has been tied to Sprint’s. In the 1990s, when it was
growing rapidly, the Kansas City area economy grew faster than the national average. Since Sprint’s
troubles began around the turn of the century, its job losses and reduced flow of dollars to the region
kept the Kansas City area economy from firing on all cylinders and it started to slip behind its peers.
There are many obstacles to achieving the vision of a thriving second headquarters, however. Until
events become clearer, this forecast steers a middle road where losses stop but substantial new
growth does not occur within the forecast horizon.
Today, the key constraint on growth is access to talent. This is especially true in an area like Kansas
City where the unemployment rate is even lower than nation’s. The long expansion is finally bringing
brighter economic prospects in terms of employment and wages to those who so far had been left
behind, but there is much to be done to make sure every person is contributing at his or her highest
level. Developing the policies and strategies that allow metropolitan Kansas City to continually
improve its ability to attract, retain and develop talent is a high priority of KC Rising and the Greater
Kansas City Chamber of Commerce. As those efforts bear fruit, they should help the Kansas City area
regain its position as a rising U.S. metro.ARE U.S.
RECESSION
ODDS REALLY
SO HIGH?
Prepared by:
Sal Guatieri
Director and Senior Economist
BMO Capital MarketsThe trade war and inverted yield curve have fanned recession fears. Economists now peg the chance of a downturn by the end of 2020 at around 38%, with the trade tiff cited as the chief concern [1]. Based on the recent negative 40-bp spread between 10-year and 3-month Treasuries, the New York Fed’s equation suggests similar odds. An inverted curve is ominous, having correctly signaled all seven U.S. recessions in the past half century, with an average lead time of just over a year (Chart 1) [2]. In practical terms, an inverted curve often spells trouble because banks are less willing to lend when long-term yields are below short-term rates. The current inversion, however, may overstate recession prospects. Past inversions were often driven by intense Fed tightening. This time, the inversion is due more to long-term rates plunging from already-low levels. This is partly because sovereign bond yields in other nations have fallen and in many cases turned negative. But it is largely due to concern that the trade war might escalate and cause further economic damage. As a result, investors are anticipating almost 75 basis points of Fed rate cuts by the end of 2020, even though the stimulus does not seem warranted by economic conditions alone. Crucially, financial conditions are far from punitive even after nine Fed rate hikes since 2015. In fact, they point more to growth close to long-run potential of around 2% than to contraction (Chart 2). Real policy rates are nowhere close to levels prevailing before recessions and are poised to turn negative if the Fed cuts rates two more times this year, as expected. The real fed funds rate exceeded 2% prior to the last eight downturns, but peaked at less than 0.5% this cycle (Chart 3). It’s not just low rates that are supporting financial conditions. Corporate credit spreads, though widening, remain near long-run norms; equity markets are testing record highs (Chart 4); and, house prices, though slowing, continue to rise. The resulting increase in household wealth is fanning consumer spending and the large service sector, providing resilience to the expansion. The only conditions applying a brake to the expansion are the rising U.S. dollar, up 3% y/y to 13-year highs on a trade- weighted basis, and elevated policy uncertainty, largely due to the trade war. If the Fed lowers rates two more times this year and the yield curve turns positive in response, our research suggests recession odds would drop to less than 20% next year (Chart 5) [3]. This assumes stock prices, credit spreads, the dollar and house prices remain little-changed in the context of no new tariffs. Based on financial conditions alone, recession risks are a mere 6%. While it’s dangerous to ignore the yield curve’s signal, the upshot is that recession odds would fall sharply if the Fed cuts
rates and the White House reins in trade tensions. Both
measures would help normalize the yield curve (as
we are seeing in recent days with the 10s/3s spread
shrinking to -9 bps on more encouraging words and
actions from U.S. and Chinese officials) and improve
business confidence. To boot, households have plenty of
scope to borrow given record-low debt service costs.

With the Fed poised to cut rates next week, the biggest
threat to the economy is a serious escalation in tariffs.
This would cause the yield curve to stay inverted, equity
prices to fall, and credit spreads to widen. The resulting
tighter financial conditions and likely pullback in hiring
and consumer spending would send recession odds
soaring. While the Fed would also ease further, the full impact on the economy would likely occur too late
(up to six quarters in our equation) to prevent a downturn.

BOTTOM LINE: The chance of some type of U.S. recession in 2020 is likely around 25%-to-30% due to the
unpredictable trade war. While that’s unsettling, supportive financial conditions—in particular low interest
rates—should keep the expansion alive barring an escalation in tariffs. If a downturn does occur, it should be
less severe than usual because of already low rates and less debt-constrained households.

Endnotes:                                                                                         This document is not to be construed as an offer to sell, a solicitation for or an offer
[1] Blue Chip Economic Indicators, September 10, 2019. ^                                          to buy, any products or services referenced herein (including, without limitation, any
[2] For a full discussion of the yield curve’s historical track record                            commodities, securities or other financial instruments), nor shall such Information be
                                                                                                  considered as investment advice or as a recommendation to enter into any transaction.
at predicting recessions and an explanation of why its signal                                     Each investor should consider obtaining independent advice before making any financial
may have weakened, see: Gregory, Michael and Robert Kavcic,                                       decisions. This document is provided for general information only and does not take into
                                                                                                  account any investor’s particular needs, financial status or investment objectives. BMO
January 11, 2019 Focus, “Recession Obsession”; https://economics.                                 Capital Markets or its affiliates will buy from or sell to customers the securities of issuers
bmo.com/en/publications/historical/b8ac35af-fad0-41c5-9c07-                                       mentioned in this report on a principal basis. BMO Capital Markets or its affiliates, officers,
                                                                                                  directors or employees have a long or short position in many of the securities discussed
a91a264b1c1e/. ^                                                                                  herein, related securities or in options, futures or other derivative instruments based
[3] Our in-house equation regresses a binary dependent variable                                   thereon. The reader should assume that BMO Capital Markets or its affiliates may have a
(that takes the value of 1 in recessions and 0 in expansions) against                             conflict of interest and should not rely solely on this report in evaluating whether or not
                                                                                                  to buy or sell securities of issuers discussed herein.
seven explanatory variables (yield curve slope, real fed funds rate,                              Dissemination of Research
stock prices, house prices, oil prices, corporate credit spreads and                              Our publications are disseminated via email and may also be available via our web site
                                                                                                  https://economics.bmo.com. Please contact your BMO Financial Group Representative for
the trade-weighted dollar) over the period 1980Q3 to 2019Q2. All                                  more information.
the variables are significant at the 5% level or better. A relatively                             Conflict Statement
                                                                                                  A general description of how BMO Financial Group identifies and manages conflicts
large standard error (19%) indicates a wide confidence band                                       of interest is contained in our public facing policy for managing conflicts of interest
around the estimated probability of recession. ^                                                  in connection with investment research which is available at http://researchglobal.
                                                                                                  bmocapitalmarkets.com/Public/ Conflict_Statement_Public.aspx.
General Disclosure                                                                                ADDITIONAL INFORMATION IS AVAILABLE UPON REQUEST
 “BMO Capital Markets” is a trade name used by the BMO Financial Group for the                    BMO Financial Group (NYSE, TSX: BMO) is an integrated financial services provider
wholesale banking businesses of Bank of Montreal and its subsidiaries BMO Nesbitt Burns           offering a range of retail banking, wealth management, and investment and corporate
Inc., BMO Capital Markets Limited in the U.K. and BMO Capital Markets Corp. in the U.S.           banking products. BMO serves Canadian retail clients through BMO Bank of Montreal
BMO Nesbitt Burns Inc., BMO Capital Markets Limited and BMO Capital Markets Corp                  and BMO Nesbitt Burns. In the United States, personal and commercial banking clients
are affiliates. This document is issued and distributed in Hong Kong by Bank of Montreal          are served by BMO Harris Bank N.A., Member FDIC. Investment and corporate banking
(“BMO”). BMO is an authorized institution under the Banking Ordinance (Chapter 155                services are provided in Canada and the US through BMO Capital Markets. BMO Capital
of the Laws of Hong Kong) and a registered institution with the Securities and Futures            Markets is a trade name used by BMO Financial Group for the wholesale banking
Commission (CE No. AAK809) under the Securities and Futures Ordinance (Chapter                    businesses of Bank of Montreal, BMO Harris Bank N.A, BMO Ireland Plc, and Bank of
571 of the Laws of Hong Kong). BMO does not represent that this document may be                   Montreal (China) Co. Ltd. and the institutional broker dealer businesses of BMO Capital
lawfully distributed, or that any financial products may be lawfully offered or dealt with,       Markets Corp. (Member SIPC), BMO Nesbitt Burns Securities Limited (Member SIPC) in
in compliance with any regulatory requirements in other jurisdictions, or pursuant to an          the U.S., BMO Nesbitt Burns Inc. (Member Canadian Investor Protection Fund) in Canada,
exemption available thereunder.                                                                   Europe and Asia, BMO Capital Markets Limited in Europe, Asia and Australia and BMO
This document is directed only at entities or persons in jurisdictions or countries where         Advisors Private Limited in India.
access to and use of the information is not contrary to local laws or regulations. Their          “Nesbitt Burns” is a registered trademark of BMO Nesbitt Burns Inc., used under license.
contents have not been reviewed by any regulatory authority. Bank of Montreal or its              “BMO Capital Markets” is a trademark of Bank of Montreal, used under license. “BMO
subsidiaries (“BMO Financial Group”) has lending arrangements with, or provide other              (M-Bar roundel symbol)” is a registered trademark of Bank of Montreal, used under
remunerated services to, many issuers covered by BMO Capital Markets. The opinions,               license.
estimates and projections contained in this report are those of BMO Capital Markets as            ® Registered trademark of Bank of Montreal in the United States, Canada and elsewhere.
of the date of this report and are subject to change without notice. BMO Capital Markets          ™ Trademark Bank of Montreal in the United States and Canada.
endeavours to ensure that the contents have been compiled or derived from sources                 © COPYRIGHT 2019 BMO CAPITAL MARKETS CORP.
that we believe are reliable and contain information and opinions that are accurate and           A member of BMO Financial Group
complete. However, BMO Capital Markets makes no representation or warranty, express or
implied, in respect thereof, takes no responsibility for any errors and omissions contained
herein and accepts no liability whatsoever for any loss arising from any use of, or reliance
on, this report or its contents. Information may be available to BMO Capital Markets or its
affiliates that is not reflected in this report. The information in this report is not intended
to be used as the primary basis of investment decisions, and because of individual client
objectives, should not be construed as advice designed to meet the particular investment
needs of any investor.
TRADE,
VOLATILITY
HAMPER GROWTH
IN LATE 2019
Prepared by:
Derek Hamilton
Global Economist
Ivy Investment Management CompanyVolatility has been the story of 2019. The markets have dealt with uncertainty around global trade
restrictions and recession fears. Ivy Investments believes these headwinds will cause global economic
growth to remain relatively weak for the remainder of the year. We forecast global gross domestic product
(GDP) growth at 3.1% for the year, which is down from our initial 2019 projection of 3.4%.
Despite a tepid 2.3% GDP growth rate through the first half of the year, the U.S. economy continues to be
the engine that drives the global economy. However, the current status of global trade is an area of concern
for us.
For much of the year, the trade war between the U.S. and China has been the focal point for markets.
We are concerned the Trump administration’s latest round of tariffs – a 15% tax on certain Chinese-made
consumer goods – could hamper consumer spending, which consistently is the key driver of the U.S.
economy. We are hopeful the weaker trajectory in economic growth might encourage President Trump to
consider a “cease fire” in the trade war and halt any additional tariffs until after the 2020 elections.
After two consecutive quarterly interest rate cuts by the Federal Reserve, we believe signs of economic
slowing could prompt the Fed to cut rates once more by year’s end.
A look at other economies:
• The pace of economic growth in Europe has weakened to below 1% on an annualized basis, mainly
due to the drag of global trade and Brexit uncertainty. While the conclusion of the U.K.’s exit from the
European Union remains unclear, we anticipate eurozone growth will remain weak through the rest of
2019.
• China’s economy continues to slow. While official GDP data slowed to 6.2% in the second quarter –
down slightly from 6.4% from the previous period – monthly data through August pointed to further
weakness in the third quarter.
• In India, a reduction in the corporate tax rate includes a provision that allows lower tax rates for
manufacturing companies that establish bases of production in the country. This is clearly an effort to
attract companies looking to diversify supply chains away from China.
Ivy Investment Management Company is a subsidiary of Waddell & Reed Financial, Inc. (NYSE: WDR).
Past performance is not a guarantee of future results. Risk factors: Investment return and principal value will fluctuate, and it is
possible to lose money by investing. International investing involves additional risks, including currency fluctuations, political or
economic conditions affecting the foreign country, and differences in accounting standards and foreign regulations. These risks are
magnified in emerging markets. Fixed income securities are subject to interest rate risk and, as such, the net asset value of a fixed
income security may fall as interest rates rise.
The opinions expressed are those of Ivy Investment Management Company and are not meant as investment advice or to predict or
project the future performance of any investment product. The opinions are current through October 2019, are subject to change at
any time based on market and other current conditions, and no forecasts can be guaranteed. This commentary is being provided as a
general source of information and is not intended as a recommendation to purchase, sell, or hold any specific security or to engage in
any investment strategy. Investment decisions should always be made based on an investor’s specific objectives, financial needs, risk
tolerance and time horizon.A PREVIEW OF
THE GREATER KC
REPORT
http://bit.ly/thegreaterkcreportGross Domestic Product by County Sources: My SideWalk & U.S. Bureau of Economic Analysis Release December 12, 2018
FUEL TAX BY STATE
                                    70       Fuel Tax by State
                                    60
                                          58.7

                                    50
FUEL TAX RATE PER GALLON IN CENTS

                                    40

                                                                                                                                                KS
                                    30
                                                                                                                                                                                                             MO

                                                                                                                                                24.03
                                    20

                                                                                                                                                                                                               17.35
                                                                                                                                                                                                             14.65
                                    10

                                    0
                                           PA                                                                                                                                                                        AK

                                                               Average Number of Jobs within a 30 Minute Public Transit
                                                                                                                                                                Source: My SideWalk

                                          NASHVILLE                                                           6,949

                                          INDIANAPOLIS                                                                    8,205

                                          CINCINNATI                                                                                    9,738
2017

                                          PITTSBURGH                                                                                                    12,214

                                          DENVER                                                                                                                                                     16,739

                                          KANSAS CITY                                                    6,449

                                     0                  2000              4000                 6000               8000              10000       12000             14000                16000                18000
                                         Nashville-Davidson--Murfreesboro--Franklin, TN Area          Indianapolis-Carmel-Anderson, IN Area             Cincinnati, OH-KY-IN Area

                                         Pittsburgh, PA Area                                          Denver-Aurora-Lakewood, CO Area                   Kansas City, MO-KS Area

                                     October 2019 (August 2019 data)

                                             LATEST DATA                         EMPLOYMENT                              JOB POSTINGS           UNEMPLOYMENT                          EMP GROWTH
                                     AUGUST 2019                                   1,116,700                                  75,191                     3.3%                                1.7%
                                     JULY 2019                                     1,113,000                                  73,988                        4%                               1.5%
                                     Month-to-                                      +3,700                                    +1.6%                        -0.7                              +0.2
                                     Month Change
                                                                                                                                                                             Sources: Mid-America Regional Council
Geographic Disparities in Unemployment
Sources: My SideWalk 2013-17 ACS
Life Expectancy at Birth
Sources: My SideWalkNumber of Direct Flights
DIRECT Compared
FLIGHTS to Peer
COMPARED TOCities
PEER (2019)
CITIES
KANSAS CITY 54
INDIANAPOLIS 50
NASHVILLE 72
CINCINNATI 63
PITTSBURGH 63
DENVER 210
0 50 100 150 200 250
Bringing global innovation
back homeProud sponsor:
KC Chamber 2019
Economic Forecast
ssctech.com
WE
ARE
WE
ARE
HERE FOR GOOD
HereForGoodKC.com
©
2019 Blue Cross and Blue Shield of Kansas City is an independent licensee of the Blue Cross and Blue Shield AssociationPerspective that
works with your
business vision.
BMO Harris Commercial Bank
Bringing the right experts and resources to the table,
BMO Harris Commercial Bank uncovers opportunities
tailored to your goals. Our team is consultative and
collaborative, working with you to make connections
that not only build value, they drive results.
bmoharris.com/commercial
Chad Rock chad.rock@bmo.com
Banking products and services subject to bank and credit approval. BMO Harris Commercial Bank is a trade name used by BMO Harris Bank N.A. Member FDICPRESENTING SPONSORS IMPACT SPONSORS DEVELOPMENT SPONSORS CommunityAmerica Credit Union Grant Thornton US Bank Country Club Bank McAnany, Van Cleave & Phillips VanTrust Real Estate Ernst & Young McCownGordon Construction First National Bank mobank / BOK Financial
You can also read