The Travel Shock Gian Maria Milesi Ferretti - Brookings Institution
←
→
Page content transcription
If your browser does not render page correctly, please read the page content below
Hutchins Center Working Paper #7 4                                                              A u g u s t           2 0 2 1

 The Travel Shock
 Gian Maria Milesi Ferretti
 Hutchins Center on Fiscal & Monetary Policy
 The Brookings Institution

 ABSTRACT

 The COVID-19 pandemic has led to a collapse in international travel and tourism. This paper explores how the
 cross-country impact of the pandemic relates to countries’ dependence on these activities as a source of revenue.
 It first documents the size of the shock to net revenues from international travel and tourism for the balance of
 payments, which for the median highly tourism-dependent economy exceeded 10 percentage points of GDP,
 leading to a sizable current account deterioration. Indeed, empirical evidence suggests that current account
 adjustment in 2020 relative to pre-crisis forecasts was driven to an important extent by the collapse in revenues
 and expenditures on international travel as well as by the collapse in oil prices. On the economic growth front, the
 paper shows that the share of tourism activities in GDP is the single most important predictor of the growth
 shortfall in 2020 triggered by the COVID-19 crisis, even when compared to a variety of measures of the severity
 of the pandemic.

 Author’s email: gmilesiferretti@brookings.edu. The author is greatly indebted to Serkan Arslanalp, Maria Borga, Daniel
 Leigh, Paulo Medas, Louise Sheiner, David Wessel, and participants at a seminar at the Brookings Institution for very useful
 suggestions, and to the World Economic Outlook team at the International Monetary Fund for their help with the data.
 Jimena Ruiz Castro and Manuel Alcala Kovalski provided excellent research assistance.

_______________________________________________________________________

                                                                                         THIS PAPER IS ONLINE AT
                                                                  https://www.brookings.edu/research/the-covid-19-
                                                               travel-shock-hit-tourism-dependent-economies-hard/
1. Introduction
The COVID crisis has led to a collapse in international travel, as countries imposed limits on international
travel and individuals adopted social distancing measures. According to the World Tourism Organization
(UNWTO, 2021a) international tourist arrivals declined globally by 73 percent in 2020, with 1 billion
fewer travelers compared to 2019, putting in jeopardy between 100 and 120 million direct tourism jobs.
The same source notes that the decline in tourist arrivals during the global financial crisis of 2009 was
around 4 percent. Furthermore, this “travel shock” is continuing in 2021, as restrictions to international
travel persist—tourist arrivals for January-May 2021 are down a further 65 percent from the same period
in 2020, and there is substantial uncertainty on the nature and timing of a tourism recovery.
     In this paper we take a first look at the cross-country impact of the international travel shock during
2020. Using the largest possible sample of countries, we show that this impact has been very severe for all
tourism-dependent economies. Indeed, our main result is that on a cross-country basis the share of
tourism activities in GDP is the single most important predictor of the growth shortfall in 2020 triggered
by the COVID-19 crisis, even when compared to a variety of measures of the severity of the pandemic. For
instance, Grenada and Macao had very few recorded COVID cases in relation to their population size and
no COVID-related deaths in 2020—yet their GDP contracted by 13 percent and 56 percent, respectively.
     Our analysis proceeds in three stages. We first identify the key characteristics of countries with high
net revenues from international tourism. We find that those countries are generally small, have GDP per
capita in the middle-income and high-income range, and are preponderately net debtors. In contrast,
countries with high net spending on international tourism tend to be large, with a relatively modest ratio
of such spending to GDP. For instance, China, the country with the largest international travel deficit in
absolute terms, had net spending on international travel averaging 1.7 percent of GDP during 2015-19.
     We then document how the travel shock has affected the balance of payments in 2020. We show that
the magnitude of the decline in net revenues from international travel for small tourism-dependent
economies was staggering (often exceeding 10 percent of GDP). This loss in net exports led to a current
account deterioration that, while sizable, was much smaller. Specifically, imports of goods declined
(reflecting both a contraction in domestic demand and a decline in tourism inputs such as imported food
and energy), and the primary income balance improved with the decline in returns for foreign-owned
hotel infrastructure. Overall, we find that the travel shock, together with the big reduction in oil prices,
explain an important share of global current account adjustments in 2020 compared to pre-crisis
forecasts.
     Finally, we show that countries more dependent on tourism (both domestic and international)
experienced more severe economic downturns in 2020 compared to pre-crisis expectations. To do so, we
present some simple cross-country regressions that relate the COVID-19-related shortfall in growth in
2020 to a variety of controls, including in particular measures of the severity of the pandemic, measures
of the sectoral composition of GDP, such as the share of value added accounted for by manufacturing and
agriculture, and estimates of the pre-crisis share of GDP accounted for by tourism activities. The latter
measure is not only statistically very significant, but also accounts for a sizable fraction of the cross-
country variance in the growth decline. This, together with the evidence on the importance of the share of
agricultural and manufacturing activity in GDP in explaining the intensity of 2020 growth shortfalls,
suggests that the sectoral composition of pre-pandemic output has been a crucial factor in explaining the
extent of economic stress experienced in 2020.
_________________________________________________________________________________________________________

The Travel Shock                                                                                           2
HUTCHINS CENTER ON FISCAL & MONETARY POLICY AT BROOKINGS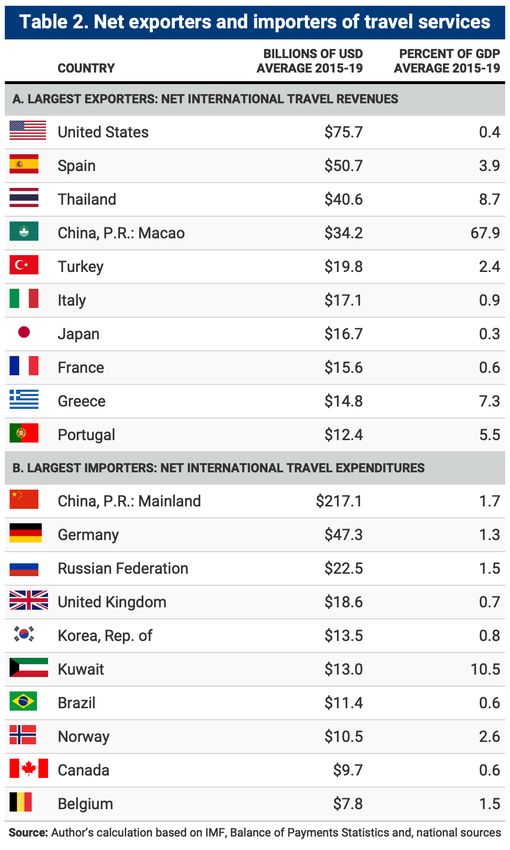
Given the unprecedented nature of a global shock of this magnitude on the tourism industry, the
related literature is somewhat limited. With regard to actual developments and forecasts, a number of
publications by international organizations have highlighted the impact of the crisis on the tourism
industry and outlined possible recovery scenarios (see, for instance, UNCTAD, 2021; UNWTO, 2021b; and
World Travel and Tourism Council, 2021). MacDonald et al (2020) provide some early estimates of the
potential impact of the COVID-19 pandemic on the travel and hospitality sectors. Skare et al. (2021) use
pre-crisis data to estimate the potential repercussions of the crisis on the travel and tourism industry.
Other research on the impact of shocks to the travel and tourism industry has focused on episodes such as
the aftermath of the September 11 terrorist attacks (Blunk et al, 2006); the impact of the SARS pandemic
and Avian flu on tourism (Kao et al, 2008); and the consequences of natural disasters on tourism
(Rossello et al, 2020).
     A growing literature related to this paper has examined the sectoral impact of the COVID-19 crisis on
output and employment, and how it differs from previous recessions (see, for instance, chapters 2 and 3 in
IMF, 2021a as well as Muggenthaler et al, 2021). In terms of methodology (relating the response to a
global shock to pre-existing country characteristics), the paper is related to Lane and Milesi-Ferretti
(2011, 2012) who focus on economic performance during the global financial crisis, and show that
precrisis current account imbalances are a very powerful predictor of subsequent economic performance
during the global financial crisis of 2008-2009.
     The remainder if the paper is organized as follows. Section II presents key characteristics of the
balance of payments of tourism-dependent economies, and documents the magnitude of the COVID shock
on its different components. Section III relates cross-country deviations in 2020 GDP growth from pre-
crisis forecasts to the importance of tourism in the economy, as well as measures of pandemic intensity
and other controls, and section IV concludes.

2. Travel revenues and the balance of payments

In the balance of payments, the category of services most affected by the restrictions on international
travel is “travel services”, which includes both personal travel and business travel. According to the 6th
edition of the Balance of Payments Manual (IMF, 2013): “Travel credits cover goods and services for
own use or to give away acquired from an economy by nonresidents during visits to that economy.
Travel debits cover goods and services for own use or to give away acquired from other economies by
residents during visits to these other economies” (page 166). We also examine a second category of
services, namely transport. According to the IMF (2013): “Transport is the process of carriage of people
and objects from one location to another as well as related supporting and auxiliary services. Also
included are postal and courier services” (page 164). Entries in this category can be classified by mode of
transport (air, sea, rail, road, pipeline…) or by what is carried (passenger or freight). An example of
passenger transport revenues are tickets sold to nonresidents by a domestic airline.

2.1 Pre-crisis

We start by characterizing the relative importance of these categories of services across countries prior to
pandemic, before turning to the impact of the “travel shock.” In the presentation of international travel
and transport statistics, we focus on the balance of trade in those services, rather than gross export
revenues, to take into account the fact that the international travel restrictions imposed in 2020 may have

_________________________________________________________________________________________________________

The Travel Shock                                                                                           3
HUTCHINS CENTER ON FISCAL & MONETARY POLICY AT BROOKINGS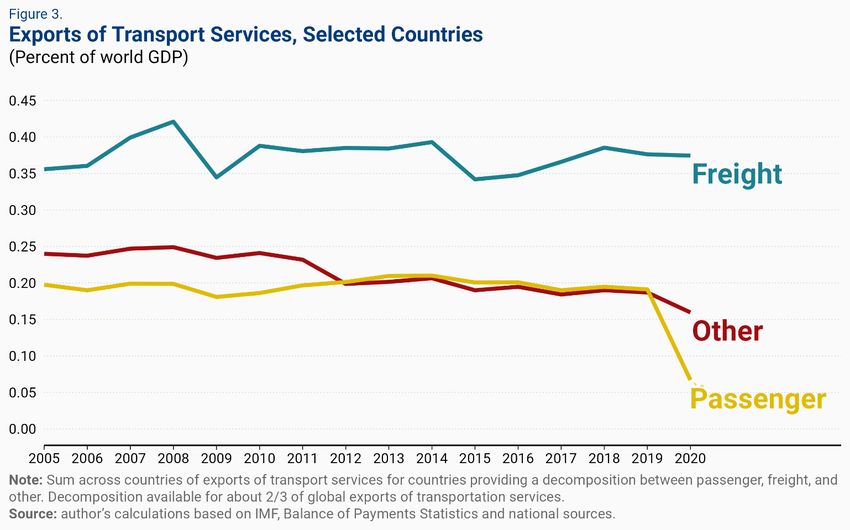
pushed domestic travelers that normally vacation overseas to remain in their home country, thus reducing
the impact on activity of the loss in external revenues.
     Global revenues and expenditures on international travel services were around $1.45 trillion in 2019,
having grown some 5 percent per year in nominal terms since the start of that decade, with a slightly
increasing share of world GDP (Figure 1). They represented some 23 percent of total revenues and
expenditures from international trade in services. For international transport services, global revenues
and expenditures were around $1 trillion dollars in 2019 (some 17 percent of total revenues and
expenditures on services).
     For tourism-dependent countries, the support to the balance of payments coming from travel services
is very substantial. Table 1 provides statistics for those economies in which the surplus from international
travel services exceeded 5 percent of GDP on average during the period 2015-19. For instance, in Croatia
over 2015-19 the average surplus in those service categories exceeded 15 percent of GDP, while it was
above 8 percent of GDP in the Dominican Republic and Thailand, 7 percent of GDP in Greece, and 5
percent in Portugal. But the majority of economies with large net external revenues from travel and
tourism consist of small islands in the Caribbean, the Pacific, and the Indian Ocean. In our sample, 20 of
the 37 economies with net revenues from travel and tourism exceeding 5 percent of GDP on average
during 2015-19 had GDP in 2019 below US$10 billion, and 24 of them had populations below 1 million.
Among those economies, median net revenues from foreign tourism exceeded 26 percent of GDP,
highlighting the central role played by the sector in economic activity. The most extreme example of the
importance of net external revenues from travel and tourism is Macao, where net revenues were around
68 percent of GDP during 2015-19. Even in absolute terms, Macao’s net revenues from tourism were the
fourth highest in the world, after the U.S., Spain, and Thailand (Table 2, panel 1).
     In contrast, for the countries that are net importers of travel and tourism services, the balance is
generally much smaller as a share of GDP. In absolute terms, the largest importer of travel services is
China (over $200 billion or 1.7 percent of GDP on average during 2015-19), followed by Germany and
Russia (Table 2, panel 2). The GDP impact for these economies of a sharp reduction in tourism outlays
overseas is hence relatively contained, but it can have very large implications on the smaller economies
their tourists travel to—a prime example being Macao for Chinese travelers.
     Table 3 provides a breakdown of the current account balance for tourism-dependent economies which
includes the merchandise income balance, the balance on services net of international travel, the primary
income balance (which mostly reflects investment income), and the secondary income balance (mostly
capturing workers’ remittances). From the perspective of their external accounts during the pre-COVID
period, countries relying heavily on tourism revenues had sizable current account deficits, very large
deficits in their merchandise trade balance (including imports of oil), as well as a negative primary income
balance (Table 3), being generally large net debtors in terms of their international investment position
(Table 4).1 One example is St. Kitts and Nevis: its average current account deficit in 2015-19 was over 8
percent of GDP; its surplus on the international travel balance was close to 30 percent, with its deficit on
merchandise trade of the same order of magnitude and a net debtor position exceeding 80 percent of
GDP. In contrast, most tourism-dependent economies receive positive secondary income flows (exceeding
10 percent of GDP in the cases of Jamaica and Jordan, for example). Table 4 also shows that while their

...

1.    The only net creditor countries among those with net international travel revenues above 5 percent of GDP are financial
      centers (Bahrain, Macao, Malta, Mauritius) and Iceland.

_________________________________________________________________________________________________________

The Travel Shock                                                                                                                4
HUTCHINS CENTER ON FISCAL & MONETARY POLICY AT BROOKINGS
GDP per capita in 2019 spanned a wide range, tourism-dependent countries are mostly in the middle-
income and high-income categories and—as already mentioned—smaller in terms of population.
A second category of services affected by the “travel shock” is transport. For this category, the crisis
took a heavy toll on passenger transport (particularly airline revenues). Revenues from freight transport
were much more resilient. Unfortunately, however, the breakdown between the different categories of
transport services is available for only a subset of countries, complicating the task of separating out
passenger transportation for a global analysis. For the countries providing a breakdown between different
transportation categories, passenger transportation accounts for about ¼ of the total, with freight
accounting for about half and the “other” category for the remaining quarter.2 The number of countries
for which net revenues from transport services is high is also much more limited than for travel services,
and includes in particular Panama, Cyprus, and Iceland, which also have high travel revenues (Table 5).
Among the more limited set of countries providing a breakdown of those net revenues, Table 5 also
identifies those more reliant on net revenues from international passenger transport in relation to their
GDP, which includes for countries hosting important international airlines such as Ethiopia, Iceland,
Panama, and Qatar.
2.2 The crisis
As the pandemic spread beyond China’s borders in early 2020, countries started to impose restrictions on
international travel. As a result, nominal revenues from travel and tourism in the first quarter of 2020
were about 25 percent lower than during the corresponding period in 2019. In the second quarter
revenues from international travel collapsed—they were more than 80 percent below their levels a year
before. Revenues recovered some ground over the summer, as many economies began to partially lift the
restrictions imposed during preceding months. However, they plummeted again in the last quarter of the
year as the pandemic intensified again, leaving revenues from international travel and tourism in 2020
over 60 percent below their nominal 2019 US dollar levels.
The hit to countries with heavy reliance on international tourism was unprecedented, with a median
decline in net revenues from international travel in 2020 exceeding 10 percent of GDP for our sample of
tourism-dependent economies.3 As a result of this shock, the current account balance of these economies
deteriorated significantly (a median worsening of close to 5 percent of GDP), with part of the decline in
international travel revenues offset by other components of the current account balance, as shown in
Figure 2. Specifically, the balance on goods showed a median improvement of about 2 percent of GDP,
reflecting the impact of lower oil prices (tourism-dependent economies being overwhelmingly oil
importers), lower imports of inputs in the tourism business, such as food, as well as a sizable decline in
domestic demand. The primary income balance, which captures investment income, also improved, as
revenues on foreign-owned tourism infrastructure declined. The secondary income balance, which
includes workers’ remittances, also showed some improvement, as nominal remittance revenues were
resilient while nominal GDP generally declined. In relative terms, the decline in revenues from tourism
was slightly less severe in countries where such revenues accrue primarily during the Northern
...
2. The “other” category includes services that are auxiliary to transport such as cargo handling charges, storing and warehousing,
etc. See IMF (2013).
3. See Behsudi (2020) for some illuminating examples of the impact of the shock on island economies.
_________________________________________________________________________________________________________
The Travel Shock 5
HUTCHINS CENTER ON FISCAL & MONETARY POLICY AT BROOKINGSHemisphere winter months (such as Australia, Austria, Brazil, New Zealand, Uruguay), and hence first-
quarter revenues are a larger share of the annual total.
The hit of the crisis on net revenues from transport services was more modest (Figure 3). While
revenues from passenger transportation declined by over 60 percent in nominal US dollar terms in 2020
for the countries providing such data, other transport categories, such as shipping and road freight
transport, were much more resilient: the overall decline in freight revenues was around 2 percent, and the
overall, the decline in nominal revenues and expenditures from transport services in 2020 was around 15
percent.
The decline in international travel, together with much-reduced mobility within countries, led to a
dramatic decline in oil demand and oil prices in 2020, with attendant implications for oil balances,
already highlighted above for tourism-dependent oil importers. In Table 6 we investigate the extent to
which the dependence on travel revenues and oil pre-COVID can the deviation of the current account in
2020, relative to its pre-COVID forecast (from the October 2019 World Economic Outlook), both
expressed in percent of GDP. With the exception of column (1) we exclude Kuwait, a big outlier, from the
regressions.4 Both the pre-COVID travel balance and the oil balance are statistically and economically
significant, including when we split the sample between advanced economies and emerging and
developing economies (columns 3-4). While during the 2008-2009 financial crisis current account
balances shrunk in absolute terms, here the evidence is more mixed—the coefficient on the 2015-19
current account balance is negative but imprecisely estimated.
One notable difference between these two groups lies in the size of the coefficient on the pre-COVID
travel balance, which is much higher for advanced economies. One explanation of this finding is that in
advanced economies the import content of net international travel revenues is lower than in emerging and
developing economies—particularly small island economies: these are more likely to exhibit higher
dependence on imported food, energy, and foreign-owned hotel infrastructure. As shown in columns (4)
and (5) the statistical and economic significance of the travel balance is driven by countries with positive
international travel balances, which—as highlighted above—exhibit much more significant cross-country
variation. In contrast, dependence on oil explains subsequent current account adjustment for both oil
exporters and oil importers (results available from the author).
Limitations to international travel have persisted in the first half of 2021, even though they have
decreased in May and June. As a result, international tourist arrivals for the first 5 months of the year
were down 85 percent compared to the first 5 months of 2019, and 65 percent relative to same period in
2020 (UNWTO, 2021b). While some recovery is likely to materialize during the third quarter, 2021 will
also prove to be a very difficult year for tourism-dependent economies, and there is sizable uncertainty on
the future speed of recovery. IMF forecasts envisage a further current account deterioration for tourism-
dependent economies, followed by a gradual improvement from 2022 onwards on expectations of a
recovery in international travel (Box 1 in IMF, 2021b). In contrast, the sharp rebound in oil prices will
notably improve current account prospects for oil exporters and worsen those for oil importers.
...
4. Kuwait’s reported current account surplus increased in 2020 despite a massive worsening of the oil balance, because of a $10
billion upward jump in reported investment income.
_________________________________________________________________________________________________________
The Travel Shock 6
HUTCHINS CENTER ON FISCAL & MONETARY POLICY AT BROOKINGS3. Growth and tourism dependence
Finally, in this section we explore the extent to which the dependence of a country on tourism revenues
helps predict the size of the economic contraction caused by the COVID crisis. The measure of crisis
intensity we use is the difference between GDP growth in 2020, taken from the April 2021 World
Economic Outlook (IMF, 2021) and the pre-pandemic growth forecast for the same year, taken from the
January 2021 World Economic Outlook update (IMF, 2020a). Using the difference in performance
compared to forecasts is important in order to control for differences in trend growth across countries. We
rely on the World Economic Outlook given the global coverage of their forecasts, which is essential
considering that many of the most affected economies are very small and generally not covered by other
economic forecasts.
3.1 The tourism data
Our data on tourism dependence come from the World Travel and Tourism Council (WTTC), and are
disseminated by the World Bank. The main variables used in the analysis are the direct share of travel and
tourism in GDP (which is an estimate of the value added accounted for by the tourism sector) and the
total share (which also takes into account linkages between travel and tourism and other sectors). The
methodology used to construct these variables is explained in detail in WTTC/Oxford Economics (2020,
2021).
In summary, the direct share measure is estimated by first constructing expenditure measures
directed to sectors producing travel and tourism services (such as accommodation, transportation,
entertainment, and attractions), and subsequently using input-output matrices to subtract domestic
purchases and imported inputs by these sectors. The more comprehensive “total” measure also includes
travel and tourism investment spending, government “collective” spending also benefiting the tourism
industry, and domestic (non-imported) supply chain purchases of goods and services by the sectors
producing travel and tourism services. The construction of the data makes use, where possible, of the so-
called Tourism Satellite Accounts (TSA), which include macroeconomic aggregates describing size and the
direct economic contribution of tourism, detailed data on tourism consumption, and detailed production
accounts of the tourism industries (United Nations, 2008).
Panel A in Table 7 provides some summary statistics on the two tourism-related variables.5 The
median direct share of GDP is around 3.5 percent for both advanced and emerging and developing
economies, while the total share is notably higher, with a median around 9.5 percent of GDP. Among
advanced economies, 10 have a direct share of tourism in GDP exceeding 5 percent: Austria, Cyprus,
Greece, Iceland, Italy, Macao, Malta, New Zealand, Portugal, and Spain. For emerging and developing
economies, there are 42 with a share of tourism exceeding 5 percent, and 17 with a share exceeding 10
percent—all of the latter being economies listed in Table 1 as having a large international travel surplus.
How do the tourism-related variables considered in this section compare with net revenues from
international travel considered in the previous section? There are differences in coverage—the share of
tourism in GDP includes domestic tourism, while revenues from international travel include, for instance,
students traveling abroad to study. In practice, however, the correlation between the share of GDP
...
5. We exclude from the sample a few economies affected by economic stress and political strife, as discussed at the beginning of
the next sub-section.
_________________________________________________________________________________________________________
The Travel Shock 7
HUTCHINS CENTER ON FISCAL & MONETARY POLICY AT BROOKINGSaccounted for by tourism-related activities and the average surplus on the international travel balance is
very high (0.85).
3.2 Growth regressions
We now examine the extent to which the dependence of economies on tourism can help explain growth
performance during 2020. To control for underlying trends in growth and to focus squarely on the impact
of the COVID pandemic, we use as the dependent variable the “growth surprise” in 2020 relative to the
January 2020 growth forecast of the World Economic Outlook (which, given its timing, did not
incorporate any consequence of the COVID pandemic). We exclude from the sample as well as from
subsequent regressions a few countries affected by economic stress and political/geopolitical strife, where
growth performance can be very volatile and unpredictable. Those include Iran, Lebanon, Libya, Sudan,
Venezuela, and Yemen. In addition, we exclude Guyana, a massive outlier, where both the growth forecast
for 2020 (85 percent) and the growth outcome (43 percent) are related to the uncertain timing of new oil-
producing activity. Finally, we also exclude Macao from the regressions: given the extreme values of its
GDP decline relative to forecast (55 percent) and share of tourism in GDP (59 percent for the total share),
it would have a tangible impact on the regression results.
Summary statistics for the “growth surprise” are presented in Panel B of Table 7, for all countries
(including the split between advanced economies and emerging and developing economies), as well as
separating out countries where tourism accounts for a more sizable share of GDP.6 These statistics
highlight how severe and widespread the global downturn was, and especially so for countries more
dependent on tourism, with a median negative growth shock exceeding 11 percentage points of GDP, as
against 6 percentage points for the remaining economies (roughly matching the data for Greece vs.
Germany, for example). The first panel in Figure 4 shows a scatter plot of the 2020 growth surprise and
the total share of tourism in GDP. The correlation is -0.72. Excluding the three most extreme observations
(Macao SAR, Maldives, and Aruba, which are anyway excluded from most regressions below because they
lack observations for one or more of the explanatory variables) reduces the correlation to -0.6. After
excluding the 30 economies with a total share of tourism exceeding 20 percent the correlation (countries
with blue dots in Figure 4), the correlation is significantly reduced, to -0.26.
In addition to the dependence on travel and tourism, we use a number of other potential explanatory
variables. Two relate directly to the intensity of the pandemic: the number of recorded cases in 2020 (as a
share of total population) and the number of recorded deaths attributed to COVID-19 (also scaled by total
population size). A third variable, the stringency of lockdown measures, constructed at Oxford University
(Richie et al, 2020) relates instead to the government response to the pandemic.7 While stringency is
clearly correlated with the severity of the pandemic, the objective here is only to assess the extent to which
government restrictions correlate with a decline in economic activity for a given severity of the pandemic.
Among the other explanatory variables we consider are the level of development (which is also potentially
a proxy for quality of health care, and hence expected to be positively correlated with the growth shock),
population size, and variables related to the composition of output, such as the share of manufacturing
and agriculture in value added. We expect these last two variables to be positively correlated with the
growth shock in 2020, given the resilience of these sectors compared to the most affected services sector.
...
6. We use the IMF definition of advanced economies: a full set of countries is included in the Appendix.
7. The index is constructed from nine indicators including school closures, workplace closures, and travel bans.
_________________________________________________________________________________________________________
The Travel Shock 8
HUTCHINS CENTER ON FISCAL & MONETARY POLICY AT BROOKINGSThe first column of table 8 shows that by themselves, the measures of severity of the pandemic and
stringency explain a very small fraction of the cross-country variance in growth surprises, with only
stringency reaching statistical significance. However, as shown in column 2, adding the share of tourism
in GDP increases the explanatory power dramatically, with the variables now explaining about half of the
cross-country heterogeneity in growth performance. It is notable that once the share of tourism is
included, the severity of the pandemic, as measured by the number of reported COVID-related deaths,
becomes statistically significant. In column 3 we add GDP per capita and population in 2019 (both in log
form) to the set of explanatory variables: only the latter variable is borderline significant, suggesting that
countries with larger populations experienced less severe growth deviations. This finding could be related
to the increased stress put on small, more open economies by the closure of international borders and
reduced international trade.
Column 4 adds two additional variables related to the sectoral composition of economic activity: the
share of agriculture in total value added and the share of manufacturing in value added (both calculated
as averages over the period 2014-19). Both variables are positively associated with 2020 growth outcomes
relative to pre-crisis forecasts, providing further evidence on the importance of the sectoral composition
of output in explaining the cross-country impact of the COVID crisis.8 Once these additional output
composition variables are controlled for, we find some evidence that wealthier countries had more modest
declines in growth compared to forecasts. Finally, columns 5 and 6 provide results using the sample of
advanced economies and emerging and developing economies, respectively. The severity of the pandemic,
captured by the number of deaths scaled by population, is statistically significant and precisely estimated
for both country groups, while the stringency index is not significant for advanced economies after
controlling for COVID-related deaths, but strongly significant for emerging and developing economies.
Also, the advanced-economy regression shows a much stronger positive correlation between GDP per
capita and 2020 growth surprises—the variable helps explain growth deviations within advanced
economies (column 5) and between advanced economies and emerging and developing economies
(column 4), but not within emerging and developing economies (column 6).
The estimated coefficient on the tourism variable (0.19 to 0.28) implies that this variable is
economically very significant. For instance, going from the tourism share of Canada (which, at 6.5
percent, is around the 25th percentile) to the one of Mexico (which, at 16 percent, is around the 75th
percentile) increases the size of the negative growth shock by 1.8 to 2.7 percentage points. And increasing
the tourism share to the level of St. Kitts and Nevis (27 percent, around the 90th percentile) would imply
more than doubling that shock.
Table 9 looks at the robustness of results using different sub-samples as well as different measures of
the dependence on tourism. Column 1 replicates the baseline regression presented in Table 8; column 4,
using the direct share of tourism in GDP. The coefficients and fit of the regressions are virtually
unchanged—the only difference being the size of the tourism coefficient, which not surprisingly is much
higher (recall that the direct share of tourism is some 37 percent of the total share). Given the very small
size of many tourism-dependent economies, it is interesting to check whether the statistical and economic
significance of the tourism variable is driven primarily by small economies. Therefore the regressions in
...
8. The drop in the overall explanatory power of the regression is due to a sample composition effect—the sectoral composition of
output is not available for a few island economies that contribute to the fit of the overall regression. Using the same sample for
the regressions in columns (3) and (4) reduces the fit of the column (3) specification to 0.45, without altering the statistical and
economic significance of the coefficients.
_________________________________________________________________________________________________________
The Travel Shock 9
HUTCHINS CENTER ON FISCAL & MONETARY POLICY AT BROOKINGScolumn 2 and 3 split the sample according to the size of the economy in 2019, with column 2 including
countries with GDP in US dollars above $100 billion in 2019 (the lower limit roughly corresponding to the
size of Ecuador or the Slovak Republic) and column 3 including countries with GDP in 2019 below $100
billion (the largest of those being Kenya, Ethiopia, and the Dominican Republic). The results for the
tourism variable are robust—its coefficient is actually larger in absolute terms for the sample of larger
countries. The tourism variable remains highly significant also if we use GDP weights in a weighted least
squares regression.
Columns 4 and 5 provide instead a split of the sample on the basis of the extent of tourism-
dependence. In column 4, the sample includes all economies with a direct share of tourism above 5
percent of GDP (which, as mentioned earlier in this section, will include economies such as Italy and
Spain, for a total of 39 observations). The tourism variable is highly economically and statistically
significant. However, if the sample excludes all economies with a direct share of tourism above 5 percent
of GDP, the coefficient on tourism drops in magnitude and is no longer statistically significant (a finding
foreshadowed by the yellow dots in Figure 4). Therefore, the tourism variable helps explain differences in
growth performance between tourism-dependent economies and the rest, as well as within tourism-
dependent economies, but is not an important determinant of cross-country differences in performance
across economies with more modest dependence on tourism.
Column 5 and 6 add the pre-crisis dependence on passenger travel revenues as an explanatory
variable. This variable, which we would expect to be negatively correlated with the growth surprise, was
excluded from the baseline regression because it is not available for many large economies (such as China,
Germany, Hong Kong, the Netherlands, Spain, and the United Kingdom). The coefficient is indeed
negative in both regressions, and borderline significant in the sample of emerging and developing
economies. Finally, Column 7 shows that net international travel revenues also provide strong explanatory
power if the GDP share of tourism is excluded, but not surprisingly the latter variable—which also
includes purely domestic tourism-related activities—raises the fit of the regression.
Finally, in Table 10 we provide some suggestive evidence on the differential impact of the dependence
on domestic vs. international tourism for the crisis. We focus in particular on a sample of economies
highly dependent on tourism. In the table, we use as the threshold a direct share of tourism above 5
percent of GDP, but results are analogous if we use a slightly lower or higher threshold, or if we use a total
share of tourism above 14-15 percent of GDP or net international revenues from tourism above 4-5
percent of GDP. Column 1 replicates column 4 in Table 9, which shows the high statistical and economic
significance of the direct share of tourism in this sample. Column 2 shows that using net international
revenues instead of the tourism share gives similar results, but column 3 indicates that if both variables
are included in the regression they lose statistical significance because of their collinearity. However, the
total number of observations in these regressions (39) is well below the total number of tourism-
dependent economies in the sample according to our definition (50). The most binding constraint is the
availability of data on the stringency of lockdowns, which is missing for 8 tourism-dependent economies,
all of which have very high net international revenues from tourism.9 Since the stringency index is
...
9. These are Antigua and Barbuda, Grenada, Maldives, Montenegro, São Tomé and Príncipe, St. Kitts and Nevis, St. Lucia, and
St. Vincent and the Grenadines.
_________________________________________________________________________________________________________
The Travel Shock 10
HUTCHINS CENTER ON FISCAL & MONETARY POLICY AT BROOKINGSstatistically insignificant in regressions (1)-(3), we drop it from the regression specification in column 4.10
The results are striking: with 47 available observations, the fit of the regression rises substantially to 0.68,
and both tourism-related variables are highly significant. In particular, the negative coefficient on
international travel revenues suggests that, holding the share of tourism in GDP constant, those
economies more dependent on international tourism experienced a more severe shock. In terms of
magnitude, consider two economies with similar direct shares of tourism in GDP—Spain and the
Dominican Republic (around 5.3 percent), but different reliance on net international travel revenues (3.9
percent of GDP for Spain, 8 percent of GDP for the Dominican Republic). The regression coefficient on
the international travel balance (-0.2) suggests that the hit to GDP in the Dominican Republic was about
0.8 percentage points larger than for Spain.
In additional robustness tests, available from the author, we have included in the regression
additional variables such as trade openness and oil dependence (proxied by the oil balance during 2015-
19), but they are never significant. If the total share of tourism in GDP is separated into its direct and
indirect share, only the former is statistically significant, but there is very high collinearity between these
variables (their correlation is 0.93).
4. Concluding remarks
Government restrictions and behavioral changes caused by the COVID-19 pandemic have resulted in an
unprecedented “travel shock”—especially a collapse in international tourism. We have characterized some
stylized features of economies heavily reliant on tourism activities as a source of international revenues
and as a share of GDP—mostly but not exclusively very small middle- and high-income economies, and
generally large international debtors in relation to their GDP. In contrast, many fewer countries have
large net expenditures on international travel in relation to their GDP, making this shock very asymmetric
in terms of its impact on external accounts and economic activity. We have documented the impact of the
travel shock on external accounts and economic growth in 2020. We have shown how in tourism-
dependent economies net revenues from international travel have plummeted, leading to a worsening of
the current account balance. This worsening has been contained by import declines, as well as by reduced
income payments on external liabilities, most likely capturing lower returns on foreign-owned tourism
infrastructure. We have also shown how the international travel balance and the oil balance pre-COVID
explain a sizable fraction of the cross-country deviations of current account balances in 2020 from their
pre-COVID projections, with worse outcomes for countries dependent on tourism and oil exports.
On the economic activity front, we have shown how the deviation of 2020 growth from its pre-COVID
forecast is very strongly correlated with the share of tourism in GDP, and to a lesser extent with other
indicators of the supply composition of economic activity (the share of manufacturing and agriculture in
value added). Indicators of the intensity of the pandemic, such as recorded deaths scaled by population
and the stringency of lockdowns, also contribute to explaining growth shortfalls, but in general to a lesser
extent than the variables capturing the composition of economic activity. We also find some evidence that
countries with higher GDP per capita pre-COVID fared somewhat better, after controlling for the
variables mentioned above. The empirical results on the importance of the share of tourism in explaining
...
10. We limit this experiment to the sample of tourism-dependent economies, because for other economies (and for the whole
sample) the stringency index is statistically significant (see columns 1 and 5 in Table 9).
_________________________________________________________________________________________________________
The Travel Shock 11
HUTCHINS CENTER ON FISCAL & MONETARY POLICY AT BROOKINGSthe size of the 2020 output shock hold even if we restrict the sample to larger economies. The tourism
variable helps explain differences in growth between tourism-dependent and other economies, as well as
within tourism-dependent economies: however—not surprisingly— it is not a significant driver of cross-
country differences in growth performance across economies less dependent on tourism. Within tourism-
dependent economies, we have also provided some evidence that economies more dependent on
international tourism have suffered a more severe shock.
One set of variables missing from the analysis relate to the economic policy response, including the
extent of fiscal support. This is on the agenda for future research, with the caveat that these data are
generally available for only a subset of the countries used in this paper, and are missing in particular for
some smaller economies in which tourism plays a crucial role. Furthermore, the size of fiscal support is
going to be related to the intensity of the pandemic and the initial hit to economic activity more generally,
posing reverse-causality concerns.
Given data availability at the time of writing, the evidence we provided is limited to 2020. Data for the
first part of 2021 shows a further decline in international tourism, with forecasts suggesting a further
worsening in current account balances for tourism-dependent economies in 2021 (IMF, 2021b, Box 1).
The crisis poses particularly daunting challenges to smaller tourist destinations among emerging and
developing economies, given limited possibilities for diversification and in many cases high domestic and
external debt which limit the scope for a strong fiscal response. Helping many of these countries cope with
the challenges posed by the pandemic and restoring viable public and external finances will likely require
support from the international community.
_________________________________________________________________________________________________________
The Travel Shock 12
HUTCHINS CENTER ON FISCAL & MONETARY POLICY AT BROOKINGSAPPENDIX List of variables: Definitions and sources Current account balance; exports and imports of total services; exports and imports of travel services; exports and imports of transport services; exports and imports of goods; primary income balance; secondary income balance: source: IMF, Balance of Payments Statistics and national sources. Oil balance: source: IMF, World Economic Outlook database. International Investment Position: Source: Lane and Milesi-Ferretti, External Wealth of Nations database (see Lane and Milesi-Ferretti, 2018). Nominal GDP in US dollars, real GDP, GDP growth forecast 2020, current account forecast 2020. Source: IMF, World Economic Outlook database. Agriculture and manufacturing, share of total value added. Source: the World Bank, World Development Indicators. GDP per capita in current US dollars and population. Source: the World Bank, World Development Indicators. COVID cases and deaths (per thousand population). Source: Oxford University (Ritchie et al, 2020), and Center for Systems Science and Engineering at Johns Hopkins University (accessed through Our World in Data). Stringency Index. The index (see Ritchie et al, 2020) is calculated using nine measures of government restrictions: school closures; workplace closures; cancellation of public events; restrictions on public gatherings; closures of public transport; stay-at- home requirements; public information campaigns; restrictions on internal movements; and international travel controls. Source: Oxford Coronavirus Government Response Tracker (OxCGRT) project. GDP share of tourism (direct), GDP share of tourism (total). Source: World Travel and Tourism Council (data accessed via World Bank). List of countries Advanced economies: Andorra, Australia, Austria, Belgium, Canada, Cyprus, Czech Republic, Denmark, Estonia, Finland, France, Germany, Greece, Hong Kong SAR, Iceland, Ireland, Israel, Italy, Japan, South Korea, Latvia, Lithuania, Luxembourg, Macao, Malta, Netherlands, New Zealand, Norway, Portugal, Singapore, Slovak Republic, Slovenia, Spain, Sweden, Switzerland, Taiwan, United Kingdom, United States. Emerging and developing economies: Afghanistan, I.R. of; Albania; Algeria; Angola; Antigua and Barbuda; Argentina; Armenia; Aruba; Azerbaijan; Bahamas, Bahrain, Bangladesh; Barbados; Belarus; Belize; Benin; Bhutan; Bolivia; Bosnia and Herzegovina; Botswana; Brazil; Brunei Darussalam; Bulgaria; Burkina Faso; Burundi; Cambodia; Cameroon; Cape Verde; Central African Rep.; Chad; Chile; China; Colombia; Comoros; Congo, Dem. Rep. of; Congo, Republic of; Costa Rica; Croatia; Côte d'Ivoire; Djibouti; Dominica; Dominican Republic; Ecuador; Egypt; El Salvador; Equatorial Guinea; Eritrea; Ethiopia; Fiji; Gabon; Gambia; Georgia; Ghana; Grenada; Guatemala; Guinea; Guinea-Bissau; Guyana; Haiti; Honduras; Hungary; India; Indonesia; Iran, Islamic Republic of; Iraq; Jamaica; Jordan; Kazakhstan; Kenya; Kiribati; Kosovo; Kuwait; Kyrgyz Republic; Lao People's Dem.Rep; Lebanon; Lesotho; Liberia; Libya; Lithuania; Macedonia; Madagascar; Malawi; Malaysia; Maldives; Mali; Marshall Islands; Mauritania; Mauritius; Mexico; Micronesia; Moldova; Mongolia; Montenegro; Montserrat; Morocco; Mozambique; Myanmar; Namibia; Nauru; Nepal; Nicaragua; Niger; Nigeria; Oman; Pakistan; Palau; Panama; Papua New Guinea; Paraguay; Peru; _________________________________________________________________________________________________________ The Travel Shock 13 HUTCHINS CENTER ON FISCAL & MONETARY POLICY AT BROOKINGS
Philippines; Poland; Qatar; Romania; Russia; Rwanda; Samoa; Saudi Arabia; Senegal; Serbia; Seychelles; Sierra Leone; Solomon
Islands; Somalia; South Africa; South Sudan; Sri Lanka; St. Kitts and Nevis; St. Lucia; St. Vincent & Grenadines.; Suriname;
Swaziland; Syrian Arab Republic; São Tomé & Príncipe; Tajikistan; Tanzania; Thailand; Timor-Leste; Togo; Tonga; Trinidad and
Tobago; Tunisia; Turkey; Turkmenistan; Tuvalu; Uganda; Ukraine; United Arab Emirates; Uruguay; Uzbekistan; Vanuatu;
Venezuela, Rep. Bol.; Vietnam; West Bank and Gaza; Yemen; Republic of; Zambia; Zimbabwe.

_________________________________________________________________________________________________________

The Travel Shock                                                                                                               14
HUTCHINS CENTER ON FISCAL & MONETARY POLICY AT BROOKINGS
REFERENCES

Behsudi, Adam, 2020, “Wish You Were Here,” Finance and Development vol. 57 no. 4, December.

Blunk, Scott S, David E. Clark and James McGibany, 2006, “Evaluating the Long-run Impacts of the 9/11 Terrorist Attacks on US
    Domestic Airline Travel,” Applied Economics, Vol. 38, No. 4 (March 2006): 363-370.

Center for Systems Science and Engineering, COVID-19 Dashboard, Johns Hopkins University.

International Monetary Fund, 2013, Balance of Payments Manual, 6th edition.

International Monetary Fund, 2019, World Economic Outlook, October.

International Monetary Fund, 2020, World Economic Outlook Update, January.

International Monetary Fund, 2021a, World Economic Outlook, April.

International Monetary Fund, 2021b, External Sector Report, July.
Kuo, Hsiao-I., Chi-Chung Chen, Wei-Chun Tseng, Lan-Fen Ju, and Bing-Wen Huang. “Assessing Impacts of SARS and Avian Flu on
     International Tourism Demand to Asia.” Tourism Management 29, no. 5 (October 2008): 917–28.

Lane, Philip R. and Gian Maria Milesi-Ferretti, 2011, "The Cross-Country Incidence of the Global Crisis,” IMF Economic Review 59,
    April, 77-110.
Lane, Philip R. and Gian Maria Milesi-Ferretti, 2012, "External adjustment and the global crisis," Journal of International
    Economics vol. 88(2), 252-265.

Lane, Philip R. and Gian Maria Milesi-Ferretti, 2018, "The External Wealth of Nations Revisited: International Financial Integration
    in the Aftermath of the Global Financial Crisis," IMF Economic Review 66, 189-222.

MacDonald, Margaux, Roberto Piazza, and Galen Sher, 2020, “COVID-19 and the Travel and Hospitality Sectors,” International
    Monetary Fund, Special Series on COVID-19, September.
Muggenthaler, Philip, Joachim Schroth and Yiqiao Sun, 2021, “The heterogeneous economic impact of the pandemic across euro
   area countries,” ECB Economic Bulletin 5, August.

Ritchie, Hannah; Esteban Ortiz-Ospina, Diana Beltekian, Edouard Mathieu, Joe Hasell, Bobbie Macdonald, Charlie Giattino,
     Cameron Appel, Lucas Rodés-Guirao and Max Roser (2020), "Coronavirus Pandemic (COVID-19)". Published online at
     OurWorldInData.org.
Rosselló, Jaume, Susanne Becken, and Maria Santana-Gallego, 2020, “The Effects of Natural Disasters on International Tourism: A
    Global Analysis.” Tourism Management 79: 104080.

Škare, Marinko, Domingo Riberio Soriano, and Małgorzata Porada-Rochoń, 2021, "Impact of COVID-19 on the travel and tourism
     industry." Technological Forecasting and Social Change 163.
UNCTAD, 2021, “COVID-19 and Tourism: An Update.

UNWTO, 2021a, “2020: Worst Year In Tourism History With 1 Billion Fewer International Arrivals,” World Tourism Organization,
   January.

UNWTO, 2021b, “World Tourism Barometer”, volume 19 issues 1-4.

World Travel and Tourism Council, 2021, Travel and Tourism Economic Impact 2021.

WTTC/Oxford Economics, 2020, “Travel and Tourism Economic Impact Research Methodology,”, May.

WTTC/Oxford Economics, 2021, “Travel and Tourism Economic Impact Research Methodology,”, May.

_________________________________________________________________________________________________________

The Travel Shock                                                                                                                 15
HUTCHINS CENTER ON FISCAL & MONETARY POLICY AT BROOKINGS
FIGURES AND TABLES _________________________________________________________________________________________________________ The Travel Shock 16 HUTCHINS CENTER ON FISCAL & MONETARY POLICY AT BROOKINGS
_________________________________________________________________________________________________________

The Travel Shock                                                                                      17
HUTCHINS CENTER ON FISCAL & MONETARY POLICY AT BROOKINGS
_________________________________________________________________________________________________________

The Travel Shock                                                                                      18
HUTCHINS CENTER ON FISCAL & MONETARY POLICY AT BROOKINGS
_________________________________________________________________________________________________________

The Travel Shock                                                                                      19
HUTCHINS CENTER ON FISCAL & MONETARY POLICY AT BROOKINGS
_________________________________________________________________________________________________________

The Travel Shock                                                                                      20
HUTCHINS CENTER ON FISCAL & MONETARY POLICY AT BROOKINGS
_________________________________________________________________________________________________________

The Travel Shock                                                                                      21
HUTCHINS CENTER ON FISCAL & MONETARY POLICY AT BROOKINGS
_________________________________________________________________________________________________________

The Travel Shock                                                                                      22
HUTCHINS CENTER ON FISCAL & MONETARY POLICY AT BROOKINGS
_________________________________________________________________________________________________________

The Travel Shock                                                                                      23
HUTCHINS CENTER ON FISCAL & MONETARY POLICY AT BROOKINGS
_________________________________________________________________________________________________________

The Travel Shock                                                                                      24
HUTCHINS CENTER ON FISCAL & MONETARY POLICY AT BROOKINGS
_________________________________________________________________________________________________________

The Travel Shock                                                                                      25
HUTCHINS CENTER ON FISCAL & MONETARY POLICY AT BROOKINGS
_________________________________________________________________________________________________________

The Travel Shock                                                                                      26
HUTCHINS CENTER ON FISCAL & MONETARY POLICY AT BROOKINGS
_________________________________________________________________________________________________________

The Travel Shock                                                                                      27
HUTCHINS CENTER ON FISCAL & MONETARY POLICY AT BROOKINGS
_________________________________________________________________________________________________________

The Travel Shock                                                                                      28
HUTCHINS CENTER ON FISCAL & MONETARY POLICY AT BROOKINGS
The mission of the Hutchins Center on
                                                       Fiscal and Monetary Policy is to improve
                                                       the quality and efficacy of fiscal and
                                                       monetary policies and public
                                                       understanding of them.

 Questions about the research? Email communications@brookings.edu.
        Be sure to include the title of this paper in your inquiry.
© 2021 The Brookings Institution | 1775 Massachusetts Ave., NW, Washington, DC 20036 | 202.797.6000
You can also read