Assesment of 4D aortic strain from 3D time-resolved MRI in aortic aneurysms - Marina Xicoira Serra - e-Repositori UPF
←
→
Page content transcription
If your browser does not render page correctly, please read the page content below
BACHELOR´S THESIS / BIOMEDICAL ENGINEERING 2021

 Assesment of 4D aortic strain from 3D time-
 resolved MRI in aortic aneurysms

 Marina Xicoira Serra
Assesment of 4D aortic strain from 3D time-
 resolved MRI in aortic aneurysms

 Marina Xicoira Serra

 Bachelor’s thesis UPF 2020/2021

 Thesis supervisor(s):

 Dr. Andrea Guala, (Vall d’Hebron Institute of Research)

 UPF tutor:

 Pr. Oscar Camara,
(Department of Information and Communication Technologies Department (DTIC))
2
Acknowledgments

I would like to express my gratitute to my supervisor Andrea Guala for providing me with
help and feedback during the whole project, without his guidance and patience the present
work would have not been possible. I would also like to show my real appreciation to
Oscar Camara for his great advices and recommendations, and to my family and friends
for their support and patience during these four years. Thank you.

 3
4
Summary/Abstract

Aortic aneurysms are a class of frequent cardiovascular disease related to an increased
risk of life-threating complications, such as aortic dissection and rupture. These acute
events are characterized by a very bad prognosis, with mortality comprised between 60
to 70%. Maximum aortic diameter is the sole established parameter for risk assessment
but many acute events happen at a diameter lower than that suggested for preventive
substitution of the diseased region. Aortic deformation may be used for better risk
stratification. Three-dimensional (3D) time-resolved cine cardiac magnetic resonance
images (CMR) allows for the quantification of strain over the totality of the aorta,
overcoming many limitations of 2D imaging, such as the predefined location of analysis
and through plane deformation. The aim of the present study was to assess 4D strain of
the whole thoraco-abdominal aorta during one cardiac cycle. The dataset was provided
by Hospital Universitari Vall d’Hebron and consisted on 3D cine CMR and contrast-
enhanced 3D angiography (MRA). 3D volume of the whole thoraco-abdominal aorta was
obtained from contrast-enhanced 3D angiography and allows to identify the aortic wall
and extract deformation values at those points. Volumetric images of the aorta from 3D
cine CMR at different cardiac phases were registered and the deformation field at the
aortic wall was extracted and analysed. Local strain of the wall was extracted in
anatomically-identified regions and was divided into circumferential and radial
components. The evaluation of aortic strain may help to monitor and evaluate risk in
patients with aortic aneurysms.

Keywords

Aortic strain, aneurysm, magnetic resonance imaging, aortic dilation.

 5
6
Preface

The thesis was developed in collaboration with the research group of cardiovascular
imaging of the Vall d'Hebron Research Institute (VHIR). The group is carrying out a
project focused on the analysis of atherosclerotic aneurysm of descending thoracic and
abdominal aorta, whose main objective is to establish whether biomarkers of
inflammation, plaque composition, hemodynamics or biomechanics are predictors of
regional aortic dilatation and occurrence of aortic events (aortic repair, dissection, rupture
or death) beyond the maximum diameter. Descending thoracic and abdominal aneurysms
progression and risk of dissection are influenced by local characteristics, such as aortic
wall stiffness, flow-induced stress factors (as wall shear stress) as well as presence,
composition and metabolic activity of atherosclerotic plaques. Consequently, specific
knowledge about which are the main factors associated with local aortic dilation could
allow more personalized monitoring of patients with aortic aneurysm, possibly providing
an improved risk stratification and a more efficient patients' management. A part of that
project, focusing on the quantification of 4D radial and circumferential strain from 3D
cine CMR, was partially developed in this Thesis. The image analysis workflow to
measure aortic strain was developed. Its application to the whole cohort and the recording
of patients’ evolution over the follow up could provide evidence of its usefulness in
clinical practice for the assessment and monitoring of pathological aortas.

 7
8
Index

1. Introduction ................................................................................................................ 1
1.1. Descending aorta dilation .......................................................................................... 1
1.2. Previous image analysis tools to assess aortic strain ................................................. 4
1.3. 2D vs 3D imaging techniques .................................................................................... 4
1.4. Objectives of the project ............................................................................................ 5

2. Methods ....................................................................................................................... 6
2.1. Dataset ....................................................................................................................... 7
2.2. Data preprocessing .................................................................................................... 7
2.3. Registration strategy .................................................................................................. 8
 a) Objectives of the registration.................................................................................... 8
 b) Thirion’s Demons algorithm .................................................................................. 10
2.4. 3D volume of the whole-thoraco abdominal aorta .................................................. 11
2.5. Centerline extraction................................................................................................ 12
2.6. Division of aortic surface for localized referencing ................................................ 13
2.7. Radial, longitudinal and circumferential strain ....................................................... 15
2.8. Validation ................................................................................................................ 18

3. Results ........................................................................................................................ 19
3.1. Radial and circumferential strain analysis ............................................................... 19
3.2. Clinical data and mean strain analysis ..................................................................... 23

4. Discussion .................................................................................................................. 26
4.1. Limitations and future work ................................................................................... 28

5. Conclusion ................................................................................................................. 29

 9
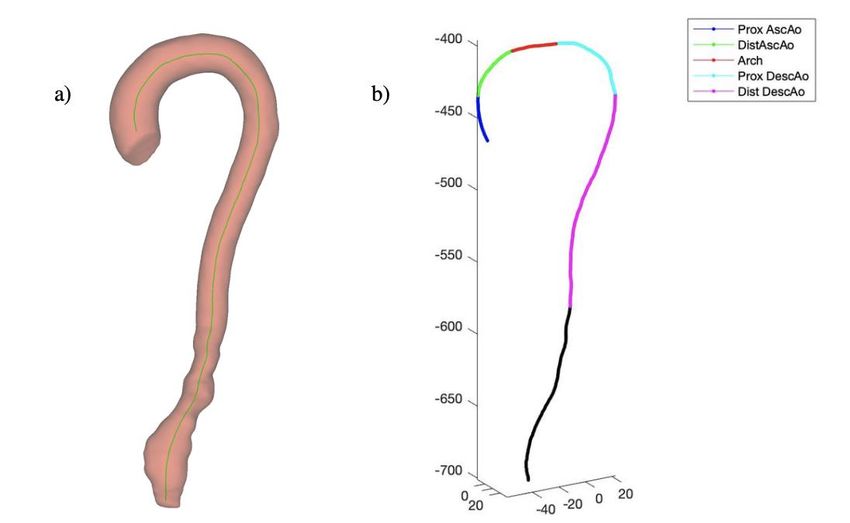
List of figures
 Page

Figure 1: Comparison between a normal aorta and an abdominal aortic aneurysm.
Retrieved from https://cirugiacardiovascular.com.mx/.....................................................2

Figure 2: Endovascular treatment with stent graft. Retrieved from
http://www.vascularinfo.co.uk/.........................................................................................3

Figure 3: Pipeline of the methodology. 3D cine CMR = Three-dimensional Cardiac
Magnetic Resonance; Contrast-enhanced 3D MRA = Contrast-enhanced three-
dimensional magnetic resonance angiography..................................................................6

Figure 4: Sagital plane of 3D time-resolved CMR before (a) and after filtering (b).........8

Figure 5: Multiresolution registration strategy..................................................................9

Figure 6: A moving image is diffused through the contours of the objects in the fixed
image by the action of effectors, called demons, situated in these interface...................10

Figure 7: Segmentation of the aorta from contrast-enhanced 3D MRA images in 3D
slicer.................................................................................................................................11

Figure 8: Aorta segmentation with corresponding centerline (a) and the centerline
division on anatomical subregions (b). Prox AscAo = Proximal Ascending Aorta; Dist
AscAo = Distal Ascending Aorta; Arch = Aortic arch; Prox DescAo = Proximal
Descending Aorta; Dist DescAo = Distal Descending Aorta.........................................12

Figure 9: Surface points of the STL segmentation (a), anatomical reference planes
representation (b) and the division of the aortic surface into patches (c)........................13

Figure 10: Aorta division on patches. There are 8 circumferential regions for each
longitudinal region...........................................................................................................14

Figure 11: Graphical representation of radial, circumferential and longitudinal strain..15

Figure 12: Radial, longitudinal and circumferential directions.....................................17

Figure 13: Radial and circumferential strain results in function of % of the cardiac cycle
in patient 2.......................................................................................................................20

Figure 14: Radial and circumferential strain results in function of % of the cardiac cycle
in patient 8.......................................................................................................................21

 10
Figure 15: Radial and circumferential strain results in function of % of cardiac cycle in
patient 10.........................................................................................................................22

Figure 16: Segmentations of patient 2 (a), patient 8 (b) and patient 10 (c).....................23

Figure 17: Cine CMR of patient 8 (a) and cine CMR of patient 7 (b)............................24

Figure 18: Radial and circumferential strain (%) in each of the regions in function of the
age....................................................................................................................................25

 11
List of tables
 Page

Table 1: Mean ± standard deviation of the clinical features and the radial and
circumferential of all patients..........................................................................................23

Table 2: Radial and circumferential strain of each of the patients in function of the sex
(Female or Male) and age................................................................................................24

 12
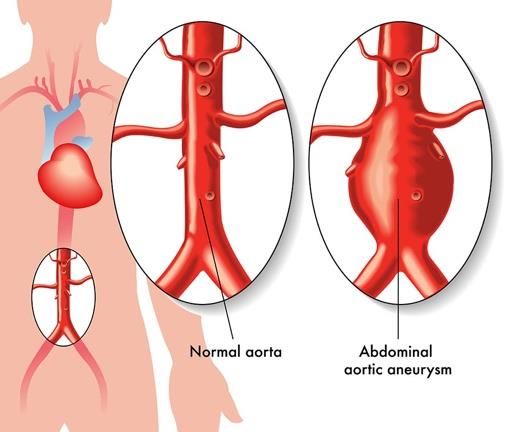
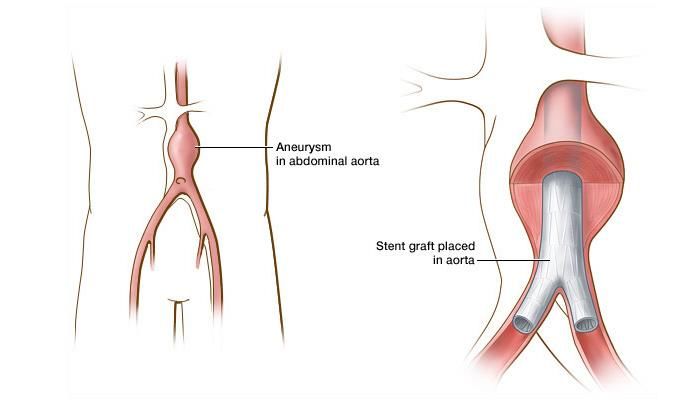
1. Introduction

 1.1. Descending aorta dilation

An aortic aneurysm is a pathologic dilation of an aortic segment that has the tendency to
expand and rupture [1]. The walls of the aorta can swell or bulge out like a small balloon
due to the intrinsic weakness of the aortic wall [2], see Figure 1. It is important to follow-
up diseases involving aortic aneurysm due to the increment of risk of developing an aortic
dissection or aortic rupture as well as for preventive substitution of the diseased region in
case of severe dilation.

Descending aorta and abdominal aorta aneurysms are frequent cardiovascular diseases
consisting in the dilation of the aorta. These conditions are related to an increased risk of
life-threating complications, such as aortic dissection and rupture [3]. This condition is
growing in prevalence in the elderly population, with approximately 150,000 new cases
being diagnosed every year [40]. Generally, they are characterized by a very bad
prognosis, with mortality comprised between 60 to 70% [3]. Despite the great efforts
made over the last 20 years to understand aortic aneurysm aetiology and to improve
treatments, the mortality rate has not been reduced considerably [4].

The dominant aetiology for descending aorta dilation is a progressive degeneration
process, called arteriosclerosis, consisting in thickening and loss of elasticity of the
arterial wall, often associated with the presence of atherosclerotic plaques [1]. Other
causes for dilation include rare genetic conditions affecting the connective tissues and
congenital malformations such as aortic coarctation and bicuspid aortic valve. Despite
data about the prevalence of descending aorta aneurysms vary greatly depending on the
studied cohort, most of studies reported a prevalence of around 5% in the general
population [1].

The aorta is an elastic vessel composed of three main layers: tunica intima, tunica media,
and tunica adventitia. The internal elastic lamina separates the intima from the media.
During the ejection phase of left-ventricular (LV) contraction, the aorta is distended by
blood, and kinetic energy from the LV is transformed into potential energy stored in the
aortic wall. During aortic wall recoil, this potential energy is converted to kinetic energy,
which favors diastolic flow in the peripheral vessel (Windkessel effect). According to
Laplace’s law, aortic dilation increases wall tension, triggering vascular wall remodelling
aortic dilation. These physiopathological mechanisms show that measurement of elastic
properties of the aortic aneurysm and aortic dimension are directly correlated with
aneurysm size [35].

 1
Figure 1: Comparison between a normal aorta and an abdominal aortic aneurysm.
Retrieved from https://cirugiacardiovascular.com.mx/.

Then, large and potentially fatal aneurysms are preceded by a long period of silent
aneurysm diameter growth (progressive dilation), which is much faster and variable in
the more distal regions of the aorta compared to the more proximal [1]. Thus, the
suggested monitoring and treatment recommendations for aortic aneurysms are based on
the evaluation of the maximum aortic diameter over time, since the risk of rupture
increases with the diameter [5].

As long as the diameter is lower than 50-55 mm (mild-to-moderate dilation), the
European clinical guidelines [1] suggest a follow-up of the diameter progression, a
reduction of modifiable risk factors and the eventual administration of antihypertensive
drugs. When the diameter exceeds this threshold (severe dilation), surgical (open) or
endovascular treatment is recommended, see Figure 2. Open surgery is considered the
surgical intervention by default but carries a significant risk of mortality and morbidity
[6]. Although endovascular treatment is less invasive, it is associated with lower mortality
and morbidity and reduces post-operative convalescence time [6], data about its long-
term efficacy are scarce and patients require an imaging follow-up throughout life [6].

However, there is evidence that aneurysms smaller than this threshold rupture [39].
Conversely, some larger aneurysms do not rupture during the lifespan of the patient. An
aneurysm ruptures because the local strength of the wall is insufficient to sustain the
instantaneous load due to blood pressure [39]. Then, aortic stiffness is associated with the
rate of aortic disease progression, with higher stiffness resulting in higher frequency of
intervention [7]. Treatment usually includes medications to limit blood pressure but no
drug has proven effective in reducing aneurysm growth [8].

 2
Figure 2: Endovascular treatment with stent graft. Retrieved from
http://www.vascularinfo.co.uk/.

The decrease in arterial elasticity is one of the earliest detectable manifestations of
adverse structural and functional changes of the aortic wall [9]. The current knowledge
explains this loss of elasticity as the result of the accumulation of successive damage
(fatigue) in the elastic fibers present in the arterial wall, the consequent increase in
collagen content in relation to elastin and the accumulation of oxidative stress [10]. The
loss of arterial elasticity has a high independent prognostic value of cardiovascular events
[11] and it is demonstrated that the increase of aortic stiffness in large arteries is
associated with the presence of atherosclerosis in different segments of the arterial tree
[12].

Aortic stiffness can be estimated by applying feature-tracking techniques to
cardiovascular images or by quantifying the propagation velocity of pressure,
deformation or flow waves into an arterial segment. The first technique is mainly used on
cine cardiac magnetic resonance (CMR) imaging and allows to determine the local
deformation of the aorta [13, 14], whose reduction is associated with greater stiffness [13]
and is an indepent predictor of future cardiovascular disease [10, 41].

On the other hand, there are other parameters used for assesment of abdominal aortic
aneurysm elasticity. The quantification of the pulse wave velocity (PWV) is a more direct
measurement but its regional assessment requires more advanced images (as 4D flow
CMR [42]) while its global assessment over the central arteries may lack the capacity to
describe local abnormalities in aortic stiffness, which may mark an increased risk of
rupture. Aortic distensibility has also been used to evaluate elastic property of the aorta
but is directly associated with confounding factors, including blood pressure, body
conformation parameters, and aortic dimensions [35].

 3
1.2. Previous image analysis tools to assess aortic strain

Algorithms to measure local strain of the aorta have been previously proposed. Recent
studies showed that ascending aorta longitudinal strain can predict aortic root dilation and
the need for surgical aortic root placement in Marfan syndrome (an inherited disorder that
affects connective tissue and is associated with the presence of aortic root aneurysm [15])
[14] and in bicuspide aortic valve (a common congenital cardiac abnormality also
associated with an increased risk of dissection and rupture [16]) disease [17], where aortic
stiffness results in a reduction of 2D strain of the ascending aorta (AAo).

Guala et al. [14] showed that proximal aorta longitudinal strain predicts aortic dilation
rate in Marfan syndrome, whereas Longobardo et al. [17] demonstrated that 2D aortic
longitudinal strain is also an effective predictor of aortic complications in bicuspid aortic
valve patients. The first study computed proximal aorta longitudinal strain by tracking
the aortic valve throughout the cardiac cycle. Computational methods to obtain aortic root
cyclic deformation from 2D cardiac magnetic resonance include a registration between
consecutive time-frames of the 2D video to estimate 2D aortic displacement. Each
registration provides a time-resolved 2D description that was averaged in each of the
patients’ directions and projected in the direction of the aortic centreline at the aortic valve
to obtain a 3D description.

On the other hand, Longobardo et al. [17] applied registration software to 2D
transthoracic echocardiography for the evaluation of longitudinal strain of AAo. Anterior
and posterior wall strains of the AAo were measured off-line using a speckle-tracking
software (EchoPAC, GE VingMed Ultrasound AS). The acquisition of cine loops of three
cardiac cycles and posterior selection of the one with best aortic wall definition was
carried out to later trace manually the aortic borders and finally obtain longitudinal strain.

 1.3. 2D vs 3D imaging techniques

2D echocardiography and 2D cine CMR are the most used images to visualize the aorta
and to assess its deformation but fail to visualize through plane deformation and thus
implies an arbitrary bias toward in plane movement. 3D cine CMR and 3D
echocardiography are newer imaging modalities that and can overcome this limitation.
Cine CMR was chosen for this study because it allows the quantification of strain over
the totality of the aorta, whereas echocardiographic images are limited to a very small
acquired volume.

CMR imaging is a non-invasive imaging technique that exploits tissue-specific response
to a magnetic field to provide detailed information of cardiovascular structures without
radiation [18]. Indeed, CMR is widely used for diagnosis, evaluation and clinical follow-
up of aortic diseases.

 4
Cine CMR is a type of imaging that consists in the acquisition of the same slice position
at different phases of the cardiac cycle [24], it uses the same principles of image
acquisition and reconstruction as other MRI techniques. Cine sequences of the heart are
acquired using balanced steady state free precession (bSSFP), which has good temporal
resolution and intrinsic image contrast. Images are typically planned sequentially to
achieve the standard cardiac planes used for assessment [25].

 1.4. Objectives of the project

The main aim of this project was to quantify 4D strain from 3D cine CMR of the whole
thoraco-abdominal aorta, a possible predictor of progressive dilation and aortic
complications. Local strain of the aortic wall was extracted and analysed in anatomically-
identified regions and divided into circumferential and radial strain components. The
evaluation of aortic strain may help to monitor and evaluate risk in patients with aortic
aneurysms.

 5
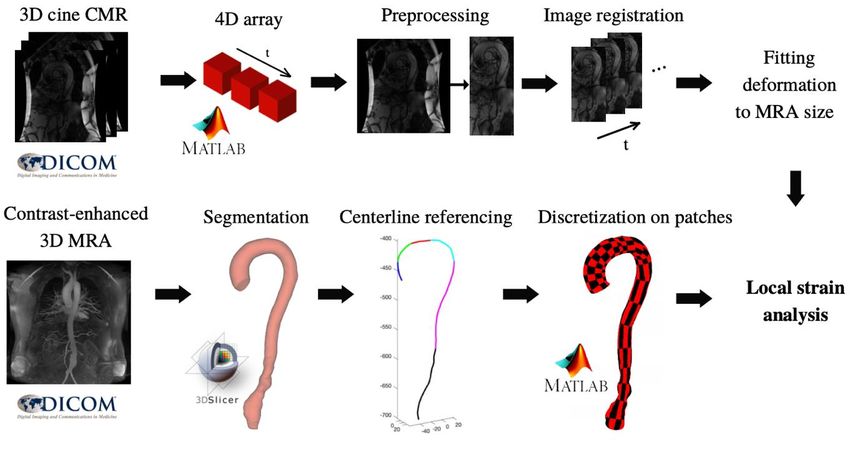
2. Methods

The pipeline that was followed in the methodology is shown in Figure 3. Firstly, a
registration method calculated the deformation from 3D time-resolved CMR for each of
the slices at all timeframes. As we are only interested in the deformation at aortic walls,
the 3D volume of the whole thoraco-abdominal aorta was obtained from contrast-
enhanced 3D angiography. Segmentation served to identify where is situated the aortic
wall and extract deformation values at those points.

The centerline of the aorta was calculated and allowed to discretize the 3D volume of the
aortic wall in regions. The local strain of the wall was extracted for each region from the
deformation obtained from the 3D cine CMR, and then was projected in the longitudinal,
circumferential and radial directions. This process was repeated in a cohort of patients
and evaluated in function of their characteristics.

Figure 3: Pipeline of the methodology. 3D cine CMR = Three-dimensional Cardiac
Magnetic Resonance; Contrast-enhanced 3D MRA = Contrast-enhanced three-dimensional
magnetic resonance angiography.

 6
2.1. Dataset

The dataset was provided by the Hospital Universitari Vall d’Hebron and consisted on
3D time-resolved magnetic resonance images (CMR) and contrast-enhanced 3D
angiography (MRA) from ten patients covering thoracic and abdominal of the aortic arch
of patients with descending aorta aneurysm of degenerative origin. Image acquisition was
performed at 3T with Discovery MR750w (GEM, GE, WI).

The 3D time-resolved CMR was acquired in 12 sagittal slices with time resolution set to
25 ms, pixel size of 0.74 x 0.74 mm, slice thickness of 8 mm, and no spacing between
slices. In contrast-enhanced 3D angiography images, the aorta was acquired after
administration of gadolinium chelated contrast with an isotropic resolution of 1.5 mm.

 2.2. Data preprocessing

3D time-resolved CMR were DICOM (Digital Imaging and Communications in Medicine
standard) images imported into MATLAB1 . CMR image preprocessing is a fundamental
step to assure the success of any quantitative analysis pipeline. Such preprocessing is
aimed either to improve image quality or to standardize its geometric and intensity
patterns. Due to the low dynamic ranges with mainly black regions, a low-contrast image
enhancement based on haze removal techniques is applied to improve the visibility of
whole aorta. The histogram of pixel-wise inversion of low-light images or HDR images
is very similar to the histogram of hazy images. Thus, it can be used haze removal
techniques to enhance low-light images [26]. Using haze removal techniques to enhance
low-light images comprises three steps:

Step 1: Invert the low-light image.
Step 2: Apply the haze removal algorithm to the inverted low-light image.
Step 3: Invert the enhanced image.

A representative result is shown in Figure 4. Then, cropping of CMR volume to
meaningful region is performed in order to allow for faster tracking of deformation field
during the registration algorithm.

1
 MathWorks, Inc., Natick, MA, USA
 7
Figure 4: Sagital plane of 3D time-resolved CMR before (a) and after filtering (b).

 2.3. Registration strategy

 a) Objectives of the registration

The registration technique was based on a traditional image deformation analysis
performed with MATLAB software in order to calculate aorta displacement during one
cardiac cycle. Image registration is an optimization process aiming at finding the
geometric transform that will allow to align the moving image (M) to the fixed image
(F). The registration was focused on obtaining the deformation needed to align the
volumetric images at all timeframes with the frame that represented the aorta on diastole.
Then, M is the 3D time-resolved CMR at time t and F is the stack of the 3D time-resolved
CMR at the last frame.

The registration technique used in the project solves a non-rigid registration problem and
is based on ‘imregdemons’ command in MATLAB. This algorithm estimates the
displacement field that aligns the moving image with the fixed image. For a 3D
registration with a fixed image size of MxNxP, where P is the number of slices
corresponding to the 3D time-resolved CMR, an output displacement field T was
obtained. T consisted in a double matrix of size MxNxPx3, where T(:,:,:,1) contained X
displacements, T(:,:,:,2) contained Y displacements, and T(:,:,:,3) contained Z
displacements in units of pixels. The displacement vectors at each pixel location map
locations from the fixed image grid to a corresponding location in the moving image. The
moving image is warped by T and then resampled using linear interpolation.

This type of registration is based on multiresolution registration, see Figure 5. Pyramid
levels are created and the multiresolution process starts by registering Level 0 and
applying the output parameter map to the input images of the Level 1. Then, this level is
registered again and the output transformation is applied to the input images of the next
level. The last output transformation is the final result [19].

 8
Figure 5: Multiresolution registration strategy.

The number of pyramid levels were determined by another input argument that controls
the number of iterations that were computed. It was a vector [N1,N2,N3], whose length
determined the number of pyramid levels in the algorithm and specified the number of
iterations to perform at each of these resolution levels. N1 represented the number of
iterations at the lowest resolution level, N2 was the number of iterations at the next level
of resolution and N3 represented the number of iterations at the full resolution of moving
and fixed images. Furthermore, standard deviation of the Gaussian smoothing was
applied to regularize the accumulated field at each iteration.

The registration strategy was applied to 3D time-resolved CMR images. One problem of
these type of images is that spatial resolution is not homogenous, being much lower in
the Z direction to limit scanning time. Therefore, contrast-enhanced 3D MRA images
were used for the analysis and extraction of deformation values since they have
homogenous spatial resolution in the three directions. All the cine CMR used in the
project comprised a maximum of 12 slices, whereas contrast-enhanced 3D MRA included
about 81 slices.

Some common linear interpolators are nearest neighbour, linear interpolation, quadratic,
cubic or Gaussian interpolation. The interpolator used to resample the size of the
deformation matrix to the size of contrast-enhanced 3D MRA was the linear interpolator
[20], which is the default option for ‘interpn’ command.

 9
b) Thirion’s Demons algorithm

‘Imregdemons’ uses Thirion’s Demons algorithm [21], which performs image registration
via an iterative optimization procedure inspired by optical flow equations. Optical flow
can be used to find small deformations in temporal sequences of images. At a given point
P, let s be the intensity function in F and m the intensity in M.

The basic hypothesis of optical flow is to consider that the intensity of a moving object is
constant with time, which gives, for small displacements, Equation (1):

 ⃗ ∗ ⃗
 ⃗⃗ = − (1)

In optical flow, v is considered to be a velocity because the images are two successive
time frames: v is the displacement during the time interval between the two image frames.

To match a moving image M with a fixed image F, M must be deformed to resemble F as
much as possible. It is assumed that the contour of an object O in F is a membrane, and
the demons are scattered along this contour. It is also assumed that M is a deformable
grid, whose vertices are particles which can be classified as ‘inside’ or ‘outside’ particles.
This process is shown in Figure 6.

Figure 6: A moving image is diffused through the contours of the objects in the fixed
image by the action of effectors, called demons, situated in these interface.

Therefore, a demon can be viewed as an effector situated in a point P of the boundary of
an object O. This method is iterative: at each iteration, the motion created by all the
elementary forces is applied to the model.

Thirion’s Demons algorithm is typically regularized via a diffusion process over the
(iteratively updated) displacement field and/or by imposing other constraints, such as
requiring that the computed displacement field describes a diffeomorphic transformation.
In this way, ‘imregdemons’ proposes a non-parametric diffeomorphic image registration
algorithm based on the demons algorithm [22].

 10
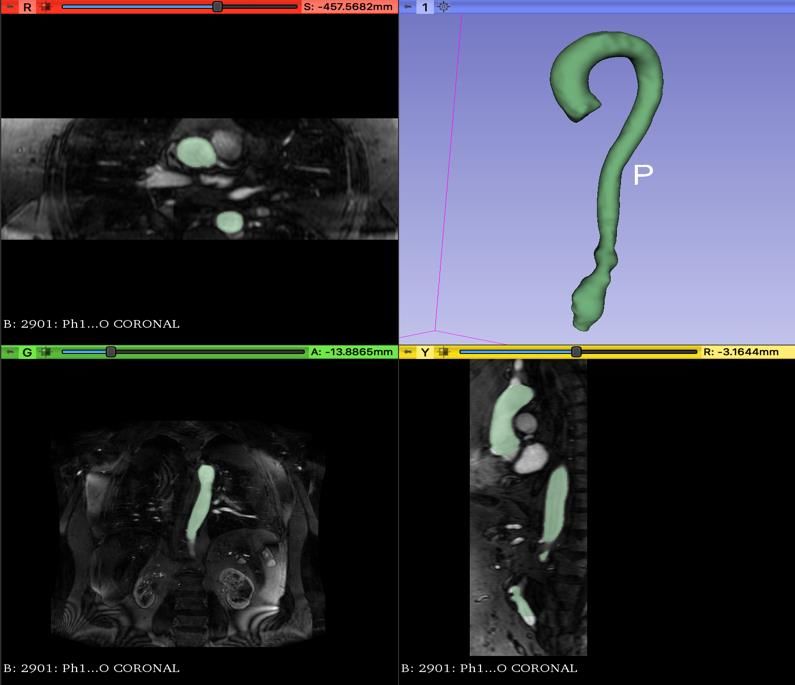
2.4. 3D volume of the whole-thoraco abdominal aorta

From contrast-enhanced 3D MRI angiograms, the 3D volume of the whole-toraco
abdominal aorta was semi-automatic segmentated using 3D slicer2 software, see Figure
7. Semi-automatic segmentation was performed using the “grow frome seeds module”,
where the user first identifies some points included in the desired aortic segment, also
called ‘seeds’. The algorithm starts growing the seeds in the three directions to achieve a
complete segmentation that then has to be corrected and smoothed manually.

The final segmentation was stored as a stereolithography (STL) file. The mesh was
imported into MATLAB and its vertices were used as surface points of the aorta.

Figure 7: Segmentation of the aorta from contrast-enhanced 3D MRA images in 3D slicer.

2 http://www.slicer.org
 11
2.5. Centerline extraction

The next step was to calculate the centreline of the aorta from the segmentation with the
3D slicer software. The SlicerVMTK extension was needed to accomplish centerline
extraction. This module requires a surface mesh as an input, which corresponds to the
segmentation result.

The mesh contains a very high number of points; using all the points in the centerline
extraction would make the computation very time-consuming, so preprocessing was
enabled by default, aiming at reducing the number of mesh points to 5000. Simplification
is not performed in high-curvature areas, as it could remove significant features from the
mesh or may introduce mesh errors, such as non-manifold edges. The centerline tree
extraction was based on Voronoi model, requiring a surface input, a starting point and an
end point at the top of the branches. Voronoi diagram is a surface similar to medial
surface, which is used for searching path between branch endpoints [23].

After centerline extraction (Figure 8 (a)), tangent vectors directions of each of the points
of the resulting centerline were obtained. They are not provided by SlicerVMTK but are
needed to compute the identification of anatomical landmarks and consequent division of
aortic surface in a number of patches for localized refering. Then, the coordinates of the
directions of the tangent vectors for each of the centerline points were obtained manually
from the premise that the slope of a tangent line at a point is the derivative of the function
at that point.

Figure 8: Aorta segmentation with corresponding centerline (a) and the centerline
division on anatomical subregions (b). Prox AscAo = Proximal Ascending Aorta; Dist
AscAo = Distal Ascending Aorta; Arch = Aortic arch; Prox DescAo = Proximal
Descending Aorta; Dist DescAo = Distal Descending Aorta.

 12
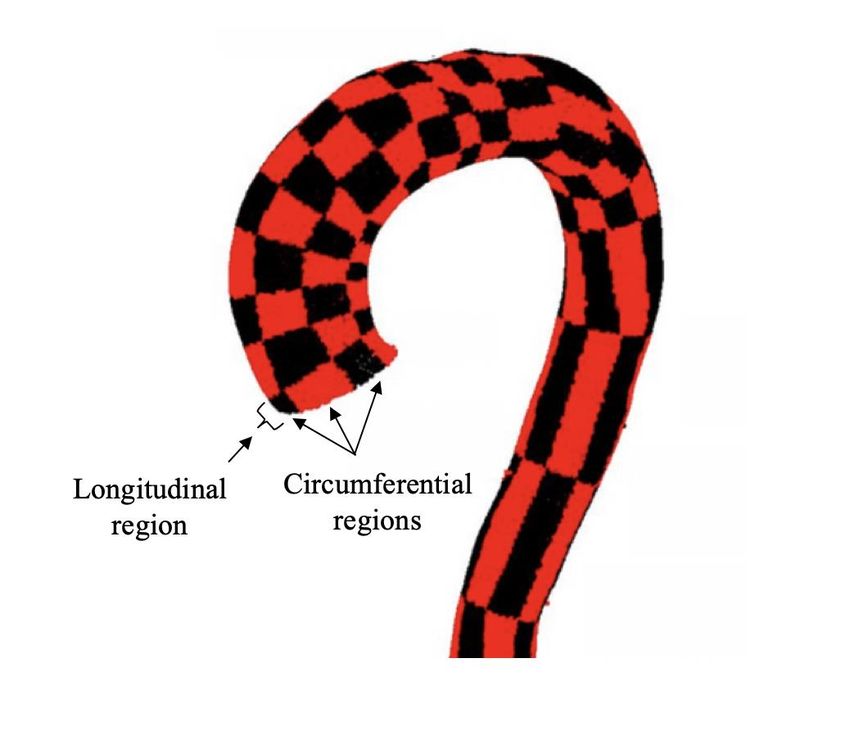
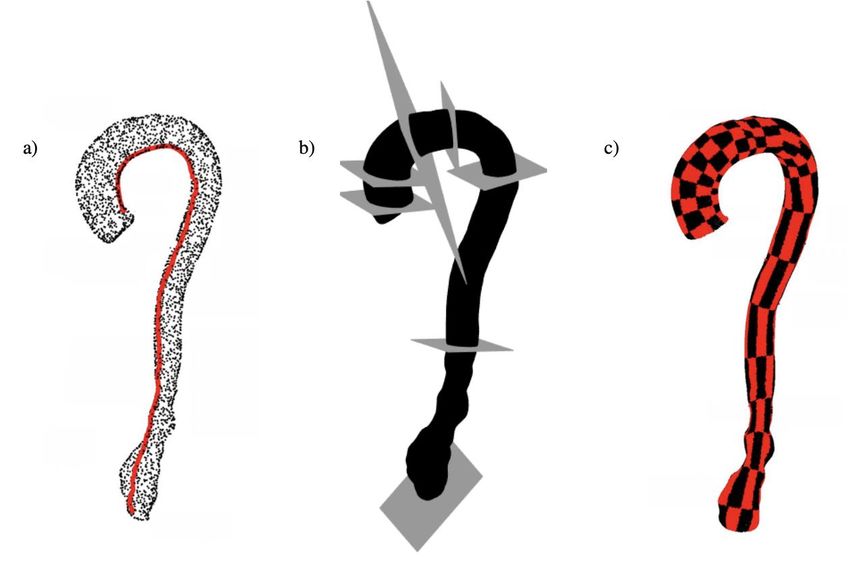
2.6. Division of aortic surface for localized referencing

Anatomical landmarks were provided by Hospital Universitari Vall d’Hebron and were
recognised on the centerline coordinates to allow the identification of anatomical regions.
Each of the landmarks corresponded to a different anatomical region of the aorta:
Proximal Ascending Aorta, Distal Ascending Aorta, Aortic Arch, Proximal Descending
Aorta, Distal Descending Aorta and Abdominal Aorta. In this way, centerline is divided
in subregions whose lengths are calculated in order to compute the distance between each
region, see Figure 8 (b).

Surface points of the segmentation are represented in Figure 9 (a), the points that
corresponded to the aortic root and the distal descending aorta below the diaphragma were
eliminated. Anatomical reference planes were obtained finding the nearest surface point
to the centerline for each of the landmarks defined before, see Figure 9 (b).

Additional longitudinal planes between anatomical reference planes were created
automatically and the inner point was defined as the closest point of the circumference to
the pulmonary artery bifurcation. For each of the longitudinal regions, angular
discretization of the aortic surface into patches is calculated (Figure 9 (c) and Figure 10).
These patches will allow the localized referencing of strain results in different patients.
As there are six anatomical regions and four longitudinal regions between each of them,
the result is 24 longitudinal regions that each of them contains 8 circumferential regions.

Figure 9: Surface points of the STL segmentation (a), anatomical reference planes
representation (b) and the division of the aortic surface into patches (c).

 13
The aortic patch division contained the indices of the surface points that belonged to each
aorta region. These surface points corresponded to the vertices of the STL segmentation.
As the coordinates of the vertices of the STL had a different range in comparison with the
resulting matrix obtained from the Thirion’s Demons algorithm, the coordinates of the
surface points were adapted and related to the coordinates of the deformation matrix in
order to allow the correct identification of the indices in the deformation matrix.

After adapting the coordinates of the vertices of the STL to the range of deformation
values, the indices of the patches were used to extract the deformation values at each
patch. As the deformation values were in voxels and the coordinates of the surface points
were double numbers, the surface points were rounded to integer values and repeated
coordinates were eliminated in order to simplify the algorithm and avoid imprecisions.

In this way, for each of the different patches there were indices indicating the position of
the deformation values of interest for that patch. For each of these indices, it is extracted
the deformation value in X, Y and Z from the deformation matrix resulting of the
registration algorithm. From these deformation values, the radial, longitudinal and
circumferential strain was calculated for all the points in a patch.

 Figure 10: Aorta division on patches. There are 8 circumferential regions for each
 longitudinal region.

 14
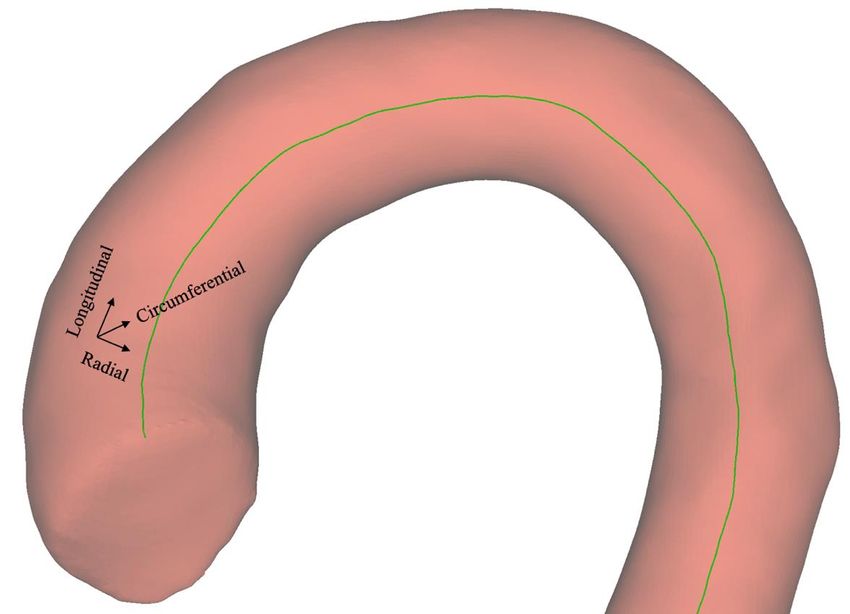
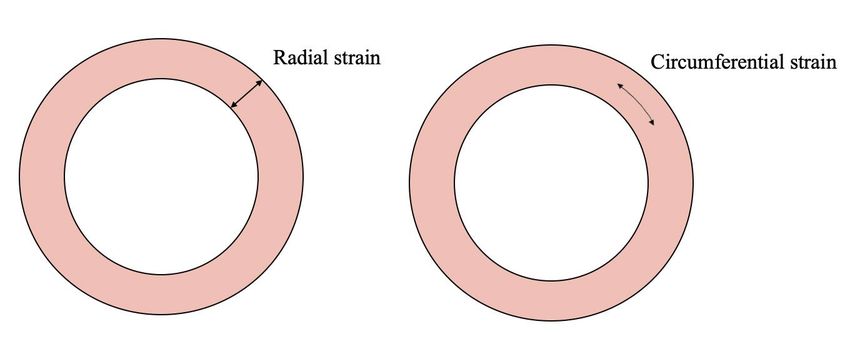
2.7. Radial, longitudinal and circumferential strain
The strain expresses the local deformation and is generally quantified as a percentage of
the elongation/compression over the unstressed (here diastolic) dimension (%).
Longitudinal strain is the parameter that expresses the longitudinal cyclic elongation of
the aorta, radial strain is related to the direction to the wall thickening and circumferential
strain is oriented along the circumference of the aorta at a given section, see Figure 11.

There are multiple ways to obtain the deformations in these three directions. The option
chosen for this project was based on the projection of the deformation values of each
patch into the longitudinal, radial and circumferential direction. In this way, for all the
indices of each patch, it was obtained a different value of longitudinal, radial and
circumferential strain but only the median of values of each direction at each of the indices
were finally stored.

Figure 11: Graphical representation of radial, circumferential and longitudinal strain.

 15
To obtain the radial direction (Rxyz) of one point (P), firstly the nearest centreline point
(C) needed to be calculated. This was carried out calculating the pairwise distance
between P and all the points of the centerline, then the minimum distance was acquired
in order to find C. The direction that joints P and C is the radial direction (Rxyz).

Then, the deformation in X, Y and Z (Dxyz) in P was projected in Rxyz with the following
equation:

 ⃗⃗⃗⃗⃗⃗⃗⃗⃗⃗⃗
 · ⃗⃗⃗⃗⃗⃗⃗⃗⃗⃗⃗

 | | = ⃗⃗⃗⃗⃗⃗⃗⃗⃗⃗⃗⃗
 ( ) =
 ⃗⃗⃗⃗⃗⃗⃗⃗⃗⃗⃗ (2)
 ⃗⃗⃗⃗⃗⃗⃗⃗⃗⃗⃗|
 |

Longitudinal direction (Lxyz) was obtained from the projection of the tangential direction
(Txyz) in P into the perpendicular plane to Rxyz. Tangential direction is obtained by
calculating the derivative at that point. The projection of a vector onto a plane was
calculated by subtracting the component of the vector that is orthogonal to the plane. The
vector perpendicular to the plane is the radial direction Rxyz.

The projection of Txyz was obtained with the following equation:

 | | = ⃗⃗⃗⃗⃗⃗⃗⃗⃗⃗⃗ − ⃗⃗⃗⃗⃗⃗⃗⃗⃗⃗⃗
 ⃗⃗⃗⃗⃗⃗⃗⃗⃗⃗⃗⃗ ( )
 ⃗⃗⃗⃗⃗⃗⃗⃗⃗⃗⃗ ·
 ⃗⃗⃗⃗⃗⃗⃗⃗⃗⃗⃗
 ⃗⃗⃗⃗⃗⃗⃗⃗⃗⃗⃗ −
 = (3)
 ⃗⃗⃗⃗⃗⃗⃗⃗⃗⃗⃗|
 |

Then, longitudinal strain was calculated with the same criteria as radial strain, the
projection of Dxyz into Lxyz follows the equation:

 ⃗⃗⃗⃗⃗⃗⃗⃗⃗⃗⃗
 · ⃗⃗⃗⃗⃗⃗⃗⃗⃗⃗

 | | = ⃗⃗⃗⃗⃗⃗⃗⃗⃗⃗⃗
 ⃗⃗⃗⃗⃗⃗⃗⃗⃗⃗⃗ ( ) = (4)
 ⃗⃗⃗⃗⃗⃗⃗⃗⃗⃗|
 |

Finally, to obtain the circumferential direction (Cxyz) of the deformation vector, the
perpendicular vector to the radial and longitudinal direction was found. Cross product
between 3D vectors produces a vector orthogonal to both:

 ⃗⃗⃗⃗⃗⃗⃗⃗⃗⃗⃗
 | | = ⃗⃗⃗⃗⃗⃗⃗⃗⃗⃗ (5)

Circumferential strain was then obtained as:

 ⃗⃗⃗⃗⃗⃗⃗⃗⃗⃗⃗
 ⃗⃗⃗⃗⃗⃗⃗⃗⃗⃗⃗ ·

 | | = ⃗⃗⃗⃗⃗⃗⃗⃗⃗⃗⃗
 ⃗⃗⃗⃗⃗⃗⃗⃗⃗⃗⃗⃗ ( ) = (6)
 ⃗⃗⃗⃗⃗⃗⃗⃗⃗⃗⃗|
 |

 16
Figure 12: Radial, longitudinal and circumferential directions.

To obtain the deformation value in the next frame (t+1), the new coordinates of the
surface wall had to be calculated. To avoid imprecisions and outliers, firstly null values
in time t were removed for X, Y and Z deformations. Outliers were defined as deformation
values outside the range between 5 and 95% of the distribution of deformation in each
patch. They were removed obtaining the percentile between 5-95% for each one of these
deformations and the median rounded of these values represented the traslation in each
of the three directions. These deformation values translated the coordinates in time t to
the new coordinates that represented the surface wall in time t+1 for this patch. From
these new aortic surface coordinates, the process of obtaining radial, longitudinal and
circumferential strain was repeated until all the time frames were completed. Final strain
results were fitted to smoothing splines in order to avoid noise and imprecisions.

 17
2.8. Validation

Validation was required to evaluate the performance and limitations of the registration
method and strain results. To validate radial and circumferential strain results, they were
compared to distensibility and aortic pulse wave velocity (PWV) of related studies to
assess the reliability of local strain as a measure of local stiffness. Aortic distensibility as
a parameter has been used frequently to evaluate elastic property of the aorta. It has been
demonstrated that distensibility of the aorta decreases as the aorta enlarges [27].

Aortic wall distensibility (D) of ascending aorta is evaluated using the following formula:

 ( − )
 = (7)
 ( − )

Where Amax is the maximal systolic aortic area (mm2 ), Amin is the minimal diastolic
aortic area (mm2 ), Pmax is the systolic blood pressure (mmHg) and Pmin is the diastolic
blood pressure (mmHg). Distensibility is usually expressed as 10−3/mmHg.

In other studies [43], PWV was established as another parameter used to asses aortic
elascity. It was determined as Δx/Δt (m/s), where Δx is the aortic distance between two
imaging levels and Δt is time delay between the arrival of the foot of the pulse wave
between these imaging levels.

Regarding other studies [28] that evaluated circumferential aortic strain in patients with
aortic aneurysms, it was calculated as:

 ( − )
 = (8)

Where Amax and Amin are maximum and minimum areas. If distensibility is expressed
as 10−3/mmHg, and for circumferential strain the systolic and diastolic blood pressure
(mmHg) is not considered, then circumferential strain should be obtained at a scale of
10−3. After applying Thirion’s Demons algorithm to 3D time-resolved CMR, the
deformation values obtained at each of the pixels of the image were in units of pixels. In
this way, each of the three deformation values (deformation in X, Y and Z) of each pixel
of the volumetric image were multiplied by a factor of 100 to obtain strain values in units
of percentage, thus agreeing with the order of magnitude of results from other studies.

 18
3. Results

This section includes the results obtained from the registration algorithm and extraction
of 3D deformation values. Ten patients with descending or abdominal aorta aneurysms
were evaluated for the project. The resulting measurements were represented in graphs
where radial and circumferential (%) were showed with respect to the cardiac cycle (%),
starting from early systole. Longitudinal strain results were finally omitted since they
were deemed unreliable in the majority of the patients.

 3.1. Radial and circumferential strain analysis

Radial and circumferential strain were evaluated as the aortic surface deformation needed
to align the volumetric image at each time of the cardiac cycle with the volumetric image
at diastole. Initially, the whole thoraco-abdominal aorta was considered, but as some cine
CMR did not contained the abdominal region of the aorta and the other patients presented
an abdominal aorta aneurysm, several imprecisions interfered in the final results.
Therefore, abdominal region of the aorta was not taken into account in the final results.

The aorta was divided in 24 longitudinal regions, where each of them contained 8
circumferential regions. From these 24, only 20 were taken in account since the last four
represented the abdominal region of the aorta. The 160 patches were classified depending
on whether they belonged to Ascending Aorta (AAo), Aortic Arch (AArch) or
Descending Aorta (DAo) region.

Then, measurements results were included in four different graphs for radial and
circumferential strain respectively, as it is shown in Figure 13, Figure 14 and Figure 15
for three representative patients. The first row of graphs contained the median of the radial
(left) and circumferential (right) strain of all the patches, the second row represented the
median of the radial strain of the Ascending Aorta (comprising Proximal Ascending Aorta
and Distal Ascending Aorta, left), Aortic Arch (center) and thoracic DAo (right). The
third row represented the median of the circumferential strain of the Ascending Aorta
(comprising Proximal Ascending Aorta and Distal Ascending Aorta, left), Aortic Arch
(center) and thoracic DAo (right). In this way, strain results could be compared in each
of the different regions between a cohort of patients.

Three out the ten patients are represented in Figure 13, Figure 14 and Figure 15. The
strain values of the remaining patients are presented in Table 2. As expected, the
behaviour for the majority of them corresponded to a positive strain in all regions in
systole. Then, values descrease in diastole.

 19
In Figure 13, radial and circumferential strain from a 69 years old male patient with an
abdominal aneurysm is represented. The segmentation of the whole-thoraco abdominal is
presented in Figure 16 (a).

Figure 13: Radial and circumferential strain results in function of % of the cardiac cycle in
patient 2.
 20
In Figure 14, results are reported for another 80 years old male subject, which also was
affected by an abdominal aneurysm. Both patients presented higher radial and
circumferential strain in AAo in comparison with DAo. The segmentation of the whole-
thoraco abdominal is presented in Figure 16 (b).

Figure 14: Radial and circumferential strain results in function of % of the cardiac cycle in
patient 8.
 21
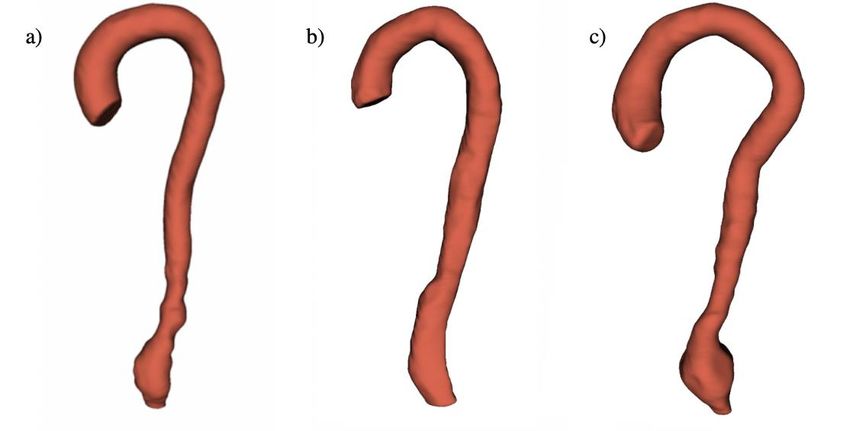
In Figure 15, an older patient of 87 years old is represented. Both radial and
 circumferential strain of patient 10 revealed irregular values at AArch. Lower strain at
 DAo in comparison with patients of Figure 13 and Figure 14 showed greater stiffening at
 aortic wall. When the size of the aneurysm was analysed, it was observed that the
 aneurysm presented a bigger diameter in comparison with the other two patients, see
 Figure 16 (c).

Figure 15: Radial and circumferential strain results in function of % of cardiac cycle in patient
10.
 22
Figure 16: Segmentations of patient 2 (a), patient 8 (b) and patient 10 (c).

 3.2. Clinical data and mean strain analysis
The radial and circumferential strain values obtained in the ten patients were analysed as
a function of sex and age. The characteristics and mean strain results of the cohort of
patients are reported in Table 1. In general, higher deformation values in the radial
direction in the AAo were observed in comparison with the DAo (14.1 ± 11.6 vs 4.4 ±
4.1) and the same behaviour was observed regarding circumferential strain (%) (20.3 ±
16.4 vs 7 ± 4.2). In this way, both in the radial and in the circumferencial strain the
dilation at DAo is reduced to a 30-35% of the AAo values in Table 1.

 Table 1: Mean ± standard deviation of the clinical features and the radial and
 circumferential of all patients.
 23
Table 2 includes radial and circumferential strain values for each of the ten patients. The
range of ages went from 69 to 81. Table 2 shows that the radial and circumferential strain
of female aortas were lower in comparison with male aortas, but only two female subjects
were available. In addition, no differences were observed in the deformation results
between female aortas with respect to the age, one being 71 years old (patient 4) and the
other 85 years old (patient 9). Regarding male subjects, more variety of ages were
analyzed.

Table 2: Radial and circumferential strain of each of the patients in function of the sex
(Female or Male) and age.

Patients 5, 6 and 7 presented strain values very close to 0% at DAo whereas radial and
circumferential at the AAo and AArch were of more than 20 %. The factor that they had
in common was that the aortic wall at DAo was darker than the remaining patients (Figure
17), which could be the reason why reliable results were not obtained for these three
patients. Therefore, these three patients were removed in Figure 18, where the
representation of radial and circumferential strain for each of the regions was evaluated
in function of the years of the patients.

Figure 17: Cine CMR of patient 8 (a) and cine CMR of patient 7 (b).
 24
In Figure 18, the relation of strain and age in each of the anatomic regions is evaluated.
Due to the low number of patients analysed, no linear increasing or decreasing of radial
and circumferential strain could be obtained. Older patients (80-87 years old) displayed a
decreasing of radial strain at DAo as age increased, meaning more aorta stiffening.

 Figure 18: Radial and circumferential strain (%) in each of the regions in function of
 the age.

 25
4. Discussion
In this project, 4D strain from 3D cine CMR of the thoracic aorta was quantified. A
registration algorithm was applied to obtain the deformation of the aorta over the cardiac
cycle relative to a diastolic reference. This enabled to track the motion of the aortic wall
and calculate radial and circumferential strain in each of the anatomical regions of the
aorta. The study cohort included ten patients with descending or abdominal aneurysms.

As shown in Figure 13, Figure 14 and Figure 15, higher values of strain are observed at
systole frames (where the heart chambers are contracting and pumps the blood towards
the periphery via the arteries, increasing pressure) in comparison with the final % of
cardiac cycle, which corresponds to diastole (where the heart chamber is in a state of
relaxation and aortic blood pressure is at its minimum), resembling in this way to the
arterial pressure dynamics [46].

In Table 1, values of radial and circumferential strain in the ascending aorta, aortic arch
and thoracic descending aorta are presented along with patients’ age and sex. As all the
patients included in the project had descending or abdominal aorta aneurysms, generally,
the aorta displayed more deformation in the AAo and lower strain in the DAo. This is
because thoracic aorta aneurysms usually involve the hardening of the artery due to
arteriesclerosis, which thickens and reduces the elasticity of the arterial wall.

In Table 1 and Table 2, it can be observed that only 2 females were available. Aortic
aneurysms rupture depends on multiple factors, including blood pressure, tissue
properties, and vascular geometry. Several studies confirmed that men are more
susceptible to develop aorta aneurysms but women are at greater risk for progression and
rupture [32, 33]. This increased risk of rupture in women may be a result of unfavorable
biomechanical properties of the female aorta since they require significantly lower energy
for dissection compared with male aortas [34].

With increasing age, aortic dimensions change and aortic stiffness increases, as has been
demonstrated in several previous studies [33, 38]. Then, aortic wall mechanics and stress
seems to play an important role in aortic stiffening. In the course of a lifetime the human
aorta will undergo billions of cycles of expansion and contractions. This cyclic
mechanical stress leads to fragmentation of the elastic fiber and replacement with
amorphous material, leading to an increased stiffness and weakening of the aortic wall
[44].

In this project, only patients with ages between 69 to 81 were analysed. Then, an exact
comparison of aortic stiffening between young and old subjects could not be carried out,
in addition to the low number of patients that finally was taken in account. In Table 2 and
Figure 18 is shown that patients between 69-71 years old presented less radial and
circumferential strain at AAo and more strain at DAo in comparison with patients
between 80-87 years old, which presented more aortic wall stiffening as the age increases.

 26
In this project neither aortic distensibility nor PWV were quantified but a comparison of
conclusions from other studies that performed the analysis of these parameters were
carried out in order to validate radial and circumferential strain results. Several studies
that evaluated circumferential strain (%) in patients with abdominal aorta aneurysms [29,
30, 36, 37] reported circumferential strain values of 8-15 %. These values agree with the
majority of circumferential strain results obtained in the project (see Table 1 and Table
2).

Furthermore, some studies [44] demonstrated that aortic distensibility decreases with
aging, whereas PWV increases with age. Then, the decreasing aortic elasticity may be
related to normal structural changes during aging. Other studies [45] that also evaluated
distensibility and PWV suggested that not only is there a general decline in aortic elastic
function with increasing age, but also that, in women, the largest decrease occurs over the
menopausal period. Endogenous estrogen, or estradiol (E2), is generally believed to be
vasoprotective in females in the context of cardiovascular diseases, such as hypertension
and atherosclerosis [31], with menopause the levels of these hormones decrease. Male
subjects have higher levels of circulating androgens and less estrogen compared with
women. Then, the preclinical evidence thus far suggests that androgen signaling
contributes to aneurysmal development [32].

On the other hand, other studies [43] that evaluated aortic PWV observed that there was
no difference in the steepness of the increase in PWV with increasing age when
comparing males and females. In this way, after the comparison of several studies, it is
demonstrated that there is no an exact answer about the relation that these parameters
have regarding age and sex but there is a tendency that points out that aortic elastic
function accompanies advancing age and is greater in females than in males, specially
marked in age groups over 60 years old.

Finally, it can be concluded that PWV is a direct measurement but its global assessment
lack the capacity to analyze local aortic stiffness, whereas distensibility is a correct
description of aortic wall circumferential Young modulus but under the assumptions of
circular, straight and uniform thin-walled aorta free from longitudinal deformation and
built of linearly elastic material containing an inviscid fluid, as described by Moens-
Korteweg equations [47]. Given the complex, 3D geometry of many arteries and the
substantial longitudinal deformation of the aortic proximal region, these assumptions
likely substantially impact the association between derived quantities and aortic wall
stiffness. The methodology used in this project consider deformation in all directions,
may thus allow for the improvement of the assessment of aortic stiffness by the
quantification of wall deformation.

 27
4.1. Limitations and future work

One of the main limitations of this project is that longitudinal strain could not be
quantified correctly. The waveforms that represent longitudinal strain were irregular in a
large group of patients.

In addition, the lack of homogeneity in cine CMR was a limitation regarding the impact
that spatial resolution could have in the performance tracking. To correct the
heterogeneity because of the few number of slices, 3D MRA images were used to
determine the location of the aortic wall and extract the deformation values at those
points, but the resolution differences between these two types of images could have
interfered in final results.

The last limitations were the absence of healthy controls to compare with patients with
descending or abdominal aneurysms and the limited number of patients analysed,
especially women. Thus, results regarding differences with respect to sex as well as those
covering the potential effect of age should be considered with caution.

In this project, different diastolic reference frames were tested for each patient and the
best outcome was chosen. Further work could be focused on trying multiple diastolic
reference frames and then carry out the median of all the options in order to reduce the
noise and improve accuracy.

Furthermore, image acquisition was performed at 3T with Discovery MR750w (GEM,
GE, WI). Although the use of 3T CMR has been shown to provide higher diagnostic
accuracy than that of 1.5T, 3T CMR present disadvantages compared with 1.5T MR
imaging such as more susceptibility artifacts, greater B0 field inhomogeneity, and higher
local energy deposition [48]. Then, future work could be based on try 1.5T CMR and
evaluate if there is more accuracy and less noise in the final results.

 28
5. Conclusion
This project achieved the quantification of 4D radial and circumferential strain from
patients with abdominal or descending aneurysms. Arterial stiffening, which occurs when
arteries thicken and lose elasticity, is associated with cardiovascular disease and increased
risk for future cardiovascular events, such as aneurysm formation and dissection. CMR
measurement of aortic diameters, distensibility and pulse wave velocity have been proved
of being reproducible and available, but this study confirmed that the measurement of
aortic strain could be used in clinical practice for the assesment and monitor of
pathological aortas, which will allow to risk-stratify patients and potentially prevent
conditions such as aortic dissections. Future work should be focused on carrying out the
comparison between healthy and diseased patients and should focus on the assessment of
predictive value for progressive dilation and occurrence of adverse aortic events.

 29
You can also read