Economic impacts of fall armyworm and its management strategies: evidence from southern Ethiopia
←
→
Page content transcription
If your browser does not render page correctly, please read the page content below
European Review of Agricultural Economics (2020) pp. 1–29
doi:10.1093/erae/jbz048

Economic impacts of fall armyworm and its
management strategies: evidence from

                                                                                                                   Downloaded from https://academic.oup.com/erae/advance-article-abstract/doi/10.1093/erae/jbz048/5698630 by guest on 07 May 2020
southern Ethiopia
Menale Kassie†, *, Tesfamicheal Wossen‡ , Hugo De Groote§ ,
Tadele Tefera**, Subramanian Sevgan† and Solomon Balew††
†
 International Centre of Insect Physiology and Ecology (ICIPE), Nairobi,
Kenya; ‡ International Institute of Tropical Agriculture (IITA), Nairobi,
Kenya; § International Maize and Wheat Improvement Centre (CIMMYT),
Nairobi, Kenya; ∗∗ International Centre of Insect Physiology and Ecology
(icipe), Nairobi, Kenya; †† Development Economics Group, Wageningen
University and Research, the Netherlands

Received March 2019; final version accepted November 2019

Review coordinated by Salvatore Di Falco

Abstract
This paper explores the economic implications of fall armyworm (FAW) and its
management strategies by exploiting exogenous variation in FAW exposure amongst
households in southern Ethiopia. We find that FAW exposure affects maize yield and
sales negatively, but not consumption. Furthermore, we find evidence of crowding-
in and intensification of insecticide use in response to FAW exposure. We also find
suggestive evidence that existing extension service arrangements lack the capacity to
deal with emerging threats such as FAW. Results imply that targeted interventions
aimed at improving the effectiveness of control measures and institutional capacity
would be key to reduce the adverse effects of FAW.

Highlights
•    The economic impact of fall armyworm (FAW) in southern Ethiopia
     assessed
•    Fall armyworm significantly reduces maize yields and maize sales
•    A positive correlation observed between FAW exposure and intensity of
     insecticide use
•    Existing individual FAW control strategies do not significantly abate losses
     from FAW
•    Improving institutional capacity is essential to control FAW

*Corresponding Author: E-mail: mkassie@icipe.org

© Oxford University Press and Foundation for the European Review of Agricultural Economics 2020.
This is an Open Access article distributed under the terms of the Creative Commons Attribution Non-Commercial
License (http://creativecommons.org/licenses/by-nc/4.0/), which permits non-commercial re-use, distribution, and
reproduction in any medium, provided the original work is properly cited. For commercial re-use, please contact
journals.permissions@oup.com
2 M. Kassie et al.
Keywords: fall armyworm, control strategies, maize productivity, maize sales, maize
consumption
Downloaded from https://academic.oup.com/erae/advance-article-abstract/doi/10.1093/erae/jbz048/5698630 by guest on 07 May 2020
JEL classification: I31, O13, Q12, Q16
1. Introduction
Agriculture remains the primary source of livelihoods for most households in
sub-Saharan Africa (SSA) (Dercon and Gollin, 2014). However, the sector’s
contribution to food security and poverty reduction is limited by many, often
interacting, biotic and abiotic factors. For example, the recent invasion of fall
armyworm (Spodoptera frugiperda JE Smith) has become a major threat to
food security in the region (Day et al., 2017). The fall armyworm (FAW) is an
invasive and damaging pest native to tropical and sub-tropical America, but it is
spreading across Africa. The pest arrived in SSA during a time when the region
is challenged to feed its rapidly growing populations – an on-going battle. Since
its arrival in 2016, in West Africa, the pest has spread rapidly through the conti-
nent, currently affecting 44 countries (Rwomushana et al., 2018). The outbreak
of FAW is a major setback in SSA as it causes enormous damage to maize
crops, the prime staple food for more than 300 million farmers in Africa (Day et
al., 2017; Wossen et al., 2017; VIB, 2019). Current estimates from 12 African
countries suggest an annual loss of 4.1 to a massive 17.7 million tons of maize
due to FAW (Rwomushana et al., 2018). Farm-level estimates from Ghana and
Zambia suggest a yield loss of 22–67 per cent (Day et al., 2017), 47 per cent
in Kenya (Kumela et al., 2018) and 9.4 per cent in Zimbabwe (Baudron et al.,
2019) due to FAW infestation. If appropriate and effective control strategies are
not implemented, the pest will continue to cause massive destruction to maize
and aggravate the already precarious food security and livelihood conditions
of millions of smallholder farmers across many countries in SSA.
In Ethiopia, FAW poses a significant risk for 9.6 million maize-producing
smallholders. Current reports suggest that a quarter of the 2.9 million ha of
land planted with maize is infested by FAW, resulting in a loss of more than
134,000 tons of maize production (Beemer, 2018). Such losses could have fed
about 1.1 million individuals.1 In addition to yield reductions, the country has
also incurred significant expenditures on insecticides and monitoring costs. For
instance, in the 2017 cropping season, the country spent about US$4.6 million
to purchase 277,000 litres of insecticides and equipment for surveillance work
to trace and track pest infestations. Such emergency investment can hurt other
development efforts by diverting resources from other productive investments.
Furthermore, beyond yield losses and pest control costs, other FAW-induced
economic impacts can include reduction of income due to reduced maize sales;
reduced food consumption because of reduced food availability from both
crops and livestock, as crop residues are a major livestock feed source in rural
1 The per-capita maize consumption is 127 kg per person per year in major maize-producing
regions of Ethiopia, including our study area (Muricho et al., 2017).Economic impacts of fall armyworm and its management strategies 3
areas; higher medical treatment expenditure for people exposed to insecticides
and environmental damage related to insecticides contamination (Denberg &
Jiggins, 2007; Midingoyi et al., 2018). Moreover, FAW infestation can affect
Downloaded from https://academic.oup.com/erae/advance-article-abstract/doi/10.1093/erae/jbz048/5698630 by guest on 07 May 2020
the performance of other businesses, including food processing industries
and suppliers of input, such as seeds and fertiliser along the maize value
chain.
Nonetheless, despite the obvious and significant risks posed by the incidence
of FAW, there is little rigorous empirical evidence to inform policymakers
and ongoing agricultural research efforts by quantifying the impact of FAW
on agricultural productivity and the welfare outcomes of smallholder farmers.
Previous research on the link between FAW and yield as well as on pest
control strategies such as grain/legume intercropping, frequent weeding, the
application of chemicals and implementing push-pull technology2 includes
(Day et al., 2017; Hailu et al., 2018; Kumela et al., 2018; Midega et al., 2018;
Baudron et al., 2019). However, these studies are not based on rigorous impact
estimation methods but on simple comparisons of means from household
survey data and on-farm experiments, without taking into account other factors
that influence yield and infestation levels. In addition, the studies mentioned
do not examine the welfare implications of FAW incidence or the role played
by institutions in minimising the risk of FAW. In this regard, we believe
that quantifying the economic impact of FAW and the potential effectiveness
of current control strategies can provide the necessary impetus to develop
improved FAW management and control systems. It can also help policymakers
prioritise their resource allocations for effective management of FAW and other
pests.
This paper contributes to the literature by offering a rigorous economic
analysis of the impacts of FAW and the role that pest control strategies and
institutions play in reducing the adverse effects of FAW. For this analysis,
we use comprehensive household- and plot-level data collected in southern
Ethiopia. More specifically, we provide insights into (i) how maize yield,
quantities of maize sales and per capita maize consumption are affected by
exposure to FAW; (ii) the association between the incidence of FAW and
insecticide use at farm level; (iii) the effectiveness of current FAW control
strategies used by farmers in minimising the economic burdens of FAW
and, finally, (iv) the role that institutional capacity and readiness play in
reducing the adverse effects of FAW and how this is affected by farmers’
access to – and trust in – the existing institutions, in particular agricultural
extension.
The rest of the article is organised as follows: section 2 presents the study
area and data, while section 3 reports descriptive statistics for treatment
2 Push-pull technology is a cropping system in which cereals such as maize are intercropped
with perennial fodder legumes (Desmodium) that repel (‘push’) stemborers and suppress Striga
species (witchweed). The cereal crops are also surrounded by a border of perennial fodder grass
(e.g. Pennisetum purpureum/Napier grass or Brachiaria species) that attracts (‘pulls’) stemborers
away from cereal plants (Khan et al., 2014; Pickett et al., 2014).4 M. Kassie et al.
and outcome indicators and socio-economic and institutional characteristics.
Section 4 describes the empirical strategy employed to estimate the impact
of FAW. Section 5 presents our empirical results, and section 6 concludes the
Downloaded from https://academic.oup.com/erae/advance-article-abstract/doi/10.1093/erae/jbz048/5698630 by guest on 07 May 2020
paper.
2. Study area and data sources
The data used in this study come from the Hawassa Zuria District in Southern
Ethiopia to assess the impact of integrated pest management options on maize
and livestock productivity. This district was selected for this study because
it is one of the country’s main maize-producing areas. Maize is the second
dominant crop next to teff (Eragristis teff ) amongst the cereal that is grown in
Ethiopia. The country cultivates over 2 million ha with an average maize yield
of about 3 tons/hectare. More than 9 million smallholder farmers are involved
in maize production in Ethiopia (Abate et al., 2015). A study in major maize
growing areas of the country shows that maize accounts for up to 61 per cent
of all crop sales amongst male-headed households and 58 per cent amongst
households led by women (Marenya et al., 2016), implying that maize is a
major food security and cash crop with important implications for household
welfare.
The Southern Nations, Nationalities, and People’s region (SNNPR),
where this study is carried out, occupies 15 per cent of the country maize
cultivated area (CSA (Central Statistical Agency), 2017/2018). The study
district represents 5 per cent and 16 per cent maize area and produc-
tion of the region, respectively (CSA (Central Statistical Agency), 2017/
2018).
3. Descriptive statistics
3.1. Socio-economic and plot variables
Maize is the most important cash and staple food crop grown in the study area.
The average farm size is about 1.16 ha, but more than 70 per cent of it is
allocated to maize cultivation. The household survey data were collected for
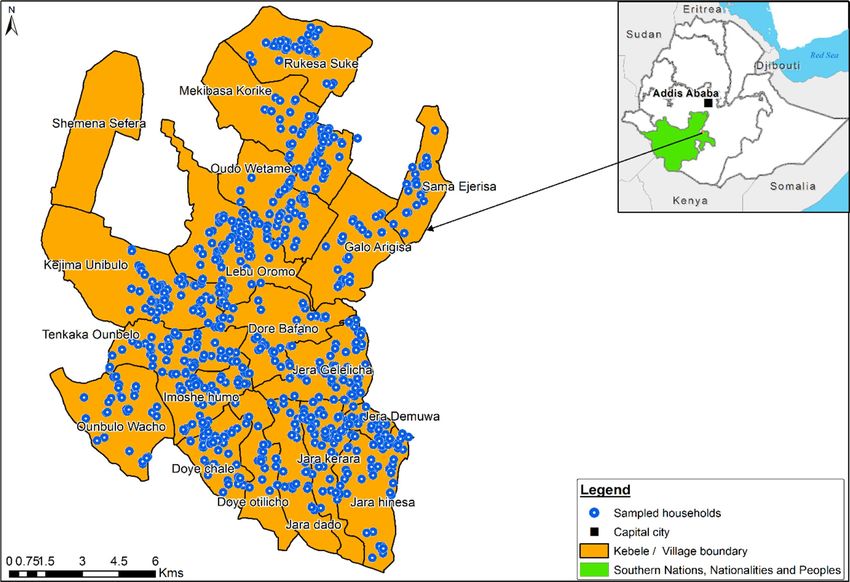
the 2017/2018 production season in May and June 2018 from 1,269 randomly
selected maize farmers in 18 villages out of the 23 villages in the district (Figure
1).3 The sample households grew maize on 1.8 plots on average (about 2,293
plots from 1,269 households), and 62 per cent of the surveyed households grew
maize on more than one plot.
Table 1 summarises household-, plot- and village-level variables, based on
data collected using Census and Survey Processing System (CSPro) software.
3 The plan was to cover all villages in the District, but the five villages planted maize before we
implement a baseline survey.Economic impacts of fall armyworm and its management strategies 5
Downloaded from https://academic.oup.com/erae/advance-article-abstract/doi/10.1093/erae/jbz048/5698630 by guest on 07 May 2020
Fig. 1. Map of the study area.
The data comprise explicitly household and plot characteristics as well as data
related to FAW and other plot-level shocks.
Plot characteristics data included maize yield, maize varieties, the distance
of the plot to the farmer’s residence and plot ownership (1 = Owned, 0 other-
wise) and perception of plot fertility, plot slope and soil depth. Other plot-
related data included farm investment, such as factor inputs (pesticide use,
fertiliser, seed, labour, frequency of weeding and ploughing) and agricultural
practices (maize–legume intercropping, irrigation and manure). Maize–legume
intercropping was practised on 57 per cent of the total sample of maize plots.
The haricot bean was the dominant legume intercropped with maize in the
study area.
The institutional data captured included information on farmers’ trust in
extension officers, and the distance to the nearest extension service information
centre and to the nearest main market. Information on socioeconomic charac-
teristics includes self-reported quantities of maize sales and consumption, farm
size and cell phone and livestock ownership, gender (1 = Male, 0 otherwise),
number of years of education and the age of the household head. Finally,
location-related variables denoted by dummies for village and altitude were
included in the analysis to capture location-specific heterogeneities between
affected and unaffected farmers.
3.2. Treatment and outcome indicators
In this section, we present the descriptive statistics of our main treatment and
outcome indicators. The incidence of FAW as reported by the farmers is our6 M. Kassie et al.
Table 1. Definition of variables and summary statistics
Variables Mean Standard deviation
Downloaded from https://academic.oup.com/erae/advance-article-abstract/doi/10.1093/erae/jbz048/5698630 by guest on 07 May 2020
Outcome variables
Maize yield (kg/ha) 3,185 1,400
Maize quantity sold (kg) 885.3 956.7
Per capita maize consumption (kg/year) 142.7 77
Insecticide use (1/0) 0.334 0.472
Insecticide use (ℓ/ha) 0.729 1.55
Plot shocks
Fall armyworm (1/0) 0.670 0.470
Stemborer (1/0) 0.592 0.492
Other shocks (1/0) 0.301 0.459
Fall armyworm control measures
No control measure (ref) 0.087 0.282
Chemicals (1/0) 0.134 0.341
Handpicking (1/0) 0.294 0.456
Ash (1/0) 0.013 0.112
Chemicals + handpicking (1/0) 0.116 0.320
Chemicals + ash 0.008 0.091
Handpicking + ash 0.018 0.134
Plot investment
Urea use (kg/ha) 141.3 284.56
DAP use (kg/ha) 139.70 229.40
Seed use (kg/ha) 21.08 9.07
Hired labour (1/0) 0.423 0.494
Ploughing frequency 3.142 0.423
Herbicide use (1/0) 0.022 0.148
Weeding frequency 2.86 0.527
Plot characteristics
Good plot fertility (ref) 0.669 0.471
Medium plot fertility (1/0) 0.300 0.459
Poor plot fertility (1/0) 0.030 0.171
Flat plot (ref) 0.772 0.420
Medium slope plot (1/0) 0.205 0.403
Steep slope plot (1/0) 0.024 0.152
Shallow depth plot (ref) 0.316 0.465
Medium depth plot (1/0) 0.271 0.445
Deep depth plot (1/0) 0.413 0.492
Manure (1/0) 0.394 0.489
Irrigation (1/0) 0.023 0.149
Legume-maize intercropping (1/0) 0.570 0.495
Plot distance to residence (walking minutes) 37.1 101.6
Plot tenure (1 = owned, 0 otherwise) 0.938 0.241
Household characteristics
Sex of household head (1 = male, 0 0.939 0.239
otherwise)
Age of household head (years) 42.8 11.797
(Continued)Economic impacts of fall armyworm and its management strategies 7
Table 1. Continued
Variables Mean Standard deviation
Downloaded from https://academic.oup.com/erae/advance-article-abstract/doi/10.1093/erae/jbz048/5698630 by guest on 07 May 2020
Family size (number) 5.766 1.695
Education of household head (years) 5.084 4.554
Distance to extension services (walking 30.5 25.37
minutes)
Household confidence in extension service 0.824 0.381
officers (1/0)
Cellphone ownership (1/0) 0.161 0.367
Value of livestock ownership (‘000 s) 29.170 29.915
Distance to main market (walking minutes) 69.986 55.108
Altitude (metres above sea level) 1733.105 68.151
Plot (household) observations 2,292 (1,269)
key variable of interest collected at plot level (1 = plot suffers from FAW, 0
otherwise). To measure the incidence of FAW, respondents were asked the
following two related questions: (1) Are you or your household aware of FAW?
and (2) Can you identify the FAW from these pictures? The second question was
asked to verify farmers’ knowledge of FAW and to eliminate the possibility of
some farmers mixing up FAW with other pests such as stemborer. In addition to
FAW, we also collected plot-level data on the incidence of other types of pests
as reported by the farmers, such as stemborer (1 = plot affected by stemborer,
0 otherwise), as well as other incidents such as disease infections and adverse
climatic events (1 = plot suffered from other incidents, 0 otherwise). In addition,
the survey captured self-reported maize yield losses due to FAW, stemborer,
diseases and adverse climatic events (drought and flood) that affected the plot.
Data on FAW control measures were also collected for each plot. Of the total
sample households, 84 per cent were aware of FAW, and amongst those, 97 per
cent correctly identified it from the pictures presented to them. Based on the
data from the picture verification exercise on the incidence of FAW, we found
that about 74 per cent of the interviewees were affected by FAW.
On FAW control measures, out of the 1,536 (67 per cent of the total maize
plots) maize plots infested by FAW, 13 per cent received no control measures;
20 per cent, 44 per cent and 2 per cent of the plots, respectively, were managed
using chemicals, handpicking and ash and 17 per cent, 1 per cent and 3 per
cent of maize plots, respectively, were treated with a combination of either
chemicals and handpicking, chemicals and ash, and handpicking and ash.
On institutional factors, FAW-affected households resided a 32-minute walk
away from sources of extension services, while unaffected households were
only a 25-minute walk away. Nonetheless, in terms of relying on institutional
information, the figures are roughly equal: about 82 per cent of the affected
households trusted the advice offered by extension officers in their villages,
compared with 84 per cent for households unaffected by FAW.8 M. Kassie et al.
Downloaded from https://academic.oup.com/erae/advance-article-abstract/doi/10.1093/erae/jbz048/5698630 by guest on 07 May 2020
Fig. 2. Non-parametric estimation of maize yield (kg/ha).
The first outcome variable is maize yield (kg/ha). The pooled plot average
maize yield (kg/ha) in our sample is 3.19 t/ha.4 Hybrid maize varieties were
planted in about 97 per cent of the maize plots during the current production
season (the dominant maize variety is the pioneer hybrid, P3812W). Self-
reported FAW maize production damage ranged from the lowest (1 per cent)
to the highest (100 per cent) loss. The average loss in the sample was recorded
as 10.8 per cent. The average maize yield on FAW-affected plots is 3.04 t/ha,
while it is 3.48 t/ha on unaffected plots (the difference is statistically significant
at the 1 per cent level). The difference in maize yields between plots affected
or unaffected by FAW is further illustrated in Figure 2, which depicts non-
parametric (kernel) estimates of the density of yields for the two types of plot.
The graph suggests a negative correlation between FAW infestation and maize
yields. Even though the relationship is not causal, the distribution suggests that
FAW may have an adverse consequence on food consumption as farmers’ food
availability – and, to some extent, accessibility of food – is determined by own
production (Kassie et al., 2015).
Our next outcome indicators are per-capita consumption of maize (kg per
year) and quantities of maize sales (kg). The difference in the above outcome
indicators between households affected or unaffected by FAW is reported in
Figures 3 and 4. In all cases, the distributions suggest lower outcomes (in terms
of consumption and quantities of maize sales) for FAW-affected households
compared with those that were unaffected. Furthermore, the Kolmogorov–
Smirnov equality-of-distributions test reveals that the difference is statistically
4 To account for potential outliers, for all outcomes (yield, quantities of maize sales, the quantity
of insecticides use, income and per-capita consumption), we trimmed the bottom and top 2 per
cent values.Economic impacts of fall armyworm and its management strategies 9
Downloaded from https://academic.oup.com/erae/advance-article-abstract/doi/10.1093/erae/jbz048/5698630 by guest on 07 May 2020
Fig. 3. Non-parametric estimation of per capita maize consumption.
Fig. 4. Non-parametric estimation of quantities of maize sales.
significant for all outcomes. However, these differences cannot be attributed to
FAW infestation without controlling for other confounding factors.
The final outcome indicator is the use of insecticides. According to
our data, insecticides were applied in about 33 per cent of the maize
plots, the average application rate being 0.73 ℓ/ha. Farmers applied more
insecticides on FAW-affected plots (1.0 ℓ/ha) compared with unaffected
ones (0.59 ℓ/ha). Figure 5 displays a higher insecticide application rate in
FAW-affected plots compared with unaffected plots across the entire rank
distribution.10 M. Kassie et al.
Downloaded from https://academic.oup.com/erae/advance-article-abstract/doi/10.1093/erae/jbz048/5698630 by guest on 07 May 2020
Fig. 5. Non-parametric estimation of insecticide use.
By and large, the descriptive analysis suggests that farm households affected
by FAW have experienced more negative economic outcomes than their unaf-
fected counterparts. However, this is an unconditional comparison. Outcome
variables are not only influenced by FAW incidence: they are affected by many
other factors too. In the next section, therefore, we evaluate the effects of FAW
that are conditional on other covariates.
4. Econometric framework for estimating FAW impacts
In this section, we present our primary empirical strategy to identify the effect
of FAW exposure on maize yield, quantities of maize sales, insecticide use
and maize consumption. Since the incidence of FAW is an exogenous shock
to the farming communities, its effect on the above-mentioned outcomes is
evaluated using an exogenous treatment framework. In particular, we employ
the following function specification for our key outcome indicators:
Yip = βF ip + ϑXip + ϕV j + εip (1)
where the indices i and p denote household and plot, respectively, and Yip
denotes outcome variables (maize yield per ha, quantities of maize sales,
probability and litres of insecticide used and per-capita maize consumption).
While maize yield and insecticide use are measured at the plot level, quantities
of maize sales and per-capita consumption are measured at the household
level. Fip is a FAW dummy variable equal to 1 if plot p is affected by FAW;
it is otherwise 0. Xip denotes vectors of observable plot and household level
covariates, while Vj captures village fixed effects to control for varying agro-
climatic conditions, general market and economic conditions and soil qualityEconomic impacts of fall armyworm and its management strategies 11
across the village. Finally, εip is a plot- and household-specific error term, and
the parameters to be estimated are β, ϑ and ϕ. The primary interest here is to
estimate the size and sign of FAW impact, β.
Downloaded from https://academic.oup.com/erae/advance-article-abstract/doi/10.1093/erae/jbz048/5698630 by guest on 07 May 2020
Even though exposure to FAW is reasonably exogenous, we also exploited
the variation in FAW exposure at the plot level and estimated a fixed-effect
model by introducing household fixed effects. Our plot data are cross-sectional,
but about 62 per cent of the households in our sample produce maize on more
than one maize plot. This enabled us to estimate differences in productivity and
insecticide use on plots cultivated by the same farmer that were either affected
or unaffected by FAW (Kassie and Holden, 2007, 2018). The inclusion of
household fixed effects would presumably account for unobserved household-
level heterogeneity. While controlling for household fixed effects, we also con-
trolled for a battery of plot characteristics as well as factor inputs in estimating
yield and insecticide use function to control for plot-specific observed and
unobserved characteristics.5
Next, we examined the effectiveness of control measure strategies, since
some farmers who are affected by FAW use chemicals, handpicking, ash or
some combination of these strategies. To explicitly quantify the effectiveness
of available FAW control measures, we introduced a categorical variable, Cip ,
which assumes the following values depending on the different strategies that
the farmers implement:6
1, No prevention strategy (none)
2, Chemicals
3, Handpicking
Cip = 4, Ash
5, Chemicals and handpick
6, Chemicals and ash
7, Handpicking and ash
Yip = α0 + γ Cip + ϑXip + ϕV j + εip (2)
The effectiveness of available strategies is evaluated by estimating their
effectiveness in protecting yield (Yip ). Letting Cip = 1 be the base category
(i.e. no prevention strategy), then γc2 = γc3 · · · = γc8 = 0 implies that the
control strategies currently being implemented by farmers do not reduce the
loss caused by FAW. However, if γc2 = γc3 = . . . γc8 > 0 and significant, then
implementing these control strategies is important as it prevents yield losses
due to FAW infestation.
In addition, using the following specification, we examined whether, and
to what extent, agricultural extension institution capacity proxied by farmers’
5 For example, if farmers access private information, such as how good the soil on their plot is or
what the shocks on the plot have been, they might adjust their factor input decisions accordingly
(Fafchamps, 1993; Levinsohn and Petrin, 2003; Assunção & Braido, 2004).
6 There are no farmers using a combination of the three measures.12 M. Kassie et al.
access to extension services, farmers’ trust in extension officers, which can
measure their capacity and maize–legume intercropping7 , helped reduce the
yield loss inflicted by FAW:
Downloaded from https://academic.oup.com/erae/advance-article-abstract/doi/10.1093/erae/jbz048/5698630 by guest on 07 May 2020
Yip = α0 +βF ip +γ Lip +δI i +ρ Fip ∗ Lip +θ Fip ∗ Ii +ϑXip +ϕV j +εip (3)
In the above specification, Lip measures maize–legume intercropping, while
Ii measures the institutional capacity – which, in our case, is access to extension
services. In addition to simple access, we also captured farmers’ trust in
extension officers as a proxy for their capacity. The roles of intercropping,
on the one hand, and of access to extension services, and trust in extension
officers in protecting yield losses, on the other, are both captured by the
interaction term between FAW infestation (Fip ) with access in extension
services/trust in extension officers (Ii ) and intercropping (Lip ). If θ, ρ ≥ 0,
then intercropping, access to extension services and trust in such extension
officers are all important in reducing the adverse effects of FAW. However, if
θ < 0, it would imply either that access to extension services is not important
in alleviating the negative effects of FAW infestation, or that such institutional
(extension service) capacity is needed, but it is lacking.
The choices of explanatory variables in all functions are governed by the
economic theory and previous similar empirical studies (Di Falco et al., 2011;
Teklewolde et al., 2013; Kassie et al., 2018; Wossen et al., 2019). Finally, we
considered within-group dependence while estimating standard errors. How-
ever, the usual cluster-robust standard errors that permit heteroskedasticity and
within-cluster error correlation assume a large number of clusters (Cameron
et al., 2008; Wossen et al., 2019). When there are too few clusters, the usual
cluster-robust standard errors are unreliable (Cameron et al., 2008). In our case,
standard errors were clustered at the village level, but we only had 18 villages.
Therefore, we follow the approach adopted by Cameron et al. (2008) in such
cases and report standard errors that are wild bootstrapped at the village level.
5. Results and discussions
This section discusses the impact of FAW on maize yield (t/ha), insecticide use
measured as a binary variable (1/0), quantity of insecticide used (ℓ/ha), quan-
tities of maize sold and per-capita maize consumption. In our estimation, we
transformed maize yield and per-capita maize consumption into a logarithmic
scale. For quantities of maize sold and quantity of insecticide use, we used an
inverse hyperbolic sine (IHS) transformation, as some farmers have zero values
for these indicators (Burbidge et al., 1988).
7 Agronomic practices represent alternative measures to mitigate the effect of FAW (Hailu et al.,
2018; Midega et al., 2018; Baudron et al., 2019). Though the use of legume-maize intercropping
is common in our study area it was not mentioned by farmers during the household survey and
focus group discussions as FAW management strategies. However, we tested its effects following
(Hailu et al., 2018; Midega et al., 2018; Baudron et al., 2019).Economic impacts of fall armyworm and its management strategies 13
Table 2. Maize yield estimation (kg/ha)
Variable Pooled ordinary Pooled ordinary Fixed effects Fixed effects
Downloaded from https://academic.oup.com/erae/advance-article-abstract/doi/10.1093/erae/jbz048/5698630 by guest on 07 May 2020
least squares least squares regression regression
regression (OLS) regression model model
Fall armyworm −0.124∗∗∗ −0.123∗∗ −0.095∗∗∗ −0.122∗∗
(0.019) (0.049) (0.035) (0.053)
Household characteristics No Yes No No
Plot investment No Yes No Yes
Plot characteristics No Yes No Yes
Household fixed effects No No Yes Yes
Village fixed effects No Yes No NA
R2 0.019 0.313 0.79 0.838
N 2,219 2,219 2,219 2,219
Notes: Standard errors, wild-bootstrapped at the kebele level, are reported in parentheses. ∗ p < 0.10, ∗∗ p < 0.05,
∗∗∗ p < 0.01.
Table 2 reports results on the effect of FAW on maize yield.8 The size and
sign of the estimated coefficients across the different specification are similar
and robust. Specifically, we find that FAW has a negative and statistically
significant effect on maize yield. Our result suggests that, on average, FAW
causes a yield loss of 11.5 per cent9 after controlling for household fixed effects
and other covariates that influence yield. This estimate is close to the self-
reported yield losses (10.8 per cent) reported in section 3.2.
In Table 3, we present results on farmers’ insecticide use behaviour in
response to FAW infestation. In our estimation, we considered effects both
at the extensive (probability to use) and intensive (application rate) margins.
The results show a significant positive association between exposure to FAW
and the use of insecticides, both at the extensive and intensive margins. Based
on the fixed effects estimate, exposure to FAW is associated with an increase
in the probability and intensity of insecticide use by 13 per cent and 38
per cent10 , respectively. The estimated results suggest that farmers not only
crowd-in insecticides, they also intensify the use of insecticides in response
to FAW exposure. In the next section, we discuss whether such crowding-in
and intensification of insecticides by farmers are effective in minimising the
adverse effects of FAW on maize yield.
Tables 4 and 5, respectively, report results on the effectiveness of control
strategies, the role of extension institution and the role of maize–legume
intercropping in preventing yield losses due to FAW. Concerning FAW control
strategies, the results indicate that individual measures, including insecticides,
are ineffective in protecting yield loses due to FAW. This result deserves further
8 Tables with full regression results for all outcome indicators are presented in Annex A.
9 Note that the effect is computed as 100(expβ − 1) since we use the log-level regression model.
10 Note that the effect is computed as 100(expβ − 1) since we use the log-level regression model.14 M. Kassie et al.
Table 3. FAW infestation and the use of insecticides
Variable Pooled linear Fixed effects Pooled ordinary Fixed effects
Downloaded from https://academic.oup.com/erae/advance-article-abstract/doi/10.1093/erae/jbz048/5698630 by guest on 07 May 2020
regression regression least squares regression model
model ( model regression model
Insecticide Insecticide Quantity of Quantity of
use (1/0) use (1/0) insecticides used insecticides used
(litres per ha) (litres per ha)
Fall armyworm 0.334∗∗∗ 0.125∗ 0.509∗∗∗ 0.321∗
(0.037) (0.066) (0.064) (0.159)
Household Yes Yes No No
characteristics
Plot characteristics Yes Yes Yes Yes
Household fixed No Yes No Yes
effects
Village fixed effects Yes NA Yes NA
R2 0.212 0.843 0.192 0.847
N 2,219 2,219 2,219 2,219
Notes: Standard errors, wild-bootstrapped at the kebele level, are reported in parentheses. ∗ p < 0.10, ∗∗ p < 0.05,
∗∗∗ p < 0.01.
attention because the measures applied were either not useful for controlling
FAW, or they were not applied at the right stage of the insect’s growth or
farmers did not properly target the pest during spray. This result, i.e. that
individual measures are not effective, is consistent with Baudron et al. (2019)
and Kumela et al. (2018), who find that pesticides lacked efficacy in controlling
FAW infestation11 .
However, our results also show that combining strategies, e.g. using chem-
icals and handpicking insect from the crop as well as handpicking and ash,
seem to be effective in protecting yield loss from FAW: farmers who employed
a combined strategy managed to protect their yield after a FAW infestation
in comparison with those who failed to employ any strategy at all. A probable
reason for the relative success of combining strategies is that, if the insect skips
one strategy, it can be overcome by another.
Furthermore, the insignificant coefficient on the interaction between FAW
control and maize–legume intercropping indicates that this agronomic practice
is ineffective in reducing the risk posed by FAW. Although this result contra-
dicts the findings by Hailu et al. (2018), it corroborates those of Baudron
et al. (2019), who revealed that maize–legume intercropping was not effective
in reducing the damage caused by the pest. In view of the danger of applying
a ‘one size fits all’ approach, these conflicting results highlight the importance
of understanding how and where control measures can perform well.
11 Given the low percentage of plots with some of the control measure combinations applied, we
also estimated a separate specification where the control measures chemical, handpicking and
ash were considered separately. Results remain consistent (Table 4, column 1).Economic impacts of fall armyworm and its management strategies 15
Table 4. Effectiveness of existing control strategies-ordinary least squares regression
[dependent variable: ln (maize yield, kg/ha)]
Downloaded from https://academic.oup.com/erae/advance-article-abstract/doi/10.1093/erae/jbz048/5698630 by guest on 07 May 2020
Variable Full sample Full sample FAW-affected
sub-sample
None - −0.123∗∗∗ -
(0.046)
Ash −0.157∗∗∗ −0.200∗∗∗ −0.086
(0.033) (0.034) (0.056)
Chemicals −0.110∗∗∗ −0.154∗∗∗ 0.001
(0.041) (0.049) (0.055)
Handpicking −0.085∗∗∗ −0.131∗∗∗ 0.004
(0.027) (0.031) (0.047)
Chemicals + handpicking - −0.062∗∗ 0.095∗∗
- (0.031) (0.043)
Chemicals + ash - −0.124∗ 0.038
(0.073) (0.060)
Ash + handpicking - −0.041 0.086∗∗∗
(0.058) (0.008)
Household characteristics Yes Yes Yes
Plot investment Yes Yes Yes
Plot characteristics Yes Yes Yes
Household fixed effects No No No
Village fixed effects Yes Yes Yes
Base category - No FAW Only FAW affected
infestation plots (No control
strategy used)
R2 0.308 0.313 0.292
N 2,219 2,219 1,496
In terms of the role that institution plays in ensuring farming success, namely
whether farmers have access to and trust the advice of bodies that provide
extension services, we gained some interesting insights. While the interaction
between access to extension services and FAW control was found to be
insignificant, the interaction between FAW control and confidence in extension
officers’ advice was positive and significant. The absence of a significant inter-
action effect between FAW control and extension services implies either that
access to such services is not important in the control of this pest, or that exist-
ing agricultural extension institution is not sufficiently prepared or equipped to
tackle the invasive species. From the results reported in Table 3, one can deduce
that the use of appropriate control strategies (the combination of chemicals
and handpicking, ash and handpicking, etc.) appears to have been the key
moderating factor in respect of the positive and significant effect found in the
interaction between FAW control and confidence in extension officers’ advice.
Finally, we provide effects on maize sales and consumption of maize in
Table 6. As expected, we find a negative and statistically significant association16 M. Kassie et al.
Table 5. Mitigating FAW risk – the role played by intercropping as well as access to, and
trust in, institutions-ordinary least squares regression
Downloaded from https://academic.oup.com/erae/advance-article-abstract/doi/10.1093/erae/jbz048/5698630 by guest on 07 May 2020
Variable ln (maize yield, kg/ha) ln (maize yield, kg/ha)
Fall armyworm −0.265∗∗ −0.251∗∗∗
(0.120) (0.093)
Distance to extension services 0.001 -
(0.017)
Fall armyworm X distance to extension 0.011 -
services
(0.019)
Trust in extension services −0.074∗ −0.077∗
(0.042) (0.045)
Fall armyworm X trust in extension 0.134∗ 0.144∗
services
(0.078) (0.083)
Legume-maize intercropping 0.067∗∗∗ -
(0.020)
Fall armyworm X legume-maize −0.021 -
intercropping
(0.035)
Household characteristics Yes Yes
Plot characteristics Yes Yes
Plot investment Yes Yes
Household fixed effects No No
Village fixed effects Yes No
R2 0.320 0.316
N 2,214 2,214
Notes: Standard errors, wild-bootstrapped at the kebele level, are reported in parentheses, ∗ p < 0.10, ∗∗ p < 0.05,
∗∗∗ p < 0.01.
between FAW infestation and maize sales. Specifically, it reduces maize sales
by 25 per cent. However, the reduction in maize yield did not translate into
a reduction in consumption for the period considered in this study. This has
two implications: either the yield loss caused by FAW is not large enough to
reduce existing maize consumption patterns, or some consumption-smoothing
behaviour has occurred amongst the sampled households, e.g. these households
have reduced the quantity of maize they supply to the market. However,
such consumption smoothing behaviour may lead to cash shortages to make
productive investment.
6. Conclusions
In this article, we estimated the economic impact of FAW infestations and
the role of control measures in mitigating the risks they entail. The analysis
was carried out using econometric methods applied to comprehensive cross-
sectional household and plot-level data collected from 1,269 maize farmers.Economic impacts of fall armyworm and its management strategies 17
Table 6. Effect of FAW on maize sales and consumption-ordinary least squares regression
model (dependent variable: ln (maize sales, kg) and ln (per capita maize consumption,
kg/person/year)
Downloaded from https://academic.oup.com/erae/advance-article-abstract/doi/10.1093/erae/jbz048/5698630 by guest on 07 May 2020
Variable ln (maize sales) ln (maize consumption)
Fall armyworm −0.239∗∗∗ 0.034
(0.066) (0.062)
Household characteristics Yes Yes
Household fixed effects No No
Village fixed effects Yes Yes
R2 0.42 0.124
N 1,034 1,222
Notes: Standard errors, wild-bootstrapped at the kebele level, are reported in parentheses, ∗ p < 0.10, ∗∗ p < 0.05,
∗∗∗ p < 0.01.
This is the first comprehensive study undertaken in Ethiopia to evaluate the
welfare damage caused by FAW. Quantifying the impacts of FAW in this way
provides the evidence required to prioritise resource allocation and develop
improved FAW management systems.
We find that exposure to FAW had a significant negative impact on maize
yield. Our results suggest a yield loss of 11.5 per cent even after controlling
for the pest management strategies that farmers use. However, the reduction
in maize yield did not translate into a reduction in consumption for the period
considered in this study. This has two implications: either the yield loss caused
by FAW is not significant enough to reduce existing maize consumption
patterns, or some consumption-smoothing behaviour has occurred amongst the
sampled households, e.g. these households have reduced the quantity of maize
they supply to the market.
The findings also indicate that the share of maize supplied to the mar-
ket is significantly lower amongst FAW-affected households compared with
their unaffected counterparts. Thus, if the infestation of the pest is not min-
imised through appropriate pest management systems, the negative association
between FAW exposure and quantities of maize sales will have long-term
impacts on food security and poverty reduction, as liquidity constraints affect
farmers’ capacity to invest in productivity-enhancing technologies.
Furthermore, farmers who experienced FAW on their maize plots crowded-
in and intensified the use of insecticides. This is an additional cost to farmers
in addition to maize yield loss indicated above. They increase the quantity of
insecticide use by about 38 per cent, although such measures have been shown
to be ineffective in minimising the adverse effects of FAW on maize yield.
According to our results, FAW control measures, when applied individually
– including the application of chemicals – are not effective. However, the
adoption of a combination of chemical and manual treatments (handpicking
and killing) as well as ash and manual treatments by individual farmers
played a mitigating role in combatting an infestation compared with employing18 M. Kassie et al.
no control strategy at all. This highlights the importance of understanding
how and where FAW control measures applied by the individual farmer can
perform well. In terms of the role that institution plays in ensuring farming
Downloaded from https://academic.oup.com/erae/advance-article-abstract/doi/10.1093/erae/jbz048/5698630 by guest on 07 May 2020
success, namely farmers have access to the advice of bodies that provide
extension services, we find insignificant effects. This result suggests either
that access to such services is not important in the control of this pest,
or that existing agricultural extension institution in the study area is not
sufficiently prepared or equipped to tackle the invasive species. However, it
became clear that farmers’ trust in extension officers’ advice, particularly on
the use of FAW control strategies, played a key role in abating yield losses
due to FAW.
The current study has some limitations, however. First, we only use cross-
sectional data. Such data do not capture the dynamics of FAW infestation or
its impact over time. Cross-sectional data also do not measure any change
in the pest management practices exercised by farmers, institutions and the
government over time through learning by doing and by accessing information
on best practice. The extent of economic damage brought by the impact of
FAW infestations may decrease over time as knowledge about controlling the
pest increases. It is also worth mentioning that the data used for this study
were collected shortly after FAW first appeared in Ethiopia: institutions, the
government, and farmers alike were not ready to cope with its impact, nor were
they adequately informed about the pest’s behaviour or about what measures
to use to address the problem.
A second limitation of the study relates to respondents having been asked
about the type of control measure they had employed, but not about when – i.e.
at what stage of the insect’s growth – they had employed such measures or how
they used them. These aspects have repercussions on our estimates regarding
the effectiveness of control measures.
Third, although our estimates demonstrate the risk that FAW poses to
Ethiopia’s agriculture, the data presented in this study are not nationally
representative. A fourth limitation is that the study only considers the binary
incidence of FAW infestation: it ignores the intensity of infestation that can
result in heterogeneity impacts. Future studies aimed at closing these and other
gaps would assist in the more effective allocation of scarce resources to control
the pest.
Acknowledgements
Funding for this research was provided by USAID Feed the Future IPM
Innovation Lab, Virginia Tech (Agreement No. AID-OAA-L-15-00001) and
the Integrated Pest Management strategy to counter the threat of invasive fall
armyworm to food security in eastern Africa (FAW-IPM) project funded by
EU (Grant Number: DCI-FOOD/2018/402-634). We also acknowledge the
International Centre of Insect Physiology and Ecology (icipe) core support
provided by the United Kingdom’s Department for International Development
(DFID), the Swedish International Development Cooperation Agency (Sida),Economic impacts of fall armyworm and its management strategies 19
the Swiss Agency for Development and Cooperation (SDC), Germany’s Fed-
eral Ministry for Economic Cooperation and Development (BMZ) and the
Kenyan Government. We also thank Jackson Kimani of icipe for generating
Downloaded from https://academic.oup.com/erae/advance-article-abstract/doi/10.1093/erae/jbz048/5698630 by guest on 07 May 2020
the map of the study area, the enumerators and supervisors for their dedication
in conducting the fieldwork, the farmers for their time, the icipe Ethiopia office
staff for providing logistical support for the fieldwork and Sandie Fitchat for
language editing. The views expressed here are those of the authors and do
not necessarily reflect the views of the donors or the authors’ institutions. The
usual disclaimers apply.
References
Abate, T., Shiferaw, B., Menkir, A. et al. (2015). Factors that transformed maize productivity
in Ethiopia. Food Security, 7(5): 965–81.
Assunção, J. J. and Braido, B. H. L. (2004). Testing among competing explanations
for the inverse productivity puzzle. http://www.econ.puc-rio.br/PDF/seminario/2004/
inverse.pdf. Accessed November 2004
Baudron, F., Zaman-Allah, M. A., Chaipa, I. et al. (2019). Understanding the factors influ-
encing fall armyworm (Spodoptera frugiperda JE Smith) damage in African smallholder
maize fields and quantifying its impact on yield. A case study in Eastern Zimbabwe. Crop
Protection. 120: 141–150. doi: 10.1016/j.cropro.2019.01.028.
Beemer, L. (2018). Fall armyworm a serious threat to sub-Saharan African food security in
2018. https://www.agribusinessglobal.com/markets/africa-middle-east/fall-armyworm-
a-serious-threat-to-sub-sarahan-african-food-security-in-2018/ (Accessed 16th Febru-
ary 2019)
Burbidge, J. B., Magee, L. and Robb, A. L. (1988). Alternative transformations to handle
extreme values of the dependent variable. Journal of the American Statistical Association
83(401): 123–127.
Cameron, A., Gelbach, J. and Miller, D. (2008). Bootstrap-based improvements for inference
with clustered errors. Review of Economics and Statistics 90(3): 414–427.
CSA (Central Statistical Agency). (2017/2018). Agricultural Sample Survey 2017/2018, Vol.
1: Area and Production of Major Crops, main season 2018 Central Statistical Agency.
Federal Democratic Republic of Ethiopia, Addis Ababa.
Day, R., Abrahams, P., Bateman, M., et al. (2017). Fall armyworm: impacts and implications
for Africa. Outlooks on Pest Management 28(5): 196–201. doi: 10.1564/v28.
Denberg, H. V. and Jiggins, J. (2007). Investing in farmers – the impacts of farmer
field schools in relation to integrated Pest management. World Development 35(4):
663–686.
Dercon, C. and Gollin, D. (2014). Agriculture in African development: theories and
strategies. Annual Review of Resource Economics 6: 471–492.
Di Falco, S., Veronesi, M. and Yesuf, M. (2011). Does adaptation to climate change provide
food security? A micro-perspective from Ethiopia. American Journal of Agricultural
Economics 93(3): 829–846.
Fafchamps, M. (1993). Sequential labour decisions under uncertainty: an estimable house-
hold model of West Africa farmers. Econometrica 61(5): 1173–1197.
Hailu, G., Niassy, S., Khan, R. Z., et al. (2018). Maize–legume intercropping and push–pull
for management of fall armyworm, stemborers, and striga in Uganda. Agronomy Journal
110: 1–10.20 M. Kassie et al.
Kassie, M., Stage, J., Diiro, G., et al. (2018). Push–pull farming system in Kenya: impli-
cations for economic and social welfare. Land\ignorespacesUse\ignorespacesPolicy 77:
186–198.
Downloaded from https://academic.oup.com/erae/advance-article-abstract/doi/10.1093/erae/jbz048/5698630 by guest on 07 May 2020
Kassie, M., Teklewold, H., Marenya, P., et al. (2015). Production risks and food security
under alternative technology choices in Malawi: application of a multinomial endogenous
switching regression. Journal of Agricultural Economics 66(3): 640–659.
Kassie, M. and Holden, S. T. (2007). Sharecropping efficiency in Ethiopia: threats of eviction
and kinship. Agricultural economics 37: 179–188.
Khan, Z. R., Midega, C. A. O., Pittchar, J. O., et al. (2014). Achieving food security for one
million sub-Saharan African poor through push–pull innovation by 2020. Philosophical
Transactions of the Royal Society B: Biological Sciences 369(1639): 1–11.
Kumela, T., Simiyu, J., Sisay, B., et al. (2018). Farmers’ knowledge, perceptions, and
management practices of the new invasive pest, fall armyworm (Spodoptera frugiperda)
in Ethiopia and Kenya. International Journal of Pest Management. 65(1):1–9. doi:
10.1080/09670874.2017.1423129.
Levinsohn, J. and Petrin, A. (2003). Estimating production functions using inputs to control
for unobservables. Review of Economic Studies 70: 317–341.
Marenya, P., Kassie, M., Jaleta, M. D., et al. (2016). Maize market participation among
female- and male-headed households in Ethiopia. The Journal of Development Studies
53(4): 484–491.
Midega, C. A. O., Pittchar, J. O., Pickett, J. A., et al. (2018). A climate-adapted push–pull
system effectively controls fall armyworm, Spodoptera frugiperda (JE Smith), in maize
in East Africa. Crop Protection 105(March): 10–15. doi: 10.1016/j.cropro.2017.11.003.
Midingoyi, S.-K. G., Kassie, M., Muriithi, B., et al. (2018). Do farmers and the environment
benefit from adopting integrated pest management practices? Evidence from Kenya.
Journal of Agricultural Economics 70(2): 452–470. doi: 10.1111/1477-9552.12306.
Muricho, G., Kassie, M., Marenya, P., et al. (2017). Cross country report for adoption
pathways 2013 survey. CIMMYT working Paper.
Pickett, A. J., Woodcock, C. M., Midega, C. A. O., et al. (2014). Push–pull farming systems.
Current Opinion in Biotechnology 26: 125–132.
Rwomushana, I., Bateman, M., Beale, T., Beseh, P., et al. (2018). Fall armyworm: impacts
and implications for Africa. Evidence note update. https://www.invasive-species.
org/Uploads/InvasiveSpecies/FAW%20Evidence%20Note%20October%202018.pdf.
Accessed 16 February 2019).
Teklewold, H., Kassie, M., Bekele, S., et al. (2013). Cropping systems diversification,
conservation tillage and modern seed adoption in Ethiopia: impacts on household
income, agrochemical use and demand for labor. Ecological Economics 93: 85–93.
VIB (International Plan Biotechnology Outreach). (2019). Maize in Africa. http://www.vib.
be/en/about-vib/Documents/VIB_MaizeInAfrica_EN_2017.pdf. Accessed 6 February
2019.
Wossen, T., Abdoulaye, T., Alene, A., et al. (2017). Measuring the impacts of adaptation
strategies to drought stress: the case of drought tolerant maize varieties. Journal of
Environmental Management 203: 106–113.
Wossen, T., Abdoulaye, T., Alene, A., et al. (2019). Estimating the productivity impacts of
technology adoption in the presence of misclassification. American Journal of Agricul-
tural Economics 101(1): 1–16.Economic impacts of fall armyworm and its management strategies 21
Annex A: Tables with full regression results for all out-
come indicators
Downloaded from https://academic.oup.com/erae/advance-article-abstract/doi/10.1093/erae/jbz048/5698630 by guest on 07 May 2020
Table 1A. Maize yield estimation, kg/ha
Pooled OLS Pooled OLS Fixed effects Fixed effects
(FE) (FE)
Fall armyworm −0.124∗∗∗ −0.123∗∗ −0.095∗∗∗ −0.122∗∗
(0.019) (0.049) (0.035) (0.053)
Use of ash −0.035 0.018
(0.051) (0.062)
Use of chemicals −0.008 −0.100∗
(0.048) (0.059)
Handpicking 0.056 −0.006
(0.044) (0.067)
Chemical + handpicking −0.076 −0.107
(0.054) (0.110)
Chemical + ash −0.005 0.024
(0.077) (0.120)
Handpicking + ash 0.083 0.068
(0.077) (0.097)
Stemborer infestation −0.012 0.051
(0.027) (0.041)
Other shocks −0.117∗∗∗ −0.117∗∗∗
(0.024) (0.030)
Urea use 0.018∗∗ −0.004
(0.008) (0.014)
DAP use 0.031∗∗ 0.023
(0.015) (0.017)
Seed quantity 0.364∗∗∗ 0.492∗∗∗
(0.037) (0.036)
Ploughing frequency 0.007 0.064∗
(0.020) (0.034)
Weed frequency 0.012 −0.031
(0.017) (0.033)
Labour use 0.044∗∗ −0.006
(0.018) (0.035)
Herbicide use −0.053 0.087
(0.058) (0.100)
Manure use 0.017 0.005
(0.021) (0.022)
Irrigation 0.042 0.015
(0.074) (0.066)
Maize–legume 0.052∗∗∗ 0.021
intercropping
(0.016) (0.020)
Medium soil fertility 0.012 −0.046∗
(0.015) (0.027)
(Continued)22 M. Kassie et al.
Table 1A. Continued
Downloaded from https://academic.oup.com/erae/advance-article-abstract/doi/10.1093/erae/jbz048/5698630 by guest on 07 May 2020
Pooled OLS Pooled OLS Fixed effects Fixed effects
(FE) (FE)
Poor soil fertility −0.147∗ −0.234∗∗∗
(0.076) (0.062)
Medium slope −0.003 −0.048∗
(0.020) (0.028)
Steep slope −0.047 0.055
(0.081) (0.068)
Medium depth 0.034 −0.047
(0.028) (0.039)
Deep depth 0.091∗∗∗ −0.080∗
(0.025) (0.044)
Plot distance from −0.000∗∗ −0.000∗
homestead
(0.000) (0.000)
Tenure security 0.079∗∗ 0.065∗∗
(0.032) (0.032)
Sex 0.089∗∗ 0.000
(0.040)
Age −0.024
(0.048)
Household size 0.011∗
(0.007)
Education 0.010∗∗∗
(0.002)
Distance to extension 0.011
(0.015)
Mobile phone ownership 0.071∗∗
(0.032)
Farm size −0.080∗∗∗
(0.020)
Livestock ownership 0.033∗∗∗
(0.011)
Distance from market −0.009
(0.020)
Altitude −0.118
(0.089)
Location dummies No Yes NA NA
R2 0.019 0.313 0.79 0.838
N 2,219 2,219 2,219 2,219
Notes: standard errors, wild bootstrapped at the kebele level are reported in parentheses. ∗ p < 0.10, ∗∗ p < 0.05,
∗∗∗ p < 0.01.You can also read