Tunneling a crosstown highway: a natural experiment testing the longitudinal effect on physical activity and active transport
←
→
Page content transcription
If your browser does not render page correctly, please read the page content below
Stappers et al. International Journal of Behavioral Nutrition and Physical Activity
    (2021) 18:111
https://doi.org/10.1186/s12966-021-01180-1

 RESEARCH                                                                                                                                           Open Access

Tunneling a crosstown highway: a natural
experiment testing the longitudinal effect
on physical activity and active transport
Nicole E. H. Stappers1* , Jasper Schipperijn2, Stef P. J. Kremers1, Marleen P. M. Bekker3,4, Maria W. J. Jansen3,5,
Nanne K. de Vries1,6 and Dave H. H. Van Kann1,7

  Abstract
  Background: In the city of Maastricht in the Netherlands, a highway crossing several deprived neighborhoods was
  tunneled in 2016. The vacant space on top of this tunnel was redesigned and prioritized for pedestrians and
  cyclists. The aim of this study was to evaluate the effect of this major infrastructural change, named the Green
  Carpet, on total and transport-based physical activity (PA) levels.
  Methods: Participants (≥18 years) were part of one of three area-based exposure groups. The maximal exposure
  group lived in neighborhoods directly bordering the Green Carpet. The minimal exposure group consisted of
  individuals living at the other side of the city, and the no exposure group consisted of individuals living in a nearby
  city. Actual use of the new infrastructure was incorporated as a second measure of exposure. Data were collected
  before and 3-15 months after the opening of the Green Carpet. Device-based measurements were conducted to
  obtain PA levels and collect location data. Changes in PA over time and intervention effects were determined using
  linear mixed models.
  Results: PA levels in the Green Carpet area increased for the maximal and minimal exposure groups, but did not
  lead to an increase in total or transport-based PA. For the no exposure group, transport-based MVPA decreased and
  transport-based SB increased. The significant interaction (time x exposure) for transport-based SB, indicated
  differences in trends between the no exposure and maximal exposure group (B=-3.59, 95% CI - 7.15; -0.02) and
  minimal exposure group (B= -4.02, 95% CI -7.85, -0.19). Trends in the results based on analyses focusing on actual
  use and non-use of the new infrastructure were similar to those of the area-based analyses.
  Conclusions: Results suggest that the Green Carpet led to more PA in this specific area, but did not increase the
  total volume of PA. The area-based differences might reflect the differences between users and non-users, but we
  should be careful when interpreting these results, due to possible interference of selective mobility bias. This paper
  reflects that the relationship between infrastructure and PA is not unambiguous.
  Trial registration: This research was retrospectively registered at the Netherlands Trial Register (NL8108).
  Keywords: Infrastructural change, built environment, physical activity, active transport, global positioning systems
  (GPS)

* Correspondence: Nicole.stappers@maastrichtuniversity.nl
1
 Department of Health Promotion, Maastricht University, NUTRIM School of
Nutrition and Translational Research in Metabolism, P. Debyeplein 1, 6229HA,
Maastricht, The Netherlands
Full list of author information is available at the end of the article

                                        © The Author(s). 2021 Open Access This article is licensed under a Creative Commons Attribution 4.0 International License,
                                        which permits use, sharing, adaptation, distribution and reproduction in any medium or format, as long as you give
                                        appropriate credit to the original author(s) and the source, provide a link to the Creative Commons licence, and indicate if
                                        changes were made. The images or other third party material in this article are included in the article's Creative Commons
                                        licence, unless indicated otherwise in a credit line to the material. If material is not included in the article's Creative Commons
                                        licence and your intended use is not permitted by statutory regulation or exceeds the permitted use, you will need to obtain
                                        permission directly from the copyright holder. To view a copy of this licence, visit http://creativecommons.org/licenses/by/4.0/.
                                        The Creative Commons Public Domain Dedication waiver (http://creativecommons.org/publicdomain/zero/1.0/) applies to the
                                        data made available in this article, unless otherwise stated in a credit line to the data.
Stappers et al. International Journal of Behavioral Nutrition and Physical Activity (2021) 18:111 Page 2 of 12 Background the effects of major infrastructural changes on the PA The detrimental effects of physical inactivity on non- behavior of adults using both GPS and accelerometry communicable diseases have been widely studied and are lacking. the results highlight the need to increase population- In the city of Maastricht in the Netherlands, a highway wide physical activity (PA) levels in order to improve crossing several deprived neighborhoods was tunneled in public health and decrease healthcare costs [1, 2]. Ac- 2016 and the vacant space on top of this tunnel was pri- cording to socioecological models, PA behavior is af- oritized for pedestrians and cyclists. The tunneling of fected by personal, socioeconomic, environmental, and this highway has led to a noise reduction of between 5 policy factors [3]. Thus, to increase population-wide PA and 20 dB (depending on the exact location) and a de- levels, national and local governments should focus on crease in the amount of nitrogen and particulate matter more structural changes at the environmental, policy, in the area [22]. Besides air quality, the tunneling also and societal levels [4]. In recent years, several large- provided the opportunity to evaluate the effect on PA scale, multi-city studies investigated the potential of the behavior. The aim of this study was to evaluate the effect built environment to affect population-wide PA levels of tunneling a highway on the overall PA and transport- [5–7]. Based on recent systematic reviews, it can be con- based PA of people living in the vicinity of this major cluded that changes in the built- and natural environ- infrastructurally changed area, called The Green Carpet, ments can lead to changes in PA levels of adults, and compared to individuals living further away within the especially to changes in active transport (AT), i.e. walk- same city, and individuals living in another city in the ing and cycling for transport [8–11]. Moreover, AT same region. A second aim of this study was to explore might result in additional health benefits over vehicle- the differences in PA for individuals that actually used based transport, such as the reduction of the emission or did not use the Green Carpet. This is the first large- of, and exposure to, air pollution, and the improvement scale evaluation to use individual-level device-based of neighborhoods’ livability by lowering the amount of measurements of both PA and location in adults. motorized traffic [12, 13]. Although existing systematic reviews identified rela- tionships between the environment and some types of Methods physical activity behavior, the evidence remains incon- The project: Green Carpet clusive. One of the main issues is that the available evi- Since its opening in 1959, the highway A2 crosses dence differs in measuring methods, quality and residential areas in the east of the city of Maastricht. contexts. More longitudinal, context-specific research is Due to the enormous increase in traffic over time, needed to unravel the mechanisms that play a role in the burden on the residents of these areas also in- the relationship between the environment and behavior creased over time. Therefore, a double-layered tunnel [14]. From previous research, we know that exposure to was built to facilitate the traffic passing through the a new or redesigned infrastructure might increase the city (www.mijngroeneloper.nl/het-plan/information- chance of engaging in AT [15]. However, exposure can english). To accommodate the remaining local traffic be defined in various ways. Measures of exposure might in the areas on top of the tunnel, two one-way streets be area-based, mostly consisting of administrative spatial were constructed. These one-way streets were sepa- boundaries, whereby exposure is treated as living in a rated by a semi-paved middle section, prioritized for specific area [16]. As exposure might vary within geo- use by pedestrians, cyclists and for recreation. This graphical areas, some studies use proximity (e.g. length middle section was separated from the adjacent or travel duration) as a continuous or ordinal measure streets by wide strips of grass and trees, creating the of exposure [17, 18]. However, this approach assumes so-called ‘Green Carpet’. The Green Carpet has a that the proximity of the home location to a specific en- length of 2.3 kilometers. The semi-paved middle sec- vironment is central to classify exposure to this environ- tion has a width of about 6 meters, while the entire ment [16]. Over the past decade, GPS-based approaches profile of the middle section, the strips with greenery have increasingly been used to assess the actual exposure and adjacent one-way streets is about 30 meters in to a certain area, by combining GPS and geographical width The Green Carpet was officially opened in information systems (GIS). Following this trend, an in- spring 2018, but constructions of houses and facilities creasing number of studies combine device-based loca- will continue up until 2026. Images of the interven- tion measurements with device-based PA measurements tion area before and after the opening of the Green [19, 20]. This type of measurements prevents inconsist- Carpet can be found in the supplementary material encies that typically occur when using self-reported PA (Figure S1 and S2). Details about the origin and con- measurements, such as inaccurate reporting and report- text of the Green Carpet project have been described ing bias [21]. However, large-scale evaluations exploring elsewhere [23].
Stappers et al. International Journal of Behavioral Nutrition and Physical Activity   (2021) 18:111                           Page 3 of 12

Study design and participants                                                 which is an updated version of the Personal Activity and
This study used data from a non-randomized natural ex-                        Location Measurement System (PALMS) [25]. the GPS
periment. Natural experiments are alternatives to RCTs                        and accelerometry data were processed and filtered in
in cases in which it is practically or ethically impossible                   HABITUS. Freedson’s cut points (1998) were applied to
to manipulate exposure to an intervention, such as                            distinguish sedentary behavior (SB; 100 activity
this study were adult (≥18 years) inhabitants of Maas-                        counts per minute) from moderate-to-vigorous physical
tricht and Heerlen, two cities in the South-Limburg re-                       activity (MVPA; >1952 counts per minute) [26].
gion of the Netherlands, which have about 120,000 and                           Invalid GPS data points were identified based on ex-
100,000 inhabitants, respectively. Individuals who were                       treme changes in speed (>130 km/hour) and elevation
not able to walk without walking aids or were not able                        (1000m) between two epochs. Data points were distin-
to fill out a Dutch questionnaire were excluded from                          guished as ‘stationary’ points, and points that were re-
participation. Eligible participants were recruited via so-                   corded during a trip. Activity was classified as a trip if
cial media, posters, flyers at supermarkets and local                         the distance traveled was at least 100 meters and the
events, advertisements in local and regional newspapers,                      duration exceeded 120 seconds. A stop of at least 120
and via personalized mailings to a random sample of the                       seconds at one location was marked as a pause point
inhabitants.                                                                  and a pause of more than 180 seconds was marked as
  Baseline measurements of the experiment were per-                           the endpoint of a trip. Periods of at least 60 minutes of
formed before the opening of the Green Carpet, between                        zeros were classified as non-wear time and excluded from
September 2016 and June 2017. The follow-up measure-                          the analyses. The transport classification algorithm had a
ment was conducted between September 2018 and June                            minute-level sensitivity of 88.5%, a specificity of 93.4%,
2019. Participants were measured in approximately the                         and a positive predictive value of 74.9% [25]. The device-
same week of the year at baseline and during the 2-year                       based measurements were considered valid if there were
follow-up. On average, the time between the opening of                        at least four days, regardless of week or weekend days,
the Green Carpet and the follow-up measurement of the                         with a minimal wear time of 8 hours per day [27].
individuals in Maastricht was 9.8 months (median: 10.5                          The HABITUS output was entered into a purpose-
months, range: 3-15 months).                                                  built PostgreSQL geodatabase which was used to assign
  The Maastricht University Medical Center (MUMC+)                            datapoints to pre-defined contexts or domains. In this
medical ethics committee reviewed the study protocol                          process, datapoints were hierarchically assigned and cat-
and concluded that formal ethical approval was not re-                        egorized as being in the home domain, the work domain,
quired (METC 16-4-109). All participants provided writ-                       on the Green Carpet (Fig. 1) or in the transport domain.
ten informed consent. The study is registered at the                          Outcomes in this study are the percentage of SB, LPA
Netherlands Trial Register (NL8108).                                          and MVPA of the total wear time, the percentage of
                                                                              transport-based SB, LPA and MVPA and the percentage
Procedures                                                                    of SB, LPA and MPVA at the Green Carpet.
PA levels and location data were collected using device-
based measurements, by the Actigraph GT3X+ activity                           Measures of exposure
monitor (Actigraph, Pensacola, FL, USA) and the Qstarz                        Participants belonged to one of the area-based exposure
BT-Q1000XT GPS logger (Qstarz International Com-                              groups, based on the distance of their residential area to
pany, Taipei, Taiwan). Participants were instructed to                        the Green Carpet area. The ‘maximal exposure’ group
wear both devices on an elastic belt on the right hip, for                    consisted of individuals that lived in the neighborhoods
seven consecutive days at daytime only. Devices were re-                      directly bordering the Green Carpet, situated at the East
moved during activities involving water, i.e. swimming                        side of the city center (Fig. 1; Dark green; East Maas-
and showering, and overnight, when the participant                            tricht, South-East Maastricht). The expected exposure to
charged the GPS logger.                                                       the Green Carpet, was largest in this group. The ‘min-
   Raw accelerometry data (30 Hz) of the vertical axis                        imal exposure’ group consisted of inhabitants of Maas-
were downloaded into Actilife version 6.11.7 (Actigraph,                      tricht who lived on the western side of the river Meuse
Pensacola, FL, USA) and converted to activity counts for                      and outside the city center (Fig. 1; light green). Partici-
60-second epochs. GPS data were downloaded using                              pants from these neighborhoods (West Maastricht,
Qtravel software version 1.52.000 (Qstarz International                       North-West Maastricht, South-West Maastricht), might
Company, Taipei, Taiwan) in epochs of 10 seconds.                             visit the Green Carpet area, but are less likely to be ex-
Accelerometry and GPS data were merged into 60-                               posed to this area. Individuals living in the ‘no exposure’
second epochs using the Human Activity Behavior Iden-                         area were inhabitants of the city of Heerlen. Participants
tification Tool and data Unification System (HABITUS),                        of this group were not expected to be exposed to the
Stappers et al. International Journal of Behavioral Nutrition and Physical Activity (2021) 18:111 Page 4 of 12
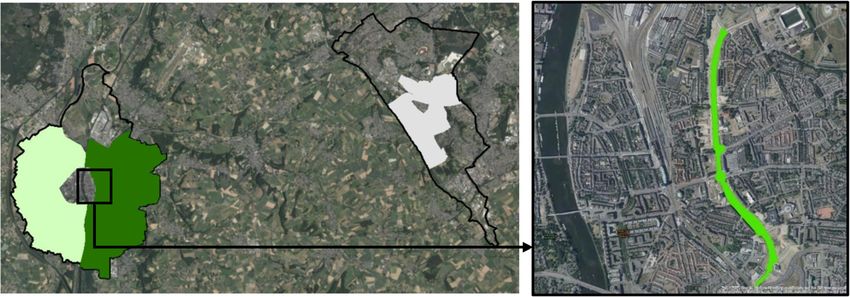
Fig. 1 Area-based exposure groups and Green Carpet Area. Left: no exposure (white), minimal exposure (light green) and maximal exposure (dark
green) areas in Maastricht and Heerlen. Right: 2.3 km Green Carpet on top of the A2 highway tunnel. Map: Source: Esri, DigitalGlobe, GeoEye,
Earthstar Geographics, CNES/Airbus DS, USDA, USGS, AeroGRID, IGN, and the GIS User Community.
Green Carpet because they lived approximately 25 kilo- Statistical analyses
meters away from the Green Carpet. Heerlen was se- Descriptive statistics were used to describe and compare
lected as comparison area because the selected the baseline characteristics of the participants in the
neighborhoods in this city are comparable to Maastricht three groups of the experiment. To explore possible
with regard to the number of inhabitants, urbanization baseline differences and conduct dropout analyses, we
and the geographical and cultural context. performed T-tests and Chi-square tests on all covariates.
Secondly, for all participants, the actual use of the Normality was assumed based on the skewness and
Green Carpet area was determined using GPS data, the kurtosis of the outcome measures. As mixed models
whereby, for the participants of all three area-based are able to handle missing data in a longitudinal dataset
groups, the use was defined and dichotomized to 0 (did when the covariates are present, changes in outcomes
not use Green Carpet area) and 1 (used Green Carpet over time and intervention effects were determined
area) at follow-up. using linear mixed models. Also, linear mixed models
have the option to account for repeated measures within
the individual. For each outcome, we first explored for
Covariates each group the within-group changes by using time as a
A questionnaire was distributed at baseline and fixed factor in the model, while only accounting for re-
follow-up to assess sociodemographic characteristics, peated measures within persons. Next, an unadjusted
including gender (0= male, 1= female), age, educa- model was created by adding an exposure group vari-
tional level (recoded into 0= lower educated, 1 = able, accompanied by the interaction term between time
higher educated, for individuals with higher profes- x area-based exposure group. Lastly, a fully adjusted
sional education or higher), work status (recoded into model was tested using the unadjusted model, supple-
0= not working, 1= working) and car ownership mented with the covariates described above: age, gender,
(recoded into 0= no car available in household, 1= educational level, work status, car-ownership, and scores
one or more cars available in household). Also, on EQ-5D. Sensitivity tests were conducted to validate
health-related quality of life was assessed using the the results with data of individuals that provided
EQ-5D-3L questionnaire [28]. For each of the five do- complete cases at both baseline and follow-up. Addition-
mains of this questionnaire (mobility, self-care, daily ally, we further explored the differences in PA behavior
activities, pain and mood) we created a dummy vari- between individuals that actually used the new infra-
able for individuals experiencing no problems (0) or structure and individuals that did not, defined based on
any/severe problems (1) in a specific domain. their GPS data. In these analyses, only individuals with
All study materials were distributed from local com- valid data on both measurement moments were in-
munity centers, and after the 7-day data collection cluded. All statistical analyses were performed in SPSS
period ended, a member of the research team visited the version 24.0.0.2 (IBM Corp., Armonk, NY, USA) using a
participants at home to collect the materials. p-value of 0.05 as threshold for significance in all tests.Stappers et al. International Journal of Behavioral Nutrition and Physical Activity (2021) 18:111 Page 5 of 12
Results T0 and T1 (B=1.05, 95% CI 0.08; 2.01, p=.034), relating
At baseline, 757 participants were recruited, of which to 8.79 minutes per day. In contrast, for the minimal ex-
642 provided valid data at T0 and 362 provided valid posure group, the percentage of time spent in MVPA
data at both T0 and T1. decreased significantly (B=-0.65, 95% CI -1.11; -0.20, p=
.005). No changes were observed in the no exposure
Participants’ characteristics group. The wear time spent in transport ranged between
At baseline, participants were on average 56.3 years old. 2.38 and 2.62 hours per day at baseline, and between
The minimal exposure group was significantly older 2.40 and 2.45 hours per day at follow-up. For the min-
compared to the no exposure group (Table 1). About imal exposure group, the wear time in transport de-
half of the sample were male and about half of the sam- creased significantly (B=-0.18 95% CI 0.35; -0.01, p=
ple higher educated. Also, 54.8% of the participants were .038). For the percentage of time in transport spent in
in employment, while the other 45.2% were retired or SB, LPA and MVPA, a significant increase in SB and de-
unemployed. Most of the participants had at least one crease in MVPA was found for the no exposure group
car in their household. (B=4.67, 95% CI 2.00; 7.34, p=.001, and B= -2.80, 95% CI
Dropout analyses on the participants’ characteristics -5.00; -0.60, p=.013, respectively). In absolute numbers,
showed some selective dropout at the no exposure group this relates to an average increase of 7.3 minutes per day
for educational level (χ2=8.325, p=.004). Also, in the of SB in transport, and an average decrease of 3.8 mi-
minimal exposure and no exposure group, the percent- nutes per day of MVPA in transport. No changes were
age of individuals reporting any/severe problems regard- observed for the minimal and maximal exposure groups.
ing mood was higher in the group that dropped out at Sensitivity analyses on the complete cases of this sample
T1, compared to the longitudinal sample (minimal ex- demonstrated similar trends (Supplementary material,
posure group: χ2=5.031, p=.025, no exposure group: χ2= Table S1).
5.031, p=.040, respectively). Average wear time spent on the Green Carpet in-
creased significantly in the maximal exposure group
Changes in total and transport-based PA – area-based from 2.67 minutes per day at baseline to 3.22 minutes
exposure per day at follow-up. The percentage of time spent in
At baseline, the average wear time ranged between 13.96 MVPA increased significantly from 12.29% at baseline to
and 14.04 hours per day, and between 13.79 and 13.96 21.09% at follow-up (B=8.80, 95% CI 1.18; 16.14, p=
hours per day at follow-up (Table 2). The average num- .024). The percentage of wear time at the Green Carpet
ber of wearing days ranged between 5.78 and 6.40 days spent in SB decreased, but this change was not signifi-
at baseline and 5.64 and 6.34 at follow-up (data not cant. For the minimal exposure group, the average wear
shown). Within-group changes in wear time were not time spent on the Green Carpet was less than one mi-
significant. In the maximal exposure group, the percent- nute and did not change over time. The percentage SB
age of time spent in SB increased significantly between at the Green Carpet significantly decreased with 30%,
Table 1 Baseline characteristics of the sample
Total sample (n= Maximal exposure (n= Minimal exposure (n= No exposure (n=
642) 263) 179) 200)
Socio-demographics
Age (M (SD)) 56.3 (16.1) 54.7 (16.2) 60.9 (13.4)a 54.2 (17.2)
Gender (% male) 46.2 42.4 47.5 50.0
Educational level (% higher educated) 52.5 55.6 48.0 52.5
Work status (% working) 54.8 57.3 47.7 57.7
Car ownership (% ≥ 1 car) 87.1 82.8 91.6 88.9
Health-related quality of life
Mobility (% any or severe problems) 12.5 10.3 12.9 15.2
Self-care (% any or severe problems) 1.7 1.5 2.2 1.5
Daily activities (% any or severe 11.1 11.1 9.0 13.1
problems)
Pain (% any or severe problems) 31.7 30.5 32.8 32.3
Mood (% any or severe problems) 11.5 10.7 12.4 11.8
n Sample size, M Mean, SD Standard deviation; a significantly different to the no exposure group at baselineStappers et al. International Journal of Behavioral Nutrition and Physical Activity (2021) 18:111 Page 6 of 12
Table 2 Observed (unadjusted) means with time as fixed factor and corrected for repeated measures in persons
Total PA Maximal exposure Minimal exposure No exposure
n Mean B (95% CI) p n Mean B (95% CI) p n Mean B (95% CI) p
(SE) (SE) (SE)
Wear time (hrs/day) T0 263 13.96 179 14.04 200 13.96
(0.09) (0.10) (0.11)
T1 154 13.96 -0.01 (-0.23; .955 111 13.86 -0.18 (-0.43; 0.07) .157 97 13.79 -0.17 (-0.48; .279
(0.11) 0.21) (0.12) (0.16) 0.14)
% SB T0 263 63.63 179 64.29 200 64.30
(0.54) (0.65) (0.58)
T1 154 64.68 1.05 (0.08; .034 111 64.79 0.49 (-0.93; 1.92) .495 97 64.80 0.49 (-1.11; .544
(0.61) 2.01) (0.77) (0.82) 2.10)
% LPA T0 263 32.03 179 31.56 200 31.21
(0.52) (0.61) (0.58)
T1 154 31.26 -0.77 (-1.79; .135 111 31.71 0.16 (-1.20; 1.52) .818 97 30.78 -0.43 (-1.86; .548
(0.58) 0.24) (0.73) (0.74) 0.99)
% MVPA T0 263 4.33 179 4.15 200 4.48
(0.19) (0.23) (0.20)
T1 154 4.03 -0.30 (-0.76; .198 111 3.49 -0.65 (-1.11; .005 97 4.47 -0.01 (-0.51; .964
(0.24) 0.16) (0.24) -0.20) (0.27) 0.48)
Transport-based PA
Wear time in transport T0 263 2.50 179 2.62 200 2.38
(hrs/day) (0.06) (0.08) (0.07)
T1 154 2.45 -0.05 (-0.22; .572 111 2.44 -0.18 (-0.35; .038 97 2.40 0.02 (-0.14; .797
(0.08) 0.12) (0.08) -0.01) (0.09) 0.18)
% SB T0 263 48.01 179 49.62 200 45.57
(0.89) (1.05) (1.04)
T1 154 48.89 0.88 (-1.41; .448 111 50.00 0.38 (-2.08; 2.84) .760 97 50.24 4.67 (2.00; .001
(1.11) 3.17) (1.21) (1.36) 7.34)
% LPA T0 263 35.54 179 35.17 200 35.27
(0.73) (0.89) (0.84)
T1 154 35.57 0.03 (-1.71; .971 111 36.14 0.97 (-0.99; 2.93) .330 97 33.31 -1.96 (-4.14; .077
(0.81) 1.78) (1.02) (0.94) 0.21)
% MVPA T0 263 16.48 179 15.20 200 19.16
(0.79) (0.92) (1.02)
T1 154 15.49 -0.99 (-2.84; .251 111 13.92 -1.28 (-3.48; 0.92) .293 97 16.36 -2.80 (-5.00; .013
(0.92) 0.86) (1.11) (1.12) -0.60)
PA at Green Carpet
Wear time at Green T0 263 2.67 179 0.16 200 n.a.
Carpet (min/day) (0.80) (0.93)
T1 154 3.22 2.65 (0.12; .040 111 0.19 0.14 (-2.56; 2.85) .918 97 n.a. n.a. n.a.
(0.60) 5.19) (0.75)
% SB T0 263 47.73 179 71.70 200 n.a.
(4.38) (7.06)
T1 154 37.30 -10.43 .055 111 41.85 -29.85 (-49.57; .003 97 n.a. n.a. n.a.
(3.26) (-21.06; 0.21) (7.22) -10.13)
% LPA T0 263 39.89 179 16.14 200 n.a.
(3.76) (6.09)
T1 154 40.59 0.70 (-8.43; .880 111 50.15 34.01 (16.16; .000 97 n.a. n.a. n.a.
(3.24) 9.83) (7.15) 51.86)
% MVPA T0 263 12.29 179 12.63 200 n.a.
(3.09) (4.99)
T1 154 21.09 8.80 (1.18; .024 111 8.65 -3.99 (-18.79; .596 97 n.a. n.a. n.a.
(2.68) 16.41) (5.91) 10.81)
PA Physical activity, SB Sedentary behavior, LPA Light physical activity, MVPA Moderate-to-vigorous physical activity, n Sample size, SE Standard error, B Beta
coefficient, 95% CI 95% confidence interval, n.a. Not applicable, not enough cases to perform analysesStappers et al. International Journal of Behavioral Nutrition and Physical Activity (2021) 18:111 Page 7 of 12 from 71.07% to 41.85% (B=-29.85, 95% CI -49.57; -10.13, area of major infrastructural change and to compare it p=.003), and the amount of LPA increased with 34.01% with transport-based PA changes in individuals living (B=34.01, 95% CI 16.16; 51.86, p
Stappers et al. International Journal of Behavioral Nutrition and Physical Activity         (2021) 18:111                                         Page 8 of 12

 Fig. 2 Visual representation of the time x exposure group interaction for the transport-based SB outcome.

Table 4 Observed means with time as fixed factor and corrected for repeated measures in persons, comparison of users and non-
users the Green Carpet area
Total PA                              Users (n=108)                                                   Non-users (n=208)
                                      Mean (SE)             B (95% CI)                  p             Mean (SE)            B (95% CI)                     p
Wear time (hrs)            T0         14.35 (0.10)                                                    14.14 (0.10)
                           T1         14.11 (0.12)          -0.24 (-0.47; -0.01)        .040          13.87 (0.10)         -0.27 (-0.49; -0.06)           .011
% SB                       T0         63.32 (0.78)                                                    65.32 (0.55)
                           T1         64.44 (0.81)          1.11 (-0.00; 2.22)          .050          65.37 (0.60)         0.050 (-1.00; 1.10)            .925
% LPA                      T0         30.73 (0.53)                                                    32.25 (0.73)
                           T1         30.96 (0.56)          -0.85 (-1.95; 0.25)         .127          31.40 (0.76)         0.23 (-0.75; 1.21)             .644
% MVPA                     T0         4.43 (0.27)                                                     3.95 (0.21)
                           T1         4.17 (0.25)           -0.26 (-0.70; 0.18)         .241          3.67 (0.20)          -0.28 (-0.62; 0.059)           .105
Transport-based PA
  Wear time (hrs)          T0         2.63 (0.08)                                                     2.47 (0.07)
                           T1         2.55 (0.08)           -0.09 (-0.27; 0.10)         .347          2.42 (0.07)          -0.06 (-0.17; 0.06)            .343
  % SB                     T0         48.21 (1.42)                                                    49.14 (1.00)
                           T1         48.55 (1.34)          0.34 (-2.32; 3.00)          .802          50.72 (0.99)         1.58 (-0.38; 3.53)             .114
  % LPA                    T0         35.14 (1.08)                                                    34.63 (0.84)
                           T1         35.34 (1.01)          0.20 (-1.82; 2.22)          .847          34.83 (0.75)         0.20 (-1.42; 1.82)             .808
  % MVPA                   T0         16.65 (1.19)                                                    16.23 (0.94)
                           T1         16.12 (1.16)          -0.53 (-2.52; 1.45)         .596          14.46 (0.86)         -1.78 (-3.43; -0.12)           .035
PA at Green Carpet
  Wear time (min)          T0         2.50 (0.94)                                                     n.a.
                           T1         2.23 (0.45)           -0.27 (-1.53; 2.07)         .767          n.a.                 n.a.                           n.a.
  % SB                     T0         44.80 (5.11)                                                    n.a.
                           T1         37.83 (3.96)          -6.97 (-19.32; 5.39)        .266          n.a.                 n.a.                           n.a.
  % LPA                    T0         43.93 (4.42)                                                    n.a.
                           T1         42.93 (3.93)          -1.00 (-11.61 ; 9.60)       .851          n.a.                 n.a.                           n.a.
  % MVPA                   T0         11.22 (3.49)                                                    n.a.
                           T1         18.99 (3.29)          7.77 (-0.85; 16.39)         .077          n.a.                 n.a.                           n.a.
PA Physical activity, SB Sedentary behavior, LPA Light physical activity, MVPA Moderate-to-vigorous physical activity, SE Standard error, B Beta
coefficient, 95% CI 95% confidence interval, n.a. Not applicable, not enough cases to perform analyses
Stappers et al. International Journal of Behavioral Nutrition and Physical Activity (2021) 18:111 Page 9 of 12
Table 5 Estimates of time x exposure group in unadjusted and but our results did not suggest that this was an issue in
maximal adjusted linear mixed effects models our study. Further, the time x exposure interaction was
Total PA Unadjusted model Adjusted model* not significant. Thus, although there was a significant
Users vs. Non-users Users vs. Non-users decrease in transport-based PA in the non-visiting
B (95% CI) p B (95% CI) p group, the trend over time did not differ between users
% SB 1.06 (-0.59; 2.72) .206 1.19 (-0.51; 2.89) .169 and non-users of the Green Carpet. Moreover, the
changes in PA levels at the Green Carpet were of a same
% LPA -1.08 (-2.66; 0.49) .176 -1.24 (-2.86; 0.37) .130
magnitude compared to the area-based exposure groups,
% MVPA 0.02 (-0.55; 0.58) .948 0.05 (-0.53; 0.63) .865
but were not statistically significant. Remarkably, the
Transport-based PA average wear time while in the Green Carpet showed an
% SB -1.24 (-4.55; 2.07) .462 -0.76 (-4.20; 2.68) .664 opposite trend in the user groups, compared to the area-
% LPA -0.00 (-2.67; 2.66) .998 -0.49 (-3.26; 2.27) .726 based study groups. Probably, this is due to the in-
% MVPA 1.24 (-1.45; 3.94) .365 1.25 (-1.54; 4.05) .379 creased connectivity of the area and the removal of traf-
*adjusted for age, gender, educational level, work status, car ownership and
fic lights that caused major traffic jams.
health-related quality of life; PA Physical activity, SB Sedentary behavior, LPA Although we did not find increases in transport-based
Light physical activity, MVPA Moderate-to-vigorous physical activity, B Beta PA, we found that individuals in the exposed areas, on
coefficient, 95% CI 95% confident interval
average, did not decrease the amount of transport-based
MVPA, in contrast to the control area. In two systematic
Although the total and transport-based PA levels did reviews it was argued that, in general, studies were able
not increase over time, we found an 8% increase of to detect positive behavioral changes when the follow-up
MVPA on the Green Carpet. This implies that when measurement took place at least 6-12 months after the
participants were on the Green Carpet, they more often opening of the new infrastructure [8, 11]. In this study,
were moderate-to-vigorously active. As the Green Car- the average time between the opening of the Green Car-
pet was only a transport route at the time of follow-up, pet and the follow-up measurement was 9.8 months,
this increase in MVPA and the increase of time spent in with a median of 10.5 months. Therefore, more follow-
this area probably relates to an increase in brisk walking up measurements are necessary to investigate the
or cycling. For the minimal exposure group, we found a longer-term effects of this infrastructural change on PA
decrease in SB and increase of LPA on the Green Car- behavior. Since the construction of dwellings and facil-
pet. Given the distance to the Green Carpet and the PA ities is still ongoing until 2026 and the planted trees
levels of the participants of this group, this change might need time to grow to become a more attractive place for
indicate that the Green Carpet led to relatively less car leisure time PA, longer-term assessments are warranted.
use and more light-active forms of PA, such as cycling. In the current study, we focused on the general ef-
Hereby, the Green Carpet might act as a route for active fects of an infrastructural change to the built environ-
trips that were previously made using a car or public ment on PA, whereby we adjusted for several
transport. These results indicate that the Green Carpet covariates, but did not consider possible subgroup ef-
evokes behavioral changes at the Green Carpet, but this fects. As proposed by theoretical models, individual-
did not yet lead to additional PA. level socioeconomic, cultural and demographic char-
Lastly, we compared users and non-users of the Green acteristics might moderate the effect of the environ-
Carpet area. For individuals that used the Green Carpet, ment on PA [33]. Also, individuals’ perceptions of the
no changes were observed in transport-based PA, while environment might mediate this relationship between
in the non-user group, transport-based MVPA decreased environment and behavior, but this was not taken
by 1.8%. Although this difference is slightly smaller com- into account in this study [34]. Additional analyses
pared to the changes in area-based exposure groups, the are needed to further investigate the effects of
trends over time were comparable. This means that, pos- individual-level moderating and mediating factors.
sibly, the changes between the area-based groups might Strengths of this study are its longitudinal character,
reflect the differences between visiting and non-visiting/ large-scale device-based measurements, and the inclu-
using individuals. This would imply that living in a sion of sub analyses on users and nonusers of the Green
Green Carpet area prevented a decrease in transport- Carpet, next to area-based exposure measures. To our
based MVPA only for actual users. However, even knowledge, this is the first study on this scale that uses
though we adjusted for several covariates, more in-depth both GPS and accelerometers in a longitudinal approach
analyses are needed to reduce the possible influence of to investigate effects of an infrastructural project on PA
selective daily mobility bias in the use of the Green Car- behavior, which improves the validity and reliability of
pet [31]. Previous research showed that users of new in- studies into the relationship between environment and
frastructures might be the more active individuals [32], behavior.Stappers et al. International Journal of Behavioral Nutrition and Physical Activity (2021) 18:111 Page 10 of 12
An important limitation of this study is the possible and slow traffic did not significantly increase total or
misclassification of the datapoints that were classified as transport-based PA, within a year after opening in 2018.
‘in transport’. Giving the positive predictive value of However, the amount of transport-based MVPA showed
74.9%, the algorithm is slightly susceptible to false posi- a stable trend over time in the exposure groups, in con-
tives. This means that some of the 60-second time pe- trast to the control group. The percentage MVPA at the
riods might be classified as trips, while they are not [25]. Green Carpet area increased significantly for individuals
Another limitation of this study is the dropout of partici- from the maximal exposure group. For the minimal ex-
pants between baseline and follow-up measurements, posure group, the percentage of time spent in SB when
due to several reasons. The persons that dropped out being at the Green Carpet decreased, while LPA in-
spent slightly more time in MVPA at baseline. As these creased significantly. This implies that the PA patterns
models provide the opportunity to handle missing out- within the Green Carpet area changed over time, but did
come data based on valid covariates on baseline, these not yet lead to an increase in the total volume of PA. Al-
data emphasized the importance of using linear mixed though the results differed between the area-based ex-
models. However, sensitivity analyses showed that the posure and individual-level exposure analyses, the trends
findings were similar for the sample that contained only were similar for both analyses. This suggests that area-
complete baseline and follow-up measurements. Also, based differences might reflect the differences between
the percentage of people that were lower educated and users and nonusers of the Green Carpet. Due to possible
experiencing problems regarding mood was significantly interference of selective mobility bias, however, the re-
higher in the dropout group, compared to the longitu- sults should be interpreted carefully. Further, this paper
dinal sample. Thus, sensitivity analyses did not reveal reflects that the relationship between infrastructure and
significant differences in the outcome measures between PA is not unambiguous, as it depends on the context,
the dropout group and longitudinal sample, nor between and thereby interacts with the contextual factors in the
lower and higher educated individuals and people with larger ecosystem. Finally, to investigate longer-term ef-
or without problems regarding mood. fects, more research is needed.
Further, when interpreting the results of this study,
the relative nature of the data should be noted. The Abbreviations
average weartime of the devices was about 14 hours per PA: Physical activity; AT: Active transport; GPS: Global positioning systems;
GIS: Geographical information system; RCTs: Randomized controlled trials;
day, whereby consequently about 10 hours of the day HABITUS: Human Activity Behavior Identification Tool and data Unification
were not recorded. Although a significant part of these System; PALMS: Personal Activity and Location Measurement System;
hours is expected to be sleep time, these hours partially SB: Sedentary behavior; LPA: Light physical activity; MVPA: Moderate-to-
vigorous physical activity
consist of non-weartime during the day. In both cases,
we did not correct for this in the current analyses. Also,
as a day consists of 24 hours, an increase in the total Supplementary Information
The online version contains supplementary material available at https://doi.
time in one behavior (SB, LPA or MVPA) causes a de- org/10.1186/s12966-021-01180-1.
crease in the total time spent in on or more of the other
domains [35]. Compositional data analyses (CoDa) ac- Additional file 1.
counts for this codependency by handling a ‘time Additional file 2.
budget’ of 24 hours per day, of which time is allocated Additional file 3.
to specific behaviors or physical activity domains. Previ-
ous research has shown how this type of analyses might
Acknowledgements
help to further understand patterns of physical activity We thank Anke Verhees for her assistance in data collection.
behaviors during the day [36], or examine the combined
effects of sleep, SB, LPA and MVPA on health outcomes Authors’ contributions
[37]. Hereby, CoDa provides opportunities for future re- The study was conceived by SK, DVK and NDV. Data was collected by NS.
search. Lastly, the recruited group was older and higher The data analysis plan was created by DVK, JS and NS and data analyses
were performed by NS and JS. All authors contributed to interpreting the
educated than the total population in the selected areas. data, drafting, revising and approving the article.
Despite controlling for these covariates in the statistical
models, results might be less generalizable to a younger Funding
and lower educated sample. This work was funded by ZonMw (Project 531001316). The funding body did
not play a role in the design of the study, the data collection, analysis, and
interpretation or in writing the manuscript.
Conclusion
This study showed that tunneling a highway passing
Availability of data and materials
through residential areas of Maastricht city, and recon- The datasets generated during and/or analyzed during the current study are
structing the new open space in favor of non-motorized available from the corresponding author on reasonable request.Stappers et al. International Journal of Behavioral Nutrition and Physical Activity (2021) 18:111 Page 11 of 12
Declarations transportation and sedentary behavior - a systematic review. Health Place.
2018;53:135–49.
Ethics approval and consent to participate 12. Cepeda M, Schoufour J, Freak-Poli R, Koolhaas CM, Dhana K, Bramer WM,
The Maastricht University Medical Center (MUMC+) medical ethics et al. Levels of ambient air pollution according to mode of transport: a
committee reviewed the study protocol and concluded that formal ethical systematic review. Lancet Public Health. 2017;2(1):e23–34.
approval was not required (METC 16-4-109). All participants provided written 13. Mizdrak A, Blakely T, Cleghorn CL, Cobiac LJ. Potential of active transport to
informed consent. improve health, reduce healthcare costs, and reduce greenhouse gas
emissions: A modelling study. PLoS One. 2019;14(7):e0219316.
14. Mölenberg FJM, Panter J, Burdorf A, van Lenthe FJ. A systematic review of
Consent for publication
the effect of infrastructural interventions to promote cycling: strengthening
Not applicable.
causal inference from observational data. Int J Behav Nutr Phys Act. 2019;
16(1):93.
Competing interests 15. Crane M, Rissel C, Standen C, Ellison A, Ellison R, Wen LM, et al. Longitudinal
The authors declare that they have no competing interests. evaluation of travel and health outcomes in relation to new bicycle
infrastructure, Sydney, Australia. J Transport Health. 2017;6:386–95.
Author details 16. Humphreys DK, Panter J, Sahlqvist S, Goodman A, Ogilvie D. Changing the
1
Department of Health Promotion, Maastricht University, NUTRIM School of environment to improve population health: a framework for considering
Nutrition and Translational Research in Metabolism, P. Debyeplein 1, 6229HA, exposure in natural experimental studies. J Epidemiol Community Health.
Maastricht, The Netherlands. 2Research Unit for Active Living, Department of 2016;70(9):941–6.
Sports Science and Clinical Biomechanics, University of Southern Denmark, 17. Goodman A, Sahlqvist S, Ogilvie D. New walking and cycling routes and
Odense, Denmark. 3Department of Health Services Research, Maastricht increased physical activity: one- and 2-year findings from the UK iConnect
University, CAPHRI Care and Public Health Research Institute, Maastricht, The Study. Am J Public Health. 2014;104(9):e38–46.
Netherlands. 4Center for Space, Place and Society, Social Sciences Group, 18. Pazin J, Garcia L, Florindo A, Peres M, Guimarães A, Borgatto A, et al. Effects
Wageningen University, Wageningen, The Netherlands. 5Academic of a new walking and cycling route on leisure-time physical activity of
Collaborative Center for Public Health, Public Health Service South-Limburg, Brazilian adults: a longitudinal quasi-experiment. Health Place. 2016;39:18–
Heerlen, The Netherlands. 6Department of Health Promotion, Maastricht 25.
University, CAPHRI Care and Public Health Research Institute, Maastricht, The 19. Pritchard R, Bucher D, Frøyen Y. Does new bicycle infrastructure result in
Netherlands. 7Fontys University of Applied Sciences, School of Sport Studies, new or rerouted bicyclists? A longitudinal GPS study in Oslo. J Transp
Eindhoven, The Netherlands. Geogr. 2019;77:113–25.
20. Remmers T, Van Kann D, Kremers S, Ettema D, De Vries S, Vos S, et al.
Received: 12 February 2021 Accepted: 29 July 2021 Investigating longitudinal context-specific physical activity patterns in
transition from primary to secondary school using accelerometers, GPS, and
GIS. Int J Behav Nutr Phys Act. 2020;17:66.
References 21. Skender S, Ose J, Chang-Claude J, Paskow M, Brühmann B, Siegel E.
1. Ding D, Lawson KD, Kolbe-Alexander TL, Finkelstein EA, Katzmarzyk PT, Van Accelerometry and physical activity questionnaires – a systematic review.
Mechelen W, et al. The economic burden of physical inactivity: a global BMC Public Health. 2016;16:515.
analysis of major non-communicable diseases. Lancet. 2016;388(10051): 22. Atlas Living Environment. Geluid- en luchtkwaliteit sterk verbeterd in
1311–24. Maastricht na inrichting Groene Loper. 2019. https://www.atla
2. Lee IM, Shiroma EJ, Lobelo F, Puska P, Blair SN, Katzmarzyk PT. Effect of sleefomgeving.nl/nieuws/geluid-en-luchtkwaliteit-sterk-verbeterd-in-maa
physical inactivity on major non-communicable diseases worldwide: an stricht-na-inrichting-groene-loper. Accessed 11 Jan 2021.
analysis of burden of disease and life expectancy. Lancet. 2012;380(9838): 23. Stappers N, Van Kann D, Jansen M, Kremers S, de Vries N, Bekker M. The role
219–29. of context in evaluation studies: Lessons from a process evaluation of
3. Sallis JF, Owen N, Fisher EB. Ecological models of health behavior. In: Glanz integrating health in urban reconstruction. Environ Impact Assess Rev. 2020;
K, Rimer BK, Viswanath K, editors. Health behavior and health education: 82:106365.
Theory, research, and practice. Jossey-Bass; 2015. p. 465–85. 24. Craig P, Cooper C, Gunnell D, Haw S, Lawson K, Macintyre S, et al. Using
4. Rutter H, Bes-Rastrollo M, de Henauw S, Lahti-Koski M, Lehtinen-Jacks S, natural experiments to evaluate population health interventions: new
Mullerova D, et al. Balancing upstream and downstream measures to tackle medical research council guidance. J Epidemiol Community Health. 2012;66:
the obesity epidemic: a position statement from the european association 1182–6.
for the study of obesity. Obes Facts. 2017;10(1):61–3. 25. Carlson JA, Jankowska MM, Meseck K, Godbole S, Natarajan L, Raab F, et al.
5. Lakerveld J, Ben Rebah M, Mackenbach JD, Charreire H, Compernolle S, Validity of PALMS GPS scoring of active and passive travel compared to
Glonti K, et al. Obesity-related behaviours and BMI in five urban regions SenseCam. Med Sci Sports Exerc. 2015;47(3):662.
across Europe: sampling design and results from the SPOTLIGHT cross- 26. Freedson PS, Melanson E, Sirard J. Calibration of the Computer Science and
sectional survey. BMJ Open. 2015;5(10):e008505. Applications, Inc. accelerometer. Med Sci Sports Exerc. 1998;30(5):777–81.
6. Raser E, Gaupp-Berghausen M, Dons E, Anaya-Boig E, Avila-Palencia I, Brand 27. Wolff-Hughes DL, McClain JJ, Dodd KW, Berrigan D, Troiano RP. Number of
C, et al. European cyclists’ travel behavior: Differences and similarities accelerometer monitoring days needed for stable group-level estimates of
between seven European (PASTA) cities. J Transport Health. 2018;9:244–52. activity. Physiol Meas. 2016;37(9):1447–55.
7. Sallis JF, Cerin E, Conway TL, Adams MA, Frank LD, Pratt M, et al. Physical 28. EuroQolGroup. EuroQol - a new facility for the measurement of health-
activity in relation to urban environments in 14 cities worldwide: a cross- related quality of life. Health Policy. 1990;16(3):199–208.
sectional study. Lancet. 2016;387(10034):2207–17. 29. Heinen E, Panter J, Mackett R, Ogilvie D. Changes in mode of travel to work:
8. Mayne SL, Auchincloss AH, Michael YL. Impact of policy and built a natural experimental study of new transport infrastructure. Int J Behav
environment changes on obesity-related outcomes: a systematic review of Nutr Phys Act. 2015;12(1):1–10.
naturally occurring experiments. Obes Rev. 2015;16(5):362–75. 30. Milanović Z, Pantelić S, Trajković N, Sporiš G, Kostić R, James N. Age-related
9. Panter J, Guell C, Humphreys D, Ogilvie D. Can changing the physical decrease in physical activity and functional fitness among elderly men and
environment promote walking and cycling? A systematic review of what women. Clin Interv Aging. 2013;8:549–56.
works and how. Health Place. 2019;58:102161. 31. Chaix B, Méline J, Duncan S, Merrien C, Karusisi N, Perchoux C, et al. GPS
10. Smith M, Hosking J, Woodward A, Witten K, MacMillan A, Field A, et al. tracking in neighborhood and health studies: a step forward for
Systematic literature review of built environment effects on physical activity environmental exposure assessment, a step backward for causal inference?
and active transport - an update and new findings on health equity. Int J Health Place. 2013;21:46–51.
Behav Nutr Phys Act. 2017;14(1):158. 32. Goodman A, Sahlqvist S, Ogilvie D. Who uses new walking and cycling
11. Stappers N, Van Kann D, Ettema D, De Vries N, Kremers S. The effect of infrastructure and how? Longitudinal results from the UK iConnect study.
infrastructural changes in the built environment on physical activity, active Prev Med. 2013;57(5):518–24.Stappers et al. International Journal of Behavioral Nutrition and Physical Activity (2021) 18:111 Page 12 of 12
33. Alfonzo MA. To walk or not to walk? The hierarchy of walking needs.
Environ and Behav. 2005;37(6):808–36.
34. Kremers SPJ, de Bruijn GJ, Droomers M, van Lenthe F, Brug J. Moderators of
environmental intervention effects on diet and activity in youth. Am J Prev
Med. 2007;32(2):163–72.
35. Pedišić Ž. Measurement issues and poor adjustments for physical activity
and sleep undermine sedentary behaviour research—the focus should shift
to the balance between sleep, sedentary behaviour, standing and activity.
Kinesiology. 2014;46(1):135–46.
36. Foley L, Dumuid D, Atkin AJ, Olds T, Ogilvie D. Patterns of health behaviour
associated with active travel: a compositional data analysis. Int J Behav Nutr
Phys Act. 2018;15(1):1–12.
37. Chastin SF, Palarea-Albaladejo J, Dontje ML, Skelton DA. Combined effects
of time spent in physical activity, sedentary behaviors and sleep on obesity
and cardio-metabolic health markers: a novel compositional data analysis
approach. PloS One. 2015;10(10):e0139984.
Publisher’s Note
Springer Nature remains neutral with regard to jurisdictional claims in
published maps and institutional affiliations.You can also read