Tempering of cocoa butter and chocolate using minor lipidic components
←
→
Page content transcription
If your browser does not render page correctly, please read the page content below
ARTICLE
                  https://doi.org/10.1038/s41467-021-25206-1                 OPEN

                  Tempering of cocoa butter and chocolate using
                  minor lipidic components
                  Jay Chen        1,   Saeed M. Ghazani            1,   Jarvis A. Stobbs1,2 & Alejandro G. Marangoni                         1✉

                  Chocolate manufacture includes a complex tempering procedure to direct the crystallization
                  of cocoa butter towards the formation of fat crystal networks with specific polymorphism,
1234567890():,;

                  nano- and microstructure, melting behavior, surface gloss and mechanical properties. Here
                  we investigate the effects of adding various minor non-triglyceride lipidic components to
                  refined cocoa butter and chocolate on their physical properties. We discover that addition of
                  saturated phosphatidylcholine and phosphatidylethanolamine to neutralized and bleached
                  cocoa butter or molten and recrystallized commercial chocolate at 0.1% (w/w) levels, fol-
                  lowed by rapid cooling to 20 °C in the absence of shear, accelerates crystallization, stabilizes
                  the desirable Form V polymorph and induces the formation of chocolate with an optimal
                  microstructure, surface gloss and mechanical strength. Final chocolate structure and prop-
                  erties are comparable to those of a commercial tempered chocolate. Minor lipidic component
                  addition represents an effective way to engineer chocolate material properties at different
                  length scales, thus simplifying the entire tempering process.

                  1 Department of Food Science, University of Guelph, Guelph, ON, Canada. 2 Canadian Light Source Inc., Saskatoon, SK, Canada.
                  ✉email: amarango@uoguelph.ca

                  NATURE COMMUNICATIONS | (2021)12:5018 | https://doi.org/10.1038/s41467-021-25206-1 | www.nature.com/naturecommunications        1
ARTICLE NATURE COMMUNICATIONS | https://doi.org/10.1038/s41467-021-25206-1
C
ocoa Butter (CB), the fat extracted from the Theobroma significantly greater proportion of phospholipids compared to
cacao tree, composes close to 30% of chocolate, and many bulk CB crystals. They suggested that phospholipids, being
important characteristics of high-quality chocolate are amphipathic molecules, may play a role in the nucleation process
highly dependent on the crystalline structure of CB triacylgly- of TAGs, attributed to their ability to self-assemble into meso-
cerols (TAGs)1,2. CB TAGs have very complex crystallization morphic structures that would provide a surface upon which
behavior, and at least six distinct polymorphic forms are known TAGs could nucleate and grow6. Very few studies have focused
to exist. The triclinic Form V, also known as β2, is of particular on the effects of other minor components, such as MAGs.
interest to the chocolate-making industry due to its unique Chaiseri and Dimick suggested that the low concentration of
physical properties that impart the most preferable chocolate MAGs in CB may indicate that these components have little
quality characteristics. Chocolate structured by Form V CB has effect1. Similar to phospholipids, Müller and Careglio reported
the proper texture, gloss, snap, and melting profile, and exhibits varying effects of FFAs on the crystallization behavior of CB.
good thermal and bloom stability. However, attaining this form Their study indicated that FFAs generally retard crystal growth,
can be challenging or tedious, often demanding very specific and the degree of their effect depends on their concentration7.
tempering processes that include specific cooling rates, target This study aims to elucidate the effects of these minor com-
temperatures, and shear. ponents on CB crystallization and polymorphism and proposes
The effect of TAG composition on CB crystallization behavior the idea of utilizing these additives to engineer the solid state and
and polymorphism has been widely studied1,3,4. On the other hand, microstructure of CB and chocolate. The concentration of these
however, very little work has been carried out on the effects of CB minor components can be controlled through refining or by
minor components on this crystallization behavior and structure. direct addition. If minor components can be employed effectively
Although sometimes ambiguous, the term “minor components” to induce the formation of specific CB polymorphs, as well as
refers to non-TAG lipid molecules that are present in CB at levels of induce the formation of an optimal chocolate microstructure with
~3% or less, and include monoacylglycerols (MAGs), diacylglycer- desirable properties, the need for tempering chocolate could be
ols (DAGs), free fatty acids (FFAs), and phospholipids1. reduced or eliminated.
Variability in the content of minor components can be due to
geographical origins, post-harvest handling, and refining5. There
are currently only a few studies that focus on these minor com- Results and discussion
ponents, but the few that exist suggest that these can have a large Cocoa butter composition. Prior to any refining, the fatty-acid
impact on crystal structure and material properties1,6–9. Previous composition of the CB used in this study was determined by gas-
studies have shown that minor components can either promote liquid chromatography. The CB used in this study is mainly
or retard crystal nucleation and growth in a concentration- composed of stearic acid (37.3%), palmitic acid (25.4%), and oleic
dependent fashion. This can be due to these minor component acid (33.5%) (Supplementary Table 1), which closely matches
acting as nucleation sites, which promote crystallization, or typical literature values4. The phosphorus content of the unre-
potentially as poisons to crystal growth by blocking crystal fined CB is 88 ± 1 ppm, or 0.263 ± 0.004% equivalent phospha-
growth sites8. tides by weight (Supplementary Table 2), which is similar to the
Arruda and Dimick6 investigated the phospholipid content in 0.34 ± 0.07% reported by Arruda and Dimick6. After refining, the
CB seed crystals, finding that these seed crystals contained a phospholipids are completely removed from the CB. The FFA
content of the unrefined CB is 1.65 ± 0.01% (as oleic acid)
Fig. 1 Powder X-ray diffraction patterns and differential scanning calorimetric traces (inset) of unrefined native CB, refined CB, and refined CB with
added minor lipidic components. Samples included a unrefined native CB, b refined CB, c refined CB with added 0.1% (w/w)
dimyristoylphosphatidylcholine, and d refined CB with added 0.1% (w/w) dipalmitoylphosphatidylethanolamine. Samples were crystallized statically at
23 °C for 24 h.
2 NATURE COMMUNICATIONS | (2021)12:5018 | https://doi.org/10.1038/s41467-021-25206-1 | www.nature.com/naturecommunicationsNATURE COMMUNICATIONS | https://doi.org/10.1038/s41467-021-25206-1 ARTICLE
Table 1 Melting point and enthalpy of fusion of unrefined native CB, refined CB, and refined CB with added minor lipidic
components.
Sample Unrefined Refined DMPC DPPE GMS GMP GMO Stearic Oleic Palmitic
Melting point (°C) 36.4 ± 0.2a 28.8 ± 0.2b 30.8 ± 0.3c,d 31.7 ± 0.7c,d 29.8 ± 0.5b,c 30.4 ± 0.5b,c,d 32.2 ± 0.2d,e 34.7 ± 0.3a,f 34.0 ± 0.2e,f 34.2 ± 0.2f
Enthalpy of fusion (J/g) 143.9 ± 0.7a 110.9 ± 0.9b 105.5 ± 1.3b 106.2 ± 4.0b 106.6 ± 1.4b 105.0 ± 3.0b 104.4 ± 0.5b 145.0 ± 0.3a 141.4 ± 0.9a 140.4 ± 2.9a
Samples were crystallized statically at 23 °C for 24 h. Values represent the means and standard errors of three replicates. Values with the same superscript letter within a row are not significantly
different (P > 0.05).
70 70
Solid Fat Content (%)
a b
60 60
50 50
40 40
30 30
20 20
10 10
0 0
0 100 200 300 400 500 0 100 200 300 400 500
70 70
Solid Fat Content (%)
c d
60 60
50 50
40 40
30 30
20 20
10 10
0 0
0 100 200 300 400 500 0 100 200 300 400 500
Time (min) Time (min)
Fig. 2 Static crystallization growth curve of unrefined native CB, refined CB, and refined CB with added minor lipidic components crystallized at 23 °C
(symbols) and corresponding fits to the Avrami model (solid lines). The inset table indicates the half-times of crystallization derived form model fits.
Refining CB accelerates its crystallization (a), as does 0.1% (w/w) phospholipid addition (b). Addition of 0.5% (w/w) saturated monoacylglycerols,
glycerol monostearate, and glycerol monopalmitate, do not significantly affect crystallization kinetics, while addition of the unsaturated glycerol
monooletate does (c). Free fatty-acid addition to refined CB at 0.5% (w/w) levels accelerates crystallization for stearic, palmitic, and oleic acids equally
(d). Values represent means and standard errors of three replicates and values with the same superscript letter are not significantly different (P > 0.05).
(Supplementary Table 3), which complies with the requirement of In contrast, the refined CB sample displays a pattern that
havingARTICLE NATURE COMMUNICATIONS | https://doi.org/10.1038/s41467-021-25206-1
Fig. 3 Polarized light microscopy images of unrefined native CB, refined CB, and refined CB with and without added minor lipidic components. Samples
included a unrefined native CB, b refined CB, c refined CB with added 0.1% (w/w) dimyristoylphosphatidylcholine, and d refined CB with added 0.1% (w/w)
dipalmitoylphosphatidylethanolamine. Samples were crystallized statically at 23 °C for 24 h. Intensity and contrast were auto-levelled.
display a strong 2 L reflection, suggesting a mixture of 2 L and 3 L Fig. 2, with the calculated Avrami constants shown in Supple-
structures. mentary Table 515.
Unrefined CB has the longest half-time of crystallization at
Melting point and enthalpy of fusion. The melting points and 281.9 min, which decreases to 202.3 min after refining. Statisti-
enthalpies of fusion determined by DSC were compared across cally significant decreases (P < 0.05) in the half time of crystal-
the CB samples and are shown in Table 1. Example DSC curves lization of unrefined CB are observed after addition of DMPC,
are presented for each sample in Fig. 1 and Supplementary Fig. 2. DPPE, GMO, and all free fatty acids tested, including palmitic,
Wille and Lutton reported the melting temperatures for Forms I stearic, and oleic acids. Chaiseri and Dimick reported that
through VI as 17.3, 23.3. 25.5, 27.5, 33.9, and 36.3 °C10, while different phospholipids had different effects on crystallization
Lovegren et al.13 reported lower melting temperatures for the rate, with certain phospholipids such as lysophosphatidylcholine
same six polymorphs as 13, 20, 23, 25, 30, and 33.5 °C. The and phosphatidylinositol retarding nucleation, while others such
melting point of the unrefined CB used in our study closely as phosphatidylcholine promoting nucleation. They also high-
matches that of Form VI, as reported by Willie and Lutton10. lighted that removing phospholipids through refining decreased
However, once the CB is refined, the melting point drops to the crystallization rate, indicating that phospholids may be
28.8 °C, indicative of Form IV. After adding specific minor necessary as initial crystallization seeds in CB1. This agrees with
components back into the refined CB, the melting temperature the data presented in this study, with the addition of
increases again. Phospholipid and MAG addition to refined CB phospholipids increasing crystallization rate. Arruda and Dimick
yield samples with melting points in the range of 29.8–32.2 °C, reported a much higher relative concentration of phospholipids
suggesting that the CB crystals are in transition from Form IV to in seed crystals than in bulk CB, with the majority being
Form V, as reported by Wille and Lutton10. Finally, when FFAs phosphatidylethanolamine and phosphatidylcholine6. Thus, it
are added to refined CB, the melting temperature increases back appears that the added phospholipids may aid in the nucleation
to about 34 °C, which may indicate a mixture of Forms V and VI, of CB TAGs.
as it is also similar to Form VI’s melting point of 33.5 °C13. These The FFA and GMO CB samples have a slightly shorter half-
results are all in agreement with the XRD data. time of crystallization relative to the refined CB sample, but the
The enthalpies of fusion follow a similar trend, with a higher effects of palmitic and oleic acid are not statistically significant (P
enthalpy of fusion (143.9 J/g) for unrefined CB, which decreases > 0.05). Müller and Careglio focused their study specifically on
significantly after refining (110.9 J/g). Again, the phospholipids FFAs, and reported slower crystal growth of unrefined CB with
and MAGs have a much smaller effect, if any, compared to the added stearic, palmitic, and oleic acids7. However, we do not
FFAs. With the FFA samples, the enthalpies of fusion are similar observe this in our study. Chaiseri and Dimick reported that
to that of the unrefined CB. Guthrie reported an enthalpy of 147 saturated free fatty acids increased the crystallization rate in the
J/g for Form V CB, which decreased for less stable forms14. early stages of CB crystallization1.
Few studies have been conducted on the effect of MAGs on CB
crystallization. Chaiseri and Dimick suggested that their effects
Crystallization kinetics. The crystallization kinetics of the CB
are small due to their low concentration in CB1. In our study,
samples were quantified using half-times derived from the
GMS and GMP, both saturated monoglycerides, do not
Avrami model fitted to the SFC-temperature data, as shown in
4 NATURE COMMUNICATIONS | (2021)12:5018 | https://doi.org/10.1038/s41467-021-25206-1 | www.nature.com/naturecommunicationsNATURE COMMUNICATIONS | https://doi.org/10.1038/s41467-021-25206-1 ARTICLE
significantly affect CB crystallization kinetics. Surprisingly, the sample, a high melting temperature of 36.4 °C indicates the
unsaturated monoglyceride GMO enhances CB crystallization. presence of the Form VI polymorph. The higher free energy of
nucleation for this most stable polymorph results in low
nucleation rates, leading to a more heterogeneous mass distribu-
Polarized light microscopy. Light microscopy revealed subtle tion and a lower fractal dimension. Conversely, the lower melting
differences in the microstructure of the different CB samples temperature of the refined sample suggests a mixture of Forms IV
(Fig. 3 and Supplementary Fig. 3). Although all images display and V, which are metastable polymorphs. These polymorphic
feather-like spherulitic structures, the unrefined sample has forms have greater rates of nucleation, resulting in a more
smaller spherulites. DPPE addition, interestingly, leads to the homogeneous mass distribution and a higher fractal dimension16.
formation of larger spherulites with a different texture than upon
DMPC addition. The spherulites of the refined and DPPE sam- Mechanical properties. The hardness of both CB and chocolate
ples display granular structures in the centre of the spherulites samples containing some of the minor components was deter-
and feather-like crystallites in the periphery. The MAG samples mined by 3-point bending, and the elastic bending modulus
all exhibit similar crystal morphologies, with both granular calculated. The elastic bending moduli (EB) of unrefined CB,
structures and small feather-like spherulites present. This is refined CB, and DMPC CB are 44.1 ± 3.4, 35.4 ± 4.4, and 39.0 ±
similar to the stearic and palmitic acid samples, though the FFA 3.7 N/mm2, respectively. There is no statistically significant dif-
samples display a more granular structure. It appears that the ference between these values (P > 0.05). The melting temperatures
MAG and FFA samples, excluding the oleic acid sample, revert for these samples are the same as well, with the average being
the CB to the morphology of the unrefined sample. However, the 34.3 ± 0.1 °C.
oleic acid sample differs greatly from the rest, displaying large For the chocolate samples, the addition of phospholipids to
spherulites analogous to the refined CB sample. molten commercial chocolate (90% cocoa solids) allows the
An aspect that became clear during the microscopy studies is chocolate to maintain hardness without complex tempering
that the spatial distribution of mass of CB is affected by the procedures, such as crystallization at 5 °C for 1 h and subsequent
refining process and subsequent addition of minor lipidic storage at 20 °C for 4 days. Other trials with static crystallization
components. One way to quantify this spatial distribution of at 23 and 26 °C yield chocolates with undesirable mechanical and
mass is by determining the box-counting fractal dimension (Dbox) surface properties, suggesting that the use of phospholipids to
of the images. A high fractal dimension is associated with a promote proper tempering still requires some optimization of
greater fill of the available embedding space with crystalline mass, crystallization temperatures. DMPC and DPPE were added
as well as a higher order in the distribution of this crystalline chocolate at 0.1% (w/w) levels, and their properties were
mass. The box-counting fractal dimension provides a value that compared to commercial chocolate both directly from the
quantifies the level of space-filling, as well as self-similarity within package and recrystallized under the same conditions as the
a structure, which can be related to the nucleation process of CB. doped samples (Table 2). The EB is similar between the
Supplementary Table 6 lists these values. The unrefined and commercial chocolate and the phospholipid-containing samples,
stearic acid samples have the lowest average fractal dimension, but is significantly lower for the recrystallized commercial
with Dbox = 1.63 and 1.62, respectively. In contrast, the sample chocolate (P < 0.05). When the chocolate is melted and
with the highest fractal dimension is the refined sample at Dbox = recrystallized without any additive addition, it becomes much
1.75, followed by the phospholipid samples at ~1.72. Samples softer. A greater EB indicates a stiffer chocolate, relating to the
with a higher fractal dimension are expected to have originated property of snap, which is desirable in chocolate. However, DSC
from a higher nucleation rate, as this leads to more homogenous analysis revealed that all the chocolate samples have similar
growth across an area. On the other hand, slower nucleation rates melting temperatures, all indicative of Form V CB crystals. XRD
would result in more heterogeneous growth, leading to a lower patterns further confirm the presence of Form V CB crystals in all
fractal dimension for the resulting mass distribution 16. samples (Fig. 5). Thus, it appears that the polymorphism of CB in
Interestingly, here we also discovered a statistically significant chocolate does not wholly determine its mechanical properties,
(r = 0.77, P < 0.01) inverse correlation between the melting and these mechanical properties may be attributed to the
temperature of the samples and their fractal dimension, as shown microstructure instead.
in Fig. 4. This may be related to the polymorphism of each sample Proper chocolate tempering typically focuses on the melting
and its corresponding nucleation process. For the unrefined behavior of the chocolate, in other words, the polymorphism of
the chocolate’s CB triacylglycerol crystals2,3. However, there is
1.80
little consideration for the microstructure and mechanical
properties when determining whether chocolate has been
1.75
properly tempered or not. Here we show that addition of DMPC
1.70
and DPPE helps achieve the desired hardness and fracture
Dbox
properties in chocolate, without directly impacting the poly-
1.65 morphism. This likely results from changes in the microstructure
of the underlying CB fat crystal network, which arises from the
1.60 r=0.77 PARTICLE NATURE COMMUNICATIONS | https://doi.org/10.1038/s41467-021-25206-1 Table 2 Elastic bending modulus (EB), melting temperature, and whiteness index (WI) of commercial chocolate samples with added phospholipids. Sample Commercial DMPC DPPE Recrystallized commercial EB 74.7 ± 13.2a 75.6 ± 8.3a 65.7 ± 8.4a,c 36.6 ± 4.2b,c Melting temperature (°C) 33.3 ± 0.5a 34.4 ± 0.2a 34.0 ± 0.1a 33.6 ± 0.3a WI 38.9 ± 1.6a,b 32.2 ± 3.3a,* 40.0 ± 2.8a,b,* 43.6 ± 2.6b Samples included fresh commercial chocolate, molten and recrystallized commercial chocolate with added 0.1% (w/w) dimyristoylphosphatidylcholine (DMPC), molten and recrystallized commercial chocolate with added 0.1% (w/w) dipalmitoylphosphatidylethanolamine (DPPE), molten and recrystallized commercial chocolate. The molten and recrystallized samples were crystallized at 5 °C for 1 h and stored at 20 °C for 4 days. Values represent the means and standard errors for 4–16 replicates for EB and WI and for 3 replicates for melting temperature. Values with the same superscript letter within a row are not significantly different (P > 0.05). *There is a significant difference between these values at P < 0.1. Fig. 5 Powder X-ray diffraction patterns for commercial chocolate with added minor lipidic components. Chocolate samples were molten, blended with the minor components and crystallized at 5 °C for 1 h, followed by 20 °C for 4 days. The a commercial chocolate, b molten and recrystallized commercial chocolate, c molten and recrystallized commercial chocolate with added 0.1% (w/w) dimyristoylphosphatidylcholine, and d molten and recrystallized commercial chocolate with added 0.1% (w/w) dipalmitoylphosphatidylethanolamine, all display powder X-ray diffraction patterns characteristic of well- tempered β2, triclinic, Form V cocoa butter crystals. This crystal form displays a strong reflection corresponding to a short spacing of ~4.6 Å in the wide- angle diffraction region, and characteristic wide-angle reflections in the 2θ region 20–25°. In the small-angle diffraction region, only reflections from the 3 L (001) plane corresponding to ~62–63-Å were observed. The absence of reflections from (001) plane of the 2 L polytype indicates the formation of the optimal polytypic form in the cocoa butter in all samples. Reflections at higher angles in the small-angle region correspond to higher-order reflections for these two crystal planes. measurements17. A higher WI indicates a greater level of fat Chocolate microstructure by synchrotron-based micro-com- bloom on the surface of the chocolate, or may also indicate a puted tomography (SR-µCT). Synchrotron µCT analysis rougher surface. The WI for each of the chocolate samples is revealed similarities between chocolate microstructure among all shown in Table 2. The commercial chocolate and the DMPC samples imaged at a
NATURE COMMUNICATIONS | https://doi.org/10.1038/s41467-021-25206-1 ARTICLE
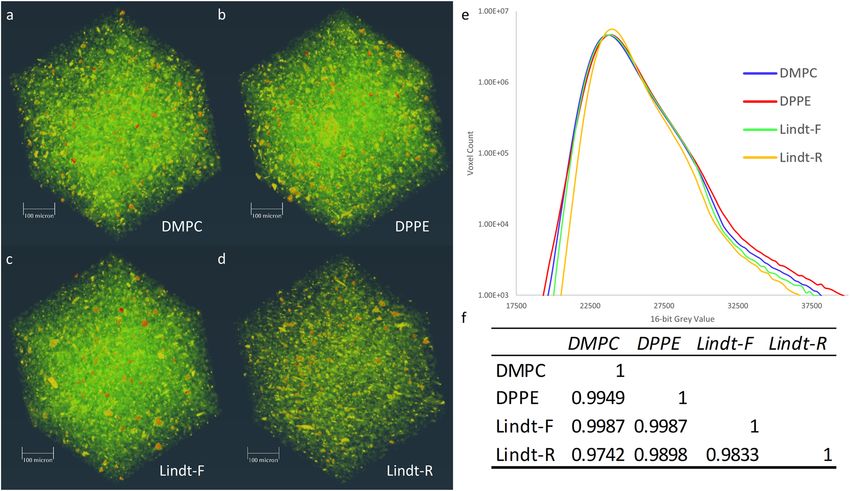
Fig. 6 Volume renderings of reconstructed slices, plotted histograms, and correlation matrix of SR-µCT data. Samples included a molten and
recrystallized commercial chocolate with added 0.1% (w/w) dimyristoylphosphatidylcholine (DMPC), Supplementary Movie 1; b molten and recrystallized
commercial chocolate with added 0.1% (w/w) dipalmitoylphosphatidylethanolamine (DPPE), Supplementary Movie 2; c fresh commercial chocolate
(Lindt-F), Supplementary Movie 3; d molten and recrystallized commercial chocolate (Lindt-R), Supplementary Movie 4; e plotted histograms, and f
correlation matrix.
compared to the Lindt-F, DMPC, and DPPE samples, as seen in production of chocolate products without the need for laborious
Fig. 6. Volume rendering movies of each sample can be seen in and complex tempering protocols.
the corresponding links in Fig. 6. Proper tempering is often judged by the resulting melting
A comparison of the histograms shows qualitative differences temperature, a function of the CB polymorphic form2. However,
in the overall density distributions, which make up the sample as we show in this study, the various chocolate samples were all in
volumes in the images. A correlation matrix was generated by Form V as determined by DSC and XRD analysis, but display
inputting the voxel count values for each binned 16-bit gray-value different mechanical properties. This suggests that there is more
and generating a table of correlation coefficients between the four to tempering than achieving the Form V polymorph, and
chocolates density distributions. The correlation matrices show a important qualities such as gloss and snap may be heavily
high positive correlation in the material’s density distribution dependent on surface and bulk microstructure. Thus, DMPC,
regardless of treatment; however, the least variance is observed DPPE, and possibly other saturated phospholipids can potentially
between DMPC vs. Lindt-F and DPPE vs. Lindt-F. The highest be employed as effective additives for engineering the crystal-
correlation coefficient is found between DMPC and fresh Lindt, lization behavior, polymorphism, nanostructure, and microstruc-
and DPPE vs. fresh Lindt samples, with a value of 0.9987. This ture in CB and chocolate products.
suggests that the complex microstructure of Lindt chocolate with
added DMPC and DPPE and crystallized isothermally, is more
similar to that of tempered fresh Lindt chocolate than without Methods
these additives. Samples. Malaysian CB supplied from JB Cocoa Sdn. Bhd. (JB Cocoa, Johor,
Overall, we find that the presence of various minor Malaysia) was used for all CB samples. Lindt Excellence Cocoa 90% dark chocolate
(Chocoladefabriken Lindt & Sprüngli AG, Kilchberg, Switzerland) was used for all
components within CB results in major changes to its chocolate samples. Chocolate samples were melted and poured into 35.0 × 19.0 ×
polymorphism, crystallization kinetics, and crystal morphology. 5.0 mm molds and allowed to set at 5 °C for an hour before transferring to an
By refining CB through neutralization and bleaching, the incubator at 20 °C to finish crystallizing for 4 days.
unrefined CB transitioned from Form VI to a blend of Forms
IV and V, in addition to displaying faster crystal growth.
Although adding MAGs and FFAs back into refined CB results in Fatty-acid composition. For determination of the fatty-acid profile, the CB was
some small differences, phospholipid addition has the largest analyzed by an Agilent 6890-series gas chromatograph (Agilent Technologies, Inc.,
Wilmington, DE, USA) with a 7683-series auto-sampler. A 60 m by 0.22 mm
impact. internal diameter BPX70 column (SGE Inc. Austin, TX, USA) with a 0.25 μm film
At 0.1% (w/w) levels, DMPC and DPPE both significantly thickness was used. The oven temperature increased at 4 °C/min from 110 to
increase the crystal growth rate of refined CB. However, the 230 °C and then sustained at this temperature for 18 min. The injector was set at
DPPE sample exhibits significant amounts of the 2 L polytype, 250 °C and operated at 20.1 psi with a flow of 17.7 mL/min. High-purity helium
while the DMPC sample only displays 3 L polytypism, which is flowed at an average velocity of 25 cm/s as the carrier gas. A flame-ionization
detector was set at 255 °C with an air flow of 450 mL/min and a helium flow of 50
the more stable and preferred nanostructure. When added to a mL/min. The GC separation peaks were analyzed using Open LAB software
commercial chocolate sample, DMPC and DPPE both template (Agilent Technologies). Fatty-acid composition was determined by comparing the
the Form V polymorph with optimal mechanical properties, retention times of the peaks to internal standards. The fatty-acid composition of
surface gloss and microstructure. This may allow for the the added MAGs and GMO were also analyzed in the same manner. Complete
results can be found here: https://doi.org/10.7910/DVN/SJ8BEQ.
NATURE COMMUNICATIONS | (2021)12:5018 | https://doi.org/10.1038/s41467-021-25206-1 | www.nature.com/naturecommunications 7ARTICLE NATURE COMMUNICATIONS | https://doi.org/10.1038/s41467-021-25206-1
Phosphorus content. To determine the amount of phosphorus in the CB before Polarized light microscopy (PLM). To elucidate the microstructure of the dif-
and after the refining process, the AOCS Official Method Ca 12–55 was employed. ferent samples, polarized light microscopy was employed. The CB samples were
The phosphorus content in the sample was determined spectrophotometrically and first melted at 80 °C for 30 min to eliminate previous crystallization memory. A
compared to a prepared standard curve. Complete results can be found here: small drop of sample was placed on a pretempered microscope slide, and a pre-
https://doi.org/10.7910/DVN/SJ8BEQ. tempered glass cover slip was first placed on one edge at the side of the sample and
lightly dropped to ensure a uniform layer without air bubbles. The prepared slides
were placed in an incubator set at 23 °C for 24 h before examining on a microscope.
Free fatty-acid content. Following the method provided by the AOCS Official The samples were imaged by PLM on an OMAX optical microscope model
Method Ca 5a–40, the free fatty-acid content was determined for the samples both M838PL (OMAX Microscope, USA) equipped with a ×40 objective lens. Images
before and after neutralization. The free fatty-acid percentage and acid value were were captured using a model A35180U3 digital camera (OMAX Microscope, USA)
calculated as stated in the method. Complete results can be found here: https://doi. using Toupview software (ToupTek Photonics, Zhejiang, China). Images were
org/10.7910/DVN/SJ8BEQ. auto-levelled in Adobe Photoshop 2020 (San Jose, CA, USA) and then auto-
thresholded to 128 as shown in Supplementary Fig. 4. The images were analyzed in
Refining process. The CB was neutralized for the removal of free fatty acids. Once Benoit 1.3 Fractal Analysis System (TruSoft International, Inc., Miami, FL, USA) to
the CB was heated to 50 °C, a 2.7% treat of 16% sodium hydroxide was added determine the box-counting fractal dimension. Six different micrographs per
according to the level of free fatty acids as determined previously. After mixing for treatment were used in the box-counting analysis. Complete results can be found
20 min, the temperature was raised to 70 °C and the sample was subsequently here: https://doi.org/10.7910/DVN/SJ8BEQ.
mixed for another 5 min. Centrifuging to separate the soap layer, the sample was
then washed with hot water in a separatory funnel before heating to evaporate Three-point bending. Mechanical properties of the CB and chocolate samples
excess water. The neutralized CB was subsequently bleached for further refining by were tested using a Model TA.XT2 texture analyzer (Stable Micro Systems, Texture
melting and heating to 110 °C before 0.5% bentonite bleaching clay was added. Technologies Corp., Scarsdale, NY, USA) with a three-point bending attachment.
After stirring for 25 min at this temperature, the sample was filtered using a The settings were set to compression mode, with a test speed of 1.00 mm/sec and a
Whatman Grade 4 240 mm filter paper. trigger force of 0.100 N. Samples were balanced on two points 20.0 mm apart with
the three-point bending attachment applying a constant force in the middle to
break the sample. The peak force (F) required to break the sample and the
Addition of minor components. After the refining processes, various phospholi-
deformation of the sample at the peak force (d) were recorded. With these values,
pids, MAGs, and FFAs were added to the CB. Cocoa butter was melted at 80 °C for
along with the height (h) and width (b) of the samples, and the separation between
15 min, and the minor components were mixed in by hand until fully dissolved. Fa3
Chocolate samples were molten in a double boiler at 60 °C and minor components the two support points (a), the elastic bending modulus (EB) (EB ¼ 4dbh 3 ) was
20
calculated . Complete results can be found here: https://doi.org/10.7910/DVN/
added and mixed by hand until fully dissolved. Minor components were fully
incorporated within 5 min of mixing. 1,2-dimyristoyl-sn-glycero-3-phosphocholine SJ8BEQ.
(DMPC) (Avanti Polar-Lipids, Alabaster, Alabama, USA) and 1,2-dipalmitoyl-sn-
glycero-3-phosphoethanolamine (DPPE) (Avanti Polar-Lipids, Alabaster, Ala- Surface reflectance. The surface color of the chocolate samples was analyzed
bama, USA) were each added to refined CB at 0.1% w/w levels. Glyceryl mono- using the ColorMeter Free app (https://play.google.com/store/apps/details?
stearate (GMS) (Alphadim 90 SBK from Caravan Ingredients, Lenexa, Kansas, id=com.vistechprojects.colormeterfree) on an Android cell phone (Samsung
USA), glyceryl monopalmitate (GMP) (Alphadim 90 PBK from Caravan Ingre- Galaxy S7). Guidance provided by “Use Your Smartphone as an “Absorption
dients, Lenexa, Kansas, USA), and glyceryl monooleate (GMO) (1-monoolein, Alfa Spectrophotometer”” (https://www.chemedx.org/blog/use-your-smartphone-
Chemistry, New York, USA) were added at 0.5% w/w levels. Gas chromatography absorption-spectrophotometer) was followed. Samples were placed on a black
revealed that the GMS was mainly stearic acid (88.3%), the GMP was not only background and photographed, before analyzing to provide RGB values. These
palmitic acid (56.9%) but also had significant amounts of stearic acid (40.5%), and values were converted into XYZ values and subsequently CIE L*a*b* values
GMO was mainly oleic acid (81.8% oleic acid). Stearic acid, palmitic acid, and oleic through nonlinear functions using the EasyRGB website (https://www.easyrgb.
acid (Fisher Scientific Company, Ottawa, Ontario, Canada), as free fatty acids, were com/en/convert.php#inputFORM). These values were then used to calculate the
added at 0.5% w/w levels. DMPC and DPPE were added to the chocolate samples 2 1=2
at 0.1% (w/w) levels. Whiteness Index (WI) (WI ¼ 100 ½ð100 L* Þ þ a*2 þ b*2 ) for each
sample17. Complete results can be found here: https://doi.org/10.7910/DVN/
SJ8BEQ.
Solid fat content (SFC) measurements for crystallization kinetics. The samples
were first melted at 80 °C for 30 min to remove any previous crystal memory. After
placing the samples in glass pulsed nuclear magnetic resonance (pNMR) tubes (10 Synchrotron-based micro-computed tomography (SR-µCT). Imaging was per-
mm diameter, 1 mm thickness, and 180 mm height) in a water bath set at 23 °C, formed at the Biomedical Imaging and Therapy—Bending Magnet beamline
solid fat content measurements were taken using a Bruker mq20 Minispec Series (BMIT-BM 05B1-1) at the Canadian Light Source Synchrotron located in Saska-
PC 120 pNMR spectrometer operating at 20 MHz and 0.47 T (Milton, ON, toon, SK. The beamline generates a continuous X-ray spectrum between 50 and
Canada) at suitable timepoints. Analysis of data was performed using MiniSpec 500 keV with the 12.6–40 keV energy range mostly used for experiments due to the
software V2.51 Rev. 00/NT (Bruker Biospin Ltd., Milton, ON, Canada). Samples beam size at full width half maximum of ~100.0 mm (H) × 3.2 mm (V). A 2.000
were measured in triplicate. The Avrami model was used to quantify crystallization mm glassy carbon filter was used to generate a broadband beam with a mean
kinetics by fitting the model to SFC-time data by nonlinear regression photon energy of ~17 keV. A PCO Dimax (2000 × 2000 pixels) sCMOS detector
was coupled with a Optique Peter (Lentilly) microscope (×10 objective, Mitutoyo
(SFC ¼ SFCmax ð1 ekA t Þ, ref. 15) using GraphPad Prism 5.0 (GraphPad Soft-
n
LWD Plan Apochromat) to the Lutetium Silicon Oxide: Terbium (LSO:Tb) scin-
ware, San Diego, CA, USA). The half-life of crystallization was then determined as
tillator (10 µm thick, European Synchrotron Radiation Facility), which gave an
t 1=2 ¼ ðln2=kA Þn , ref. 15 Complete results can be found here: https://doi.org/
effective pixel size of 1.2 µm with a field of view (FOV) of 2.44 mm2.
10.7910/DVN/SJ8BEQ. Chocolate samples were cut into ~5 mm cubes and mounted on a Huber
manual goniometer head with dental wax. The sample was placed 4.0 cm from the
Powder X-ray diffraction. Samples were analyzed by X-ray diffraction (Multiflex detector. Twenty flat images (no sample in beam path) and 20 dark images (no
Powder XRD spectrometer, Rigaku, Tokyo, Japan) to identify the polymorphism beam on the detector) were acquired in order to subtract the detector background
and crystal structure. The instrument was operated at 40 kV and 44 mA and was noise and normalize the intensity of the X-ray images. Sets of 2000 projection
run with a copper X-ray tube with a wavelength of 1.54 Å. Measurements were images (sample in beam path) were collected through 180° rotation of the sample.
taken after CB samples were melted at 80 °C for 30 min and crystallized statically at All images were collected with an exposure time of 2 ms. Each set of 2000
23 °C in an incubator for 1 day. Scans ranged from 1 to 30° at a scan rate of 0.5°/ projection images constituted one scan. To increase the total sample volume in the
min. The XRD patterns were analyzed with Jade 9 (Materials Data Inc., Livermore, study, the sample was translated in the direction of the rotation axis (vertically) and
CA, USA). Complete results can be found here: https://doi.org/10.7910/DVN/ two additional scans were collected. The volumes interrogated by the three scans
SJ8BEQ. had sufficient overlap to allow for the scans to be stitched together during data
processing into one continuous cylindrical volume. This volume contained
chocolate from the outer surface to a depth of ~6 mm.
Differential scanning calorimetry (DSC). To determine melting points and Image processing and three-dimensional reconstructions were similar to those
enthalpies of fusion for the samples, a TA instrument model Q2000 (TA instru- described by Willick et al.21 In brief, the data were reconstructed using UFO-KIT
ments, Mississauga, ON, Canada) DSC with a cooling system was utilized. software described by Vogelgesang et al.22,23 (https://ufo.kit.edu/dis/index.php/
Nitrogen was used to purge the system at a flow rate of 18 mL/min. Five to ten software/ and https://github.com/sgasilov/ez_ufo) and the ezufo and ezstitch tools.
milligrams of samples was placed in an aluminum DSC pan with a lid. These were A test image stack was generated in UFO and ring artifacts (concentric rings in
measured against a reference empty hermetically sealed pan. The pan was equili- reconstructed images) were suppressed using a low-pass Gaussian filter on the
brated to 5 °C, before the temperature ramped up at 5 °C/min until 50 °C. Mea- horizontal frequencies. Transport of intensity–phase retrieval (TIE-PR)24 was
surements were taken in triplicate. Complete results can be found here: https://doi. performed on the test dataset utilizing the following parameters in the UFO-kit:
org/10.7910/DVN/SJ8BEQ Beam energy = 17.0 keV; pixel size = 1.2 µm; sample to detector distance = 4 cm;
8 NATURE COMMUNICATIONS | (2021)12:5018 | https://doi.org/10.1038/s41467-021-25206-1 | www.nature.com/naturecommunicationsNATURE COMMUNICATIONS | https://doi.org/10.1038/s41467-021-25206-1 ARTICLE
δ/β = 200. This test image stack was used to determine histogram clipping values 19. Kinta, Y. & Hatta, T. Composition and structure of fat bloom in untempered
for the conversion of 32-bit tiff image stacks to 16-bit tiff image stacks in the final chocolate. J. Food Sci. 70, s450–s452 (2005).
reconstructions. ImageJ was then used to find the horizontal overlap of each view 20. Steffe, J. F. Rheological Methods in Food Process Engineering. (Freeman Press,
and EZ-stitch was used to generate orthogonal sections through the entire volume. 1996).
The 450 × 450 × 450 µm volumes were cropped from each CT scan using ImageJ. 21. Willick, I. R., Stobbs, J., Karunakaran, C., & Tanino, K. K. in Plant Cold
Final image stacks were opened, visualized, volume rendered and analyzed in 3D Acclimation, 141–159 (Humana, 2020).
data visualization software Avizo 2020.2 (Thermo Scientific™ Amira-Avizo™ 22. Vogelgesang, M. et al. “Real-time image-content-based beamline control for
Software, Thermo Fisher Scientific, Waltham, MA USA). Volume renderings and smart 4D X-ray imaging.” J. Synchrotron Radiat. 23.5, 1254–1263 (2016).
orthogonal pan through of each sample can be seen here: https://doi.org/10.7910/ 23. Vogelgesang, M., Chilingaryan, S., dos_Santos Rolo, T., & Kopmann, A. UFO:
DVN/WFUHDV. Histogram’s were produced using excel, by plotting 16-bit bin A scalable GPU-based image processing framework for on-line monitoring. in
data vs voxel count. Reconstructed slices used for analysis can be retrieved from 2012 IEEE 14th International Conference on High Performance Computing and
https://doi.org/10.7910/DVN/G6QBD2. Communication & 2012 IEEE 9th International Conference on Embedded
Software and Systems, 824–829 (IEEE, 2012).
Statistical analysis. GraphPad Prism software version 5.0 (La Jolla, CA, USA) was 24. Paganin, D., Mayo, S. C., Gureyev, T. E., Miller, P. R., & Wilkins, S. W.
used for all statistical analysis and nonlinear regressions. The data collected was Simultaneous phase and amplitude extraction from a single defocused image
analyzed with one-way ANOVA tests considering P < 0.05 as significant with of a homogeneous object. J. Microsc. 206, 33–40 (2002).
Tukey post-tests.
Acknowledgements
Data availability We acknowledge the financial support of the Natural Sciences and Engineering Research
Source data for all figures and tables have been deposited in Harvard Dataverse (https:// Council of Canada (NSERC) through grant RGPIN-04983, and the Canada Research
dataverse.harvard.edu) and the links indicated in the Experimental Procedures section of Chairs (CRC) Program. Part of the research described in this paper was performed at the
the manuscript. Canadian Light Source, a national research facility of the University of Saskatchewan,
which is supported by the Canada Foundation for Innovation (CFI), the Natural Sciences
Received: 15 September 2020; Accepted: 27 July 2021; and Engineering Research Council (NSERC), the National Research Council (NRC), the
Canadian Institutes of Health Research (CIHR), the Government of Saskatchewan, and
the University of Saskatchewan. CT data handling, processing, and analysis on this
paper was partially supported by the grant and contribution-funding program of
the National Research Council of Canada. J.A.S. would like to acknowledge Sergei
Gasilov for technical support at the BMIT beamline and image reconstruction tools for
CT data.
References
1. Chaiseri, S. & Dimick, P. S. Dynamic crystallization of CB. I. Characterization
of simple lipids in rapid- and slow-nucleating CBs and their seed crystals. J. Author contributions
Am. Oil Chem. Soc. 72, 1491–1496 (1995). J.C. contributed to the planning and execution of experimental procedures and the
2. Marangoni, A. G. et al. Structure and functionality of edible fats. Soft Matter 8, writing of the manuscript. S.M.G. contributed to the planning and execution of
1275–1300 (2012). experimental procedures. J.A.S. carried out the synchrotron micro-CT data collection,
3. Sato, K. Crystallization behaviour of fats and lipids—a review. Chem. Eng. Sci. analysis, and write-up. A.G.M. contributed to the experimental planning and the writing
56, 2255–2265 (2001). of the manuscript.
4. Foubert, I., Vanrolleghem, P. A., Thas, O. & Dewettinck, K. Influence of
chemical composition on the isothermal CB crystallization. J. Food Sci. 69,
E478–E487 (2004).
Competing interests
The authors declare no competing interests.
5. Lechter, A. in CB and Related Compounds (eds Garti, N. & Widlak, N. R.)
213–232 (AOCS Press, 2012).
6. Arruda, D. H. & Dimick, P. S. Phospholipid composition of lipid seed crystal Additional information
isolates from ivory coast CB. J. Am. Oil Chem. Soc. 68, 385–390 (1991). Supplementary information The online version contains supplementary material
7. Müller, M. & Careglio, E. Influence of free fatty acids as additives on the available at https://doi.org/10.1038/s41467-021-25206-1.
crystallization kinetics of CB. J. Food Res. 7, 86–97 (2018).
8. Smith, K. W., Bhaggan, K., Talbot, G. & Van Malssen, K. F. Crystallization of Correspondence and requests for materials should be addressed to A.G.M.
fats: influence of minor components and additives. J. Am. Oil Chem. Soc. 88,
1085–1101 (2011). Peer review information Nature Communications thanks Dilworth Parkinson and the
9. Vila Ayala, J. et al. Impacts of bleaching and packed column steam refining on other, anonymous, reviewers for their contribution to the peer review of this work. Peer
CB properties. J. Am. Oil Chem. Soc. 84, 1069–1077 (2007). reviewer reports are available.
10. Wille, R. L. & Lutton, E. S. Polymorphism of CB. J. Am. Oil Chem. Soc. 43,
491–496 (1966). Reprints and permission information is available at http://www.nature.com/reprints
11. Bresson, S., Rousseau, D., Ghosh, S., El Marssi, M. & Faivre, V. Raman
spectroscopy of the polymorphic forms and liquid state of CB. Eur. J. Lipid Sci. Publisher’s note Springer Nature remains neutral with regard to jurisdictional claims in
Technol. 113, 992–1004 (2011). published maps and institutional affiliations.
12. Ghazani, S. M. & Marangoni, A. G. The stability and nature of the form IV
polymorph of CB is dictated by 1-palmitoyl-2-oleoyl-3-stearoyl-glycerol.
Cryst. Growth Des. 19, 1488–1493 (2019). Open Access This article is licensed under a Creative Commons
13. Lovegren, N. V., Gray, M. S. & Feuge, R. O. Polymorphic changes in mixtures
Attribution 4.0 International License, which permits use, sharing,
of confectionery fats. J. Am. Oil Chem. Soc. 53, 83–88 (1976).
adaptation, distribution and reproduction in any medium or format, as long as you give
14. Guthrie, S. E. Physical Properties of Shear Oriented CB. https://uwspace.
appropriate credit to the original author(s) and the source, provide a link to the Creative
uwaterloo.ca/handle/10012/3557 (2008).
Commons license, and indicate if changes were made. The images or other third party
15. Marangoni, A. G. Kinetic analysis of food systems. Kinetic Analysis of Food
material in this article are included in the article’s Creative Commons license, unless
Systems (Springer International Publishing AG, 2017).
indicated otherwise in a credit line to the material. If material is not included in the
16. Marangoni, A. G. & McGauley, S. E. Relationship between crystallization
behavior and structure in CB. Cryst. Growth Des. 3, 95–108 (2003). article’s Creative Commons license and your intended use is not permitted by statutory
17. Lohman, M. H. & Hartel, R. W. Effect of milk fat fractions on fat bloom in regulation or exceeds the permitted use, you will need to obtain permission directly from
dark chocolate. J. Am. Oil Chem. Soc. 71, 267–276 (1994). the copyright holder. To view a copy of this license, visit http://creativecommons.org/
18. Tietz, R. A. & Hartel, R. W. Effects of minor lipids on crystallization of milk licenses/by/4.0/.
fat-CB blends and bloom formation in chocolate. JAOCS. J. Am. Oil Chem.
Soc. 77, 763–771 (2000).
© The Author(s) 2021
NATURE COMMUNICATIONS | (2021)12:5018 | https://doi.org/10.1038/s41467-021-25206-1 | www.nature.com/naturecommunications 9You can also read