Investigating the optical clearing effects of 50% glycerol in ex vivo human skin by harmonic generation microscopy - Nature
←
→
Page content transcription
If your browser does not render page correctly, please read the page content below
www.nature.com/scientificreports
OPEN Investigating the optical clearing
effects of 50% glycerol in ex vivo
human skin by harmonic
generation microscopy
Jia‑Hong Lai1, En‑Yu Liao1, Yi‑Hua Liao2* & Chi‑Kuang Sun1*
Imaging depth and quality of optical microscopy can be enhanced by optical clearing. Here we
investigate the optical clearing of the ex vivo human skin by 50% glycerol topical application, which
is allowed for cosmetic usage. Harmonic generation microscopy, by combining second and third
harmonic generation (THG) modalities, was utilized to examine the clearing effect. The THG image
intensity is sensitive to the improved optical homogeneity after optical clearing, and the second
harmonic generation (SHG) image intensity in the dermis could serve as a beacon to confirm the
reduction of the scattering in the epidermis layer. As a result, our study supports the OC effect through
50% glycerol topical application. Our study further indicates the critical role of stratum corneum
shrinkage for the observed SHG and THG signal recovery.
Optical microscopy is a light-based technique with a resolving power that is much higher when compared to
other conventional clinical imaging techniques such as ultrasound, X-ray tomography, and magnetic resonance
imaging. Optical microscopy is able to provide resolution in the submicron range, enabling it to resolve fine
structures inside tissues. Its application has been extended into neural science which successfully shows sensory
information within the rat brain in distributed spatiotemporal patterns of neuronal a ctivity1. Although capable
of providing high-resolution parameters, its clinical application is still limited by the imaging depth. As light
scattering and absorption introduce both light pulse broadening, defocusing, and decrement of intensity, optical
image quality and contrast will be compromised with increasing imaging depth. In order to overcome the depth
limitation and to enhance the image quality, researchers have attempted to reduce the scattering of tissue turbid-
ity by matching the refractive index using various osmotic agents, a procedure known as optical clearing (OC).
OC was first studied by W Spalteholz in 1 9142. For the case of skin, Tuchin first studied OC with the tissue
immersion technique in 1 9973. Since then, OC has been frequently studied with various tissues and different
optical clearing agents (OCA). One of the most important mechanisms is the refractive index matching, which
is to reducing the scattering inside the tissue. However, in different tissues such as sclera3, liver4–6, muscle7,
tendon5,7, skin5,8–21, the OC effect varies. Among these studies, skin optical clearing with glycerol attracts high
attention5,8–15,17,18,20–37. Glycerol is a low toxic substance and widely used for the food industry, medicine, and
cosmetic products. Previous investigations illustrate that after applying glycerol cream or solutions on skin, the
skin condition will be i mproved38,39. Glycerol is also one of the most widely used OCAs and has been proved as
the most effective among different kinds of alcohols9,20. Skin is the outermost organ of humans, which acts as the
barrier between internal organs and the environment. Many skin diseases can be histopathologically diagnosed
by observing morphological changes in different skin layers. However, the skin is a high scattering tissue that
comprises multiple layers with a variation of refractive index. Although OC of human skin have been studied
by many different optical imaging techniques such as near-infrared (NIR) s pectrophotometer9–12,23,29,36, confo-
cal microscopy13,14, multi-photon microscopy8,15,35, SHG microscopy8, and optical coherence tomography (OC
T)5,12,17,18,26,29,30,34,36,37 in the past few decades, the effects and mechanisms of optical clearing in human skin with
glycerol topically applied are not fully understood and are with inconsistent results, especially for the case of
glycerol at low concentration. Observation of the OC effect inside the topmost epidermis layer is thus important
to understand its mechanisms for topical applications.
1
Department of Electrical Engineering and Graduate Institute of Photonics and Optoelectronics, National Taiwan
University, Taipei 10617, Taiwan. 2Department of Dermatology, National Taiwan University Hospital and College of
Medicine, National Taiwan University, Taipei 10002, Taiwan. *email: yihualiao@ntu.edu.tw; sun@ntu.edu.tw
Scientific Reports | (2021) 11:329 | https://doi.org/10.1038/s41598-020-77889-z 1
Vol.:(0123456789)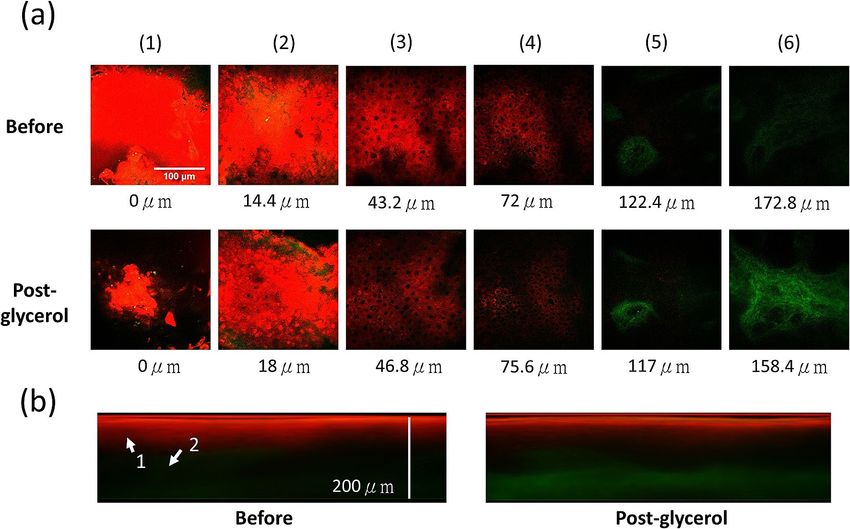
www.nature.com/scientificreports/
Figure 1. Bright field images before and after the glycerol application of the (a) Case E100-I90-1 (b) Case
E100-I90-2. Scale bar = 1 mm. Before: before treatment; Post-glycerol: after treatment.
In this article, we report our OC study on ex vivo human skin with 50% glycerol application by harmonic
generation microscopy (HGM). By adopting a femtosecond excitation light40 located at the skin penetration
window around 1300 nm41, HGM has been confirmed to be a noninvasive histopathology imaging tool for the
differential diagnosis of various skin l esions42–46, the study of skin a ging10,47,48, and other clinical t issues49–52. For
comparison purpose, we applied 100% or 50% glycerol by immersion or topical application on human skin to
observe if the OC effect varied. We studied the 100% glycerol with immersion due to its well-understood and
promising effects. For the 50% glycerol with topical application, 50% glycerol is safe for in vivo human skin appli-
cations and been allowed as human skincare products. The safety assessment of The Cosmetic Ingredient Review
Expert Panel (CIR) reported that glycerin can be used at concentrations up to 78.5% in leave-on products53. The
results of 50% glycerol topical application will help future in vivo human skin trials. Our HGM study indicated
the capability of THG microscopy to observe different diffusion effects of OCAs due to its high 3D resolution
and high sensitivity to the local change in optical homogeneity in epidermis. SHG was, on the other hand, a
beacon to summarize the accumulated reduction of the optical scattering in the epidermis. Our study revealed
that both refractive index matching and tissue shrinkage affect the optical clearing. Besides, we found the stratum
corneum (SC) playing an important role for topical application of OCA. Among all the studied 9 cases, six cases
found decrement of the SC thickness, accompanying significant optical clearing effects. The HGM intensity,
either THG or SHG, at the epidermis or dermis would be enhanced due to the reduction of the light scattering
in SC. Our study also attributes different optical clearing effects of 100% and 50% glycerol to different resulting
homogeneities as well as dissimilar diffusion depths.
Results
Optical clearing effect of 100% glycerol immersion. First, we discuss the results of Case E100-I90,
which was under the most frequently studied condition by using 100% glycerol immersion of 90 min. Two skin
tissues were studied, named Case E100-I90-1 (skin of scalp) and Case E100-I90-2 (skin of armpit). After the
glycerol application, the transparency of the skin was highly enhanced, and the hair inside the skin became vis-
ible (Fig. 1).
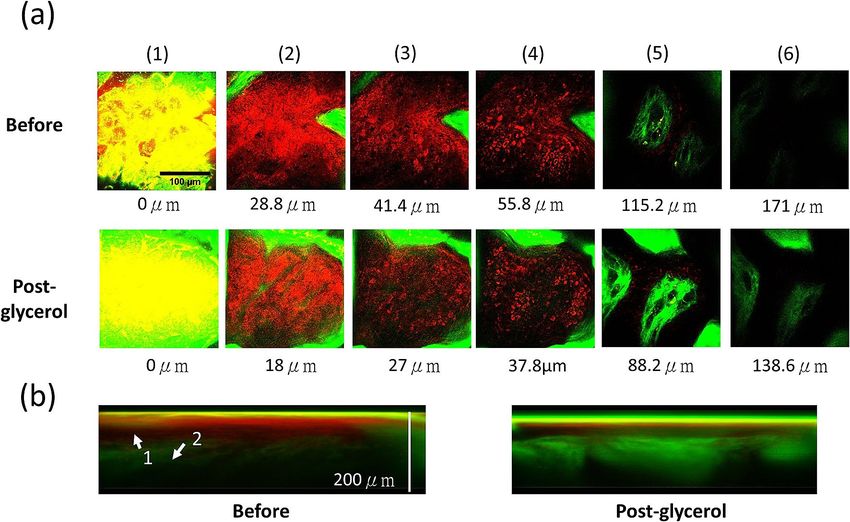
Figures 2 and 3 showed representative HGM stack images at different skin layers before (Before) and after
(Post-glycerol) the glycerol application. In both cases, the THG (red) intensity and contrast in the epidermis
decreased. While in the dermis, the SHG (green) intensity of the collagen strongly increased54. Similar to the
Case E100-I90-1, the THG provided cell structure at the viable epidermis of the Case E100-I90-2 became less
visible after the glycerol application, in contrast to the much-enhanced SHG intensity in the dermis54. The green
signal at the sample surface was attributed to autofluorescence leakage due to residual dye from a marker pen.
Figures 4 and 5 show the statistical analysis of the THG and SHG intensities in Case E100-I90. For THG,
the average intensities reduced significantly at superficial levels (SC, and the viable epidermis) but increased
significantly at deep levels (the reticular dermis) in Case E100-I90-1. While in Case E100-I90-2, the average THG
intensities reduced significantly only at SC. For SHG, the average SHG intensities increased at all three positions
in both Case E100-I90-1 and Case E100-I90-2.
Table 1 recorded the structure analysis results of all studied cases. For Case E100-I90-1, after 100% glycerol
immersion, only the depth of the top reticular dermis layer was found with a significant difference, which
increased by only 7%. In contrast, in the Case E100-I90-2, the skin shrank significantly at all layers. In previous
studies, the anhydrous glycerol was proved to make the skin shrink9,10,12. However, we only found significant
shrinkage of the skin in Case E100-I90-2. The skin of the armpit was softer than the skin of the scalp to make it
shrink more severely.
Besides Table 1, we summarize all the statistical analysis results on the THG and SHG image intensities in
Tables 2 and 3, separately.
From the bright-field images, we observed that after glycerol application the skin became transparent and the
hair inside the deep area was more visible in both skin tissues (Fig. 1). Glycerol is with a higher refractive index
(1.47) than extracellular and intracellular fluids (1.34–1.36). After immersion the skin tissues into anhydrous
glycerol, glycerol diffused inside and filled all of the skin tissues to create a higher refractive index matching
environment for the scattering particles (such as organelles, protein fibrils, membranes, protein globules, with
refractive index 1.39–1.4755,56). Therefore, the light scattering was reduced and the image depth increased. This
result is similar to and supported by the previous research of G. Vargas et al. in 1999, by observing the rat skin
after the glycerol application12. By using spectrophotometer and OCT they proved that glycerol will diffuse into
the skin to decrease the refractive index mismatch. This result also correlates with many previous s tudies8,18,57.
Scientific Reports | (2021) 11:329 | https://doi.org/10.1038/s41598-020-77889-z 2
Vol:.(1234567890)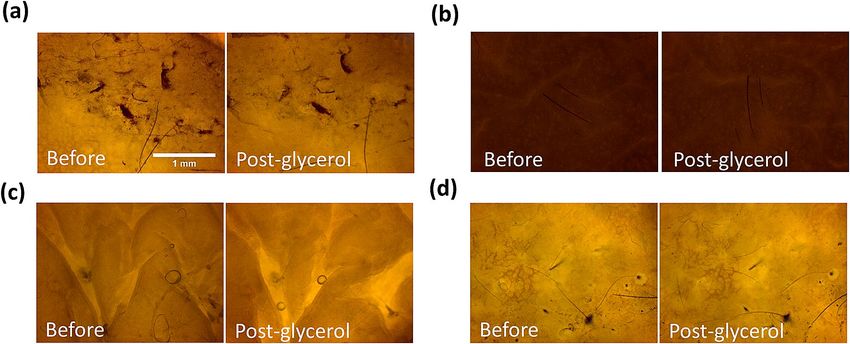
www.nature.com/scientificreports/

                                 Figure 2.  Ex vivo HGM images of Case E100-I90-1, with 100% glycerol immersion. (a) En face HGM images
                                 of (1) Top layer of the SC. (2) Bottom layer of the SC. (3) Middle layer of the viable epidermis. (4) Basal layer.
                                 (5) Middle layer of the papillary dermis. (6) Top layer of the reticular dermis. Scale bar = 100 μm. (b) Transverse
                                 HGM images. The significant depth difference of the reticular dermis layer is attributed to the sample shrinkage
                                 post glycerol immersion. Arrow 1: Epidermis; Arrow 2: Dermis.

                                 Figure 3.  Ex vivo HGM images of Case E100-I90-2, with 100% glycerol immersion. (a) En face HGM images of (1)
                                 Top layer of the SC, (2) Bottom layer of the SC, (3) Middle layer of the viable epidermis, (4) Basal layer, (5) Middle
                                 layer of the papillary dermis, and (6) Top layer of the reticular dermis. Scale bar = 100 μm. (b) Transverse HGM
                                 images. In the layer of SC, the strong two-photon fluorescence leakage of the residue marking dye into the SHG
                                 channel is observable and is not included in our SHG analysis. The significant depth difference of the corresponding
                                 layer is attributed to the sample shrinkage post glycerol immersion. Arrow 1: Epidermis; Arrow 2: Dermis.

Scientific Reports |   (2021) 11:329 |                https://doi.org/10.1038/s41598-020-77889-z                                                      3

                                                                                                                                                 Vol.:(0123456789)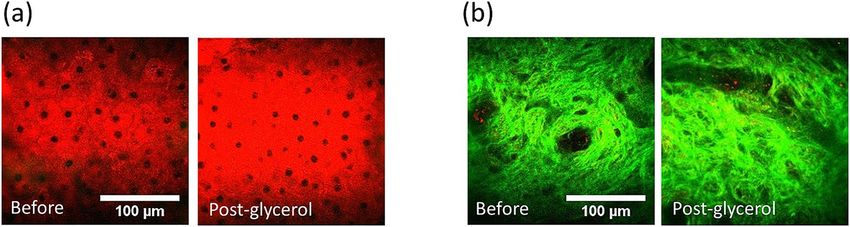
www.nature.com/scientificreports/
Figure 4. Quantitative analysis and comparison of skin THG intensities at five different depths. Black: Case
E100-I90-1 (Before: N = 8, Post-glycerol: N = 8); Red: Case E100-I90-2 (Before: N = 9, Post-glycerol: N = 9). Inset
shows an enlarged view of the statistical result. *P < 0.05; **P < 0.01; *** P < 0.001. Before: before treatment; Post-
glycerol: after treatment.
Figure 5. Quantitative analysis and comparison of skin SHG intensities at three different depths. Black: Case
E100-I90-1 (Before: N = 8, Post-glycerol: N = 8); Red: Case E100-I90-2 (Before: N = 9, Post-glycerol: N = 9).
*P < 0.05; ** P < 0.01; *** P < 0.001. Before: before treatment; Post-glycerol: after treatment.
With much-reduced scattering and higher transparency in the studied samples, one expects an obvious
increase of the SHG intensity at deeper dermis layers. Scattering in skin tissues will not only results in a decrease
of excitation intensity, but also defocus the point spread function. The combined effect will not only cause SHG
and THG signals to decrease, but will also degrade the system resolution and contrast with increased imaging
depth58. As a result, in both samples of 100% glycerol immersion, we witnessed that the SHG image intensity
in the dermis was greatly enhanced after the optical clearing. Combining with the observed higher sample
transparency, we attributed the SHG enhancement to the effect that the excitation light was able to travel down
to deep regions of the skin with less energy decrement and less wavefront distortion. Moreover, the reduction
of scattering also makes it easier for SHG signals to travel back to the detector. Our SHG results correlate well
with previous OC studies.
Besides excitation intensity and point spread function58, THG intensities also strongly depend on the refrac-
tive index mismatch inside the excitation f ocus59,60. After the glycerol application, the OC effect will not only
restore the excitation light and allow easier collection of the generated nonlinear signals, as been indicated by the
SHG intensity recovery, but will also decrease the refractive index mismatch. These two different mechanisms
will compete for the THG intensity. For 100% glycerol immersion cases, THG intensity decreased in epidermis
while increased or remain the same in dermis, indicating that refractive index matching is the dominant effect in
Scientific Reports | (2021) 11:329 | https://doi.org/10.1038/s41598-020-77889-z 4
Vol:.(1234567890)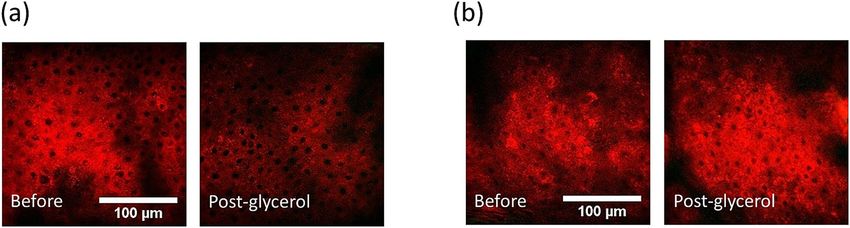
www.nature.com/scientificreports/

       Depth or thickness change                                                                                   Depth of middle papillary      Depth of top reticular
       (μm)                           Thickness of SC    Thickness of viable epidermis Depth of basal layer        dermis layer                   dermis layer
Case E100-I90 (immersion in 100% glycerol for 90 min)
                  Before (N = 8)      13.7 ± 4.6         54.9 ± 13.4                     68.6 ± 13.0               113.0 ± 9.1                    156.6 ± 8.8
1
            Post-glycerol (N = 8)     12.6 ± 4.6         50.6 ± 7.5                      63.2 ± 11.6               116.1 ± 7.8                    168.5 ± 13.4*
                  Before (N = 9)      30.0 ± 2.4         29.2 ± 3.5                      59.2 ± 3.9                114.2 ± 6.7                    167.8 ± 13.3
2
            Post-glycerol (N = 9)     21.6 ± 4.5***      20.4 ± 5.3***                   42.0 ± 4.2***              87.0 ± 5.2***                 131.0 ± 10.5***
Case E50-I90 (immersion in 50% glycerol for 90 min)
                  Before (N = 6)      12.0 ± 3.4         15.3 ± 3.7                      27.3 ± 4.8                 66.6 ± 10.4                   108.0 ± 30.9
1
            Post-glycerol (N = 6)      7.5 ± 1.4*        15.0 ± 5.7                      22.5 ± 5.4                 66.0 ± 16.9                   105.0 ± 16.1
                 Before (N = 12)      30.6 ± 3.0         27.8 ± 5.8                      58.4 ± 4.5                109.1 ± 5.1                    158.7 ± 10.1
2
           Post-glycerol (N = 12)     18.0 ± 3.5***      35.1 ± 6.8**                    53.1 ± 8.3                120.8 ± 4.4***                 187.7 ± 6.0***
Case E50-T90 (topical applied 50% glycerol for 90 min)
                  Before (N = 8)      22.1 ± 4.8         33.8 ± 6.1                      55.8 ± 6.3                 95.4 ± 5.4                    134.1 ± 12.7
1
            Post-glycerol (N = 8)     13.3 ± 1.6***      42.3 ± 6.5*                     55.6 ± 7.0                 94.1 ± 9.0                    132.3 ± 12.6
                 Before (N = 10)      33.3 ± 4.6         34.9 ± 6.2                      68.2 ± 4.8                122.9 ± 9.2                    176.4 ± 17.3
2
           Post-glycerol (N = 10)     18.0 ± 3.1***      40.1 ± 6.0                      58.1 ± 5.8***             120.8 ± 5.7                    182.5 ± 9.7
                  Before (N = 9)      12.2 ± 2.0         53.8 ± 12.4                     66.0 ± 10.8                93.4 ± 15.1                   120.4 ±13.7
3
            Post-glycerol (N = 9)     13.0 ± 1.5         57.2 ± 7.8                      70.2 ± 8.3                 92.2 ± 12.2                   113.4 ± 17.6
                  Before (N = 7)      27.3 ± 9.0         63.2 ± 8.1                      90.5 ± 6.8                116.8 ± 8.6                    145.0 ± 15.9
4
            Post-glycerol (N = 7)     15.1 ± 2.8***      55.5 ± 7.0*                     70.5 ± 6.8***             102.6 ± 7.8***                 133.5 ± 15.1

                                     Table 1.  Skin structure analysis results of all studied cases. (*P < 0.05, ** P < 0.01, *** P < 0.001).

                                                                          Middle viable epidermis                       Middle papillary dermis     Top reticular dermis
                                      THG intensity      Bottom of SC     layer                          Basal layer    layer                       layer
                                      Case               E100-I90 (100% Immersion)
                                      1                  ▽ (**)           ▽ (*)                          –              –                           △ (***)
                                      2                  ▽ (**)           –                              –              –                           –
                                      Case               E50-I90 (50% Immersion)
                                      1                  –                –                              –              △ (**)                      △ (*)
                                      2                  △ (***)          △ (***)                        △ (**)         △ (**)                      –
                                      Case               E50-T90 (50% Topical Application)
                                      1                  –                –                              –              –                           –
                                      2                  △ (***)          △ (*)                          △ (*)          △ (*)                       –
                                      3                  –                –                              –              △ (*)                       –
                                      4                  △ (***)          △ (***)                        △ (***)        –                           –

                                     Table 2.  Statistical analysis result on the THG intensity variation after the glycerol application. −: no
                                     significant difference, △: Increased significantly, ▽: Decreased significantly, *P < 0.05, ** P < 0.01, *** P < 0.001.

                                      SHG intensity      Middle papillary dermis layer         Top reticular dermis layer         SHG Maximum
                                      Case               E100-I90 (100% Immersion)
                                      1                  △ (**)                                △ (*)                              △ (*)
                                      2                  △ (**)                                △ (**)                             △ (***)
                                      Case               E50-I90 (50% Immersion)
                                      1                  △ (*)                                 △ (*)                              △ (*)
                                      2                  △ (*)                                 △ (***)                            △ (***)
                                      Case               E50-T90 (50% Topical Application)
                                      1                  –                                     △ (*)                              △ (*)
                                      2                  –                                     △ (*)                              △ (*)
                                      3                  –                                     –                                  –
                                      4                  –                                     –                                  –

                                     Table 3.  Statistical analysis result on the SHG intensity variation after the glycerol application. −: no
                                     significant difference, △: Increased significantly, ▽: Decreased significantly, *P < 0.05, ** P < 0.01, *** P < 0.001.

Scientific Reports |      (2021) 11:329 |                        https://doi.org/10.1038/s41598-020-77889-z                                                                     5

                                                                                                                                                                           Vol.:(0123456789)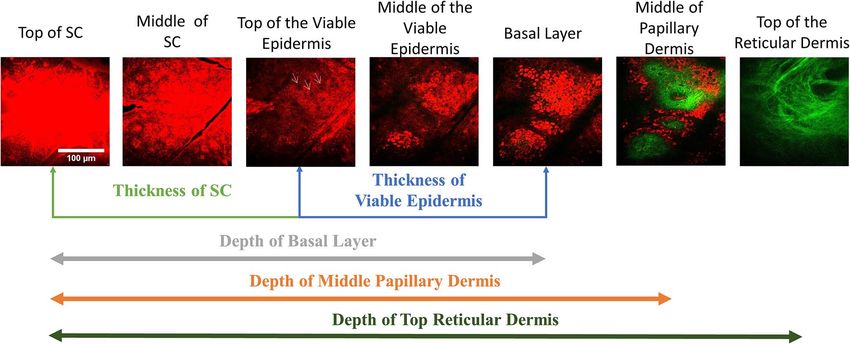
www.nature.com/scientificreports/
Figure 6. Optical clearing with 50% glycerol immersion. (a) SHG images of dermis (scale bar = 100 μm), and
(b) bright field images. (scale bar = 1 mm). This example belongs to Case E50-I90-2. Before: before immersion;
Post-glycerol: after immersion.
Figure 7. THG intensity variation at the middle epidermis layer of (a) Case E100-I90-1 with 100% glycerol
and (b) Case E50-I90-2 with 50% glycerol. Before: before immersion; Post-glycerol: after immersion. Scale
bar = 100 μm.
epidermis to determine the THG intensity due to the shallow penetration depth. Although glycerol will greatly
enhance the homogeneity of the tissue and reduce the THG radiation, in the deeper layer like dermis, a strong
reduction of scattering of the whole epidermis will result in a strong increment of excitation intensity and thus
eventually the detected THG photons. As a result, the THG image intensity increased or remained the same in
dermis after optical clearing.
Dehydration and tissue shrinkage were frequently observed during optical clearing in previous studies55,61,62.
In Case E100-I90-2, tissue shrinkage was observed. It is known that the strong affinity of glycerol would make
the water flux out tissues and lead to dehydration, with different permeability coefficients of water and glycerol,
which are on the order of 10−2 cm/min and 10−5 cm/min, respectively. This difference made more water flux
out than glycerol enter the skin, causing the tissue volume d ecrease32. By moving the skin structure toward the
surface due to shrinkage, one could also expect to see improved image intensities.
Optical clearing effect of 50% glycerol immersion. In the case of 50% glycerol application with
immersion of 90 min, one might expect a lower OC effect due to the lower glycerol concentration. Under the
bright light microscopy (Fig. 6), the sample transparency after 50% glycerol immersion was less than that after
100% glycerol immersion. On the other hand, although with its lower refractive index (1.398)63 and lower dehy-
dration power compared to 100% glycerol, we found that the 50% glycerol was also able to decrease the scatter-
ing in the tissue, evidenced not only by the improved transparency after immersion, but also by the significantly
increased SHG intensity in dermis (Fig. 6). Our studies of two samples indicated greatly enhanced SHG intensi-
ties in dermis after the optical clearing (Table 3).
The most significant difference between these two different concentrations is the variation of the THG inten-
sity, as shown in Fig. 7. In the middle epidermis layer, for a case of 100% glycerol immersion (Case E100-I90-1),
the average THG intensity reduced 13%. However, for a specific case of 50% glycerol immersion (Case E50-I90-
2), the average THG intensity increased 30%. Different from all cases of 100% glycerol immersion, of which the
THG intensity greatly decreased in the epidermis after OC, the THG intensity of all 50% immersion cases either
increased or remained the same (Table 2). As discussed above, the THG intensity is affected by the refractive
index mismatch inside the excitation f ocus59,60. The 50% glycerol has a lower osmolarity than 100% g lycerol8,63
and cannot introduce such a high homogeneous environment as the 100% glycerol. The optical clearing power
of 50% glycerol is also known to be less than the 100% glycerol. As a result, for 50% glycerol immersion, there
was a compromise for THG intensity between the decrement of the light scattering and the decrement of the
refractive index mismatch. The less decrement of refractive index mismatch and the recovery of the light intensity
and quality made the THG intensity enhanced or remain the same after the OC. Besides, in both two tissues
of the 50% immersion cases, the thickness of the SC all greatly decreased by at least 37.5%, which would also
make the detection of THG signal easier. In the skin tissue with thicker SC, Case E50-I90-2, the THG intensity
Scientific Reports | (2021) 11:329 | https://doi.org/10.1038/s41598-020-77889-z 6
Vol:.(1234567890)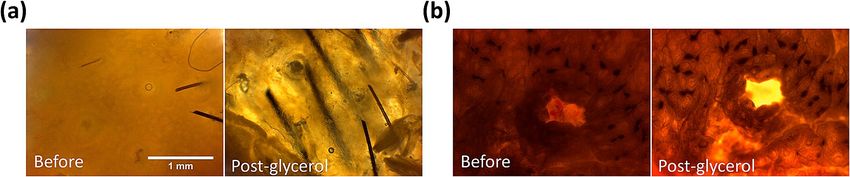
www.nature.com/scientificreports/
Figure 8. Bright field images of human skin before (Before) and after (Post-glycerol) 50% glycerol topical
application. (a) Case E50-T90-1 (b) Case E50-T90-2 (c) Case E50-T90-3 (d) Case E50-T90-4. Scale bar = 1 mm.
even increased in dermis. To sum up, by immersed the skin tissue inside the 50% glycerol, we could not only
enhance the SHG intensity but also the THG intensity and the THG image in epidermis can be better resolved.
Optical clearing effect of 50% glycerol topical application. To study the OC potential for in vivo
clinical applications, the final aim of this work is to investigate the OC effect of ex vivo human skin by using
50% glycerol with noninvasive topical application, while immersion studies above served as calibration with
previous reports. Four skin tissues from different volunteers were included, which were the skin of forehead,
buttock, chest, and temporal. After the 50% glycerol topical application, only two tissues were found with the
statistically-significant SHG enhancement in dermis (forehead, buttock; Table 3). On the other hand, the aver-
age SHG in all tissues were found to be higher after the topical applications, even without statistical significance.
As a result, the signal recovery effect of 50% glycerol topical application is less than the 50% and 100% glycerol
immersion. In the bright light image, the transparency of all four skin tissues was slightly improved, showing less
decrement of the scattering when compared to the immersion case with 50% glycerol (Fig. 8) and confirming
our SHG finding.
Our study supports the OC effect through 50% glycerol topical application. As in comparison with the immer-
sion case, which is impossible for in vivo clinical applications, the clinical applicable topical application is with
a less effective OC effect. In the case of topical application, the glycerol solution can diffuse into the epidermis
only through the barrier function of SC, which greatly reduces the penetration of the glycerol solution. As we did
not observe any SC-thickness (before application) dependence (Table 1) on the SHG enhancement, the sample-
dependent OC results might come from: (1) Variation of the SC permeability at different parts of the s kin64–66;
(2) Different skin conditions of different volunteers, therefore causing different skin barrier functions. On the
other hand, we did observe one interesting phenomenon related to SC, that is, among all four tissue samples,
three were found to be with a much decreased (at least 40%) SC thickness, including cases 1, 2, and 4. The only
exception sample was with an extremely thin SC layer (12 μm-thick), which left no room for further shrinkage
after OCA application. For these three SC-shrinking samples, we either observed recovered SHG signals in
dermis, or recovered THG signals in epidermis, indicating the critical role of SC during optical clearing after
topical application. We thus propose that if one can reduce the thickness of SC through OC, the SHG or THG
intensity underneath the SC layer will then have a potential to be rescued. Our study further supports that with
50% glycerol topical application of 90 min, one is capable to decrease the thickness of SC, if the thickness of SC
is greater than 22 μm.
In contrast to the fact that there is no SC-thickness dependence (Table 1) on the SHG enhancement, in
our studied cases by using 50% glycerol with either immersion or topical application, we found SC-thickness
dependence (Table 1) on the THG enhancement in epidermis. The epidermal THG signal was increased after 50%
glycerol application for all samples with a SC layer thicker than 27 μm, including cases E50-I90-2, E50-T90-2, and
E50-T90-4. This might be due to the fact that the skin tissue with a thick SC layer suffers stronger light scattering
so that the OC effect is more pronounced. Our observation also suggests the important role of SC to affect the
epidermal THG signal after OC. To further investigate the role of SC in OC effects, we additionally performed an
OC experiment by using 100% glycerol with topical application. In previous studies, high concentration glycerol
was proved to be with a slower permeation rate than lower concentration g lycerol8. It can be described by the
Fick’s law, in which the skin permeability is inversely proportional to the glycerol concentration17. Based on the
lower penetration rate with its higher viscosity and the stronger OC effect as compared to the 50% glycerol, the
100% glycerol was applied on the skin surface for 30 min, in contrast to the 90 min, to provide the OC effect in
SC only (named: Case E100-T30). The results of the Case E100-T30 were presented in Table 4. Representative
HGM skin images were presented in Fig. 9.
Our result supports the OC effect through 100% glycerol topical application. The average THG intensities
greatly increased at all skin layers except the top reticular dermis layer. For SHG, the average SHG intensity of
Scientific Reports | (2021) 11:329 | https://doi.org/10.1038/s41598-020-77889-z 7
Vol.:(0123456789)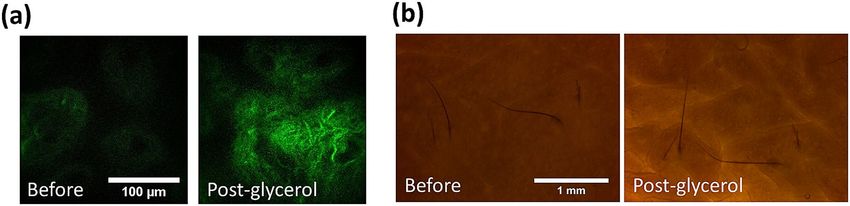
www.nature.com/scientificreports/
Case E100-T30
Thickness of viable Depth of middle papillary Depth of Top reticular
Depth or thickness (μm) Thickness of SC epidermis Depth of basal layer dermis layer dermis layer
Before (N = 10) 13.5 ± 0.9 17.3 ± 4.3 30.8 ± 4.7 60.1 ± 6.0 88.7 ± 13.2
Post-glycerol (N = 10) 13.5 ± 2.6 21.6 ± 2.4* 35.1 ± 3.3* 67.0 ± 8.0* 98.1 ± 16.9
Middle viable epidermis Middle papillary dermis
THG intensity Bottom of SC layer Basal layer layer Top reticular dermis layer
After the applying glycerol △ (***) △ (***) △ (***) △ (***) –
Middle papillary dermis
SHG intensity layer Top reticular dermis layer SHG maximum
After the applying glycerol △ (*) – –
Table 4. Variation of skin structure, THG intensity, and SHG intensity after 100% glycerol topical application
for 30 min. −: no significant difference, △: Increased significantly, ▽: Decreased significantly, *P < 0.05,
** P < 0.01, *** P < 0.001.
Figure 9. (a) The variation of the THG image intensity at middle epidermis layer after 100% glycerol topical
application for 30 min. (b) The variation of the SHG image intensity at top reticular dermis layer after
100% glycerol topical application for 30 min. Before: before treatment; Post-glycerol: after treatment. Scale
bar = 100 μm.
the papillary dermis also showed significant increment (Table 4). Even though with the method of the topical
application, 100% glycerol solution cannot diffuse as far as the immersion case and the optical clearing is less
effective, 100% glycerol seems to provide a better SC effect of thin SC layer, in comparison with 50% glycerol,
thus increasing the laser excitation power in layers beneath as well as the back-reflection signals. The fact that
glycerol did not reach the viable epidermis can be evidenced by the enhanced THG intensities through the
viable epidermis.
Discussions
The aim of the current paper is to study the optical clearing effect of 50% glycerol through topical application
due to the fact that 50% glycerol, rather than 100% glycerol, is safe for in vivo human skin applications and
been allowed as human skincare products. During our study, we did not remove the stratum corneum layer. As
a result, we found the critical role of stratum corneum shrinkage for the recovery of the SHG and THG images
in human skin. Optical clearing of human skin has been widely studied in previous papers. Some of the papers
focus on comparing different OCAs, the others investigate the mechanisms behind the OC. Most of the previous
studies normalize the image intensity to determine the penetration d epth17,34 and compares the average intensity
8,30
before and after OCA a pplication , few of them adopted the statistical analysis like in this study. However, the
conclusion might be different under different analysis procedures. For example, in this study, it is noted that the
mean SHG intensities all increase after OC at the middle papillary dermis layer, top reticular dermis layer, and
SHG maximum layer in all studied 9 cases, even though some of increment might not be statistically significant.
The mean SHG intensity of all studied cases is shown in Table 5.
Although OC have been investigated by many previous studies, the effects and the mechanisms of 50% glyc-
erol after topical application in human skin are not well understood. In this paper, we first combined the SHG
and THG microscopy images to study the OC effect of skin. The ultrahigh spatial resolution of HGM provided
more details regarding the skin OC effect.
In our studied case of 100% glycerol immersion, the glycerol diffused into the skin and made it more homo-
geneous to reduce the light scattering. The THG intensity depends strongly on refractive index mismatch and
will vanish in homogeneous media. The 100% glycerol greatly enhanced the tissue homogeneity and the observed
THG intensities were therefore decreased. With a better epidermal tissue homogeneity and reduced scattering
reduction, we also observed enhanced SHG intensities in the underlying dermis. We attributed the enhanced
SHG in dermis to the OC effect in epidermis. It is noted that in a previous paper, decreased SHG intensity was
Scientific Reports | (2021) 11:329 | https://doi.org/10.1038/s41598-020-77889-z 8
Vol:.(1234567890)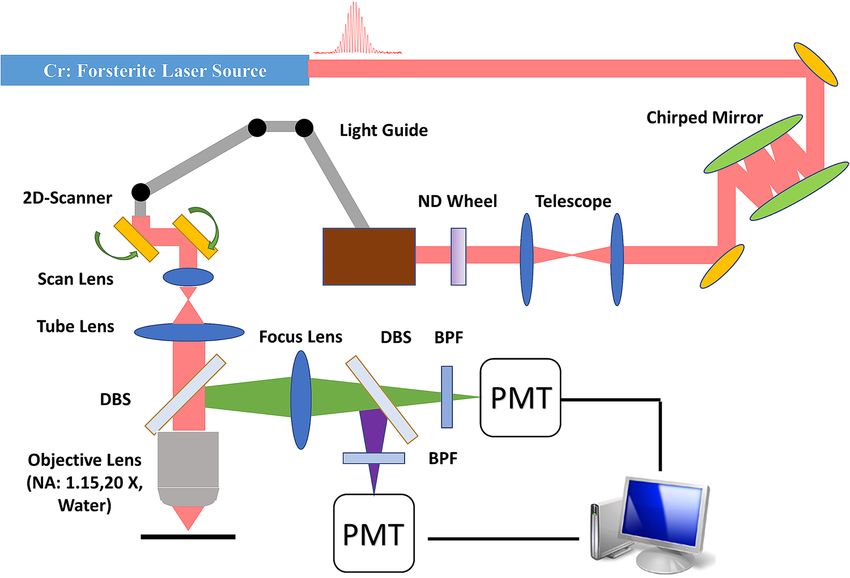
www.nature.com/scientificreports/
Middle papillary dermis Top reticular dermis
Case number Group layer layer SHG Maximum
Case E100-I90
Before (N = 8) 691 756 839
1
Post-glycerol (N = 8) 810** 1210* 1434*
Before (N = 9) 764 577 844
2
Post-glycerol (N = 9) 1258** 839** 1490***
Case E50-I90
Before (N = 6) 1156 957 1246
1
Post-glycerol (N = 6) 2552* 3918* 4093*
Before (N = 12) 768 930 1002
2
Post-glycerol (N = 12) 887* 1386*** 1444***
Case E50-T90
Before (N = 8) 966 1522 1702
1
Post-glycerol (N = 8) 1092 2346* 2594*
Before (N = 10) 711 795 841
2
Post-glycerol (N = 10) 755 1070 1141
Before (N = 9) 1411 1547* 1701*
3
Post-glycerol (N = 9) 1458 1819 1909
Before (N = 7) 949 1377 1419
4
Post-glycerol (N = 7) 1079 1493 1547
Case E100-T30
Before (N = 10) 2366 3692 3789
1
Post-glycerol (N = 10) 3138* 4050 4362
Table 5. Mean SHG intensities (arbitrary unit) of all studied cases at the middle papillary dermis layer, top
reticular dermis layer, and SHG maximum layer. (*P < 0.05, ** P < 0.01, *** P < 0.001).
reported after O C67. Different from our experimental condition, Yeh et al. studied the rodent skin by removing
the epidermis and then applying glycerol. They concluded that the reversible dissociative effect by glycerol on
collagen may be one of the mechanisms of OC. We regard that the main mechanism in our case is different from
Yeh since we preserve the complete epidermis. Furthermore, we did not find the dissociation of collagen in our
HGM observation. We also studied the cases of the 50% glycerol by immersion or topical application since it is
a safe concentration to apply on the human skin. In both methods, we observed the enhancement of the SHG
intensities, rather than decrement, but the OC is less effective by topical application.
Three OC mechanisms were mentioned in previous studies: the refractive index matching8,18,57, the
dehydration5,10,11,55, and the shrinkage of the tissue11,32. In our research, we found that the refractive index match-
ing and the tissue shrinkage are the main mechanisms affecting the optical clearing efficacy. Besides, the stratum
corneum plays an important role to achieve the optical clearing. For THG signal enhancement in the epidermis,
SC acts the most important role. After the topical applications with the 50% glycerol, we observed stronger OC
effect in thicker SC skin tissues, accompanying significant SC shrinkage. In conclusion, we achieve the optical
clearing of human skin by using the 50% glycerol with the topical application. The results of this study suggest
the potential of 50% glycerol for future clinical OC topical applications, especially for skin with a thick SC layer.
Methods
Sample preparation. All skin samples were surgical samples from the National Taiwan University Hospital
(NTUH). The patients included were aged 20 to 85 years, had Fitzpatrick skin type III or IV. After removing the
lesion part of the excised skin, we choose the non-lesional human skin samples of which the remaining surface
areas were larger than 0.5*0.5 cm2 for experiments. The skin samples were not limited to any specific area of the
human body to maximize the study cases. The skin sample were taken from scalp (case E100-I90-1, E50-I90-
1), axilla (case E100-I90-2), buttock (case E50-I90-2, E50-T90-2), forehead (case E50-T90-1), chest (case E50-
T90-3), and left temporal area (case E50-T90-4). The study protocol and safety risks associated were reviewed
and approved by the research ethics committee at NTUH (No. 201804100DINA) and Taiwan Food and Drug
Administration (TFDA). All research was performed in accordance with relevant guidelines and regulations. All
volunteers participating in the optical clearing experiment provided informed consent.
Fresh samples from the surgery room were received within one hour after the excision and we removed the
fat tissues under the dermis. We stored samples in saline and kept it at 4 °C to prevent dehydration as well as
to remove blood from the skin surface. Before imaging, we soaked the skin sample in fresh saline and then left
it under the room temperature for at least 30 min to standardized the initial conditions of all samples in order
to get reproducible results. To study the optical clearing of the fresh skin tissue, we completed all experiments
within 24 h after the skin was excised from the patient.
Scientific Reports | (2021) 11:329 | https://doi.org/10.1038/s41598-020-77889-z 9
Vol.:(0123456789)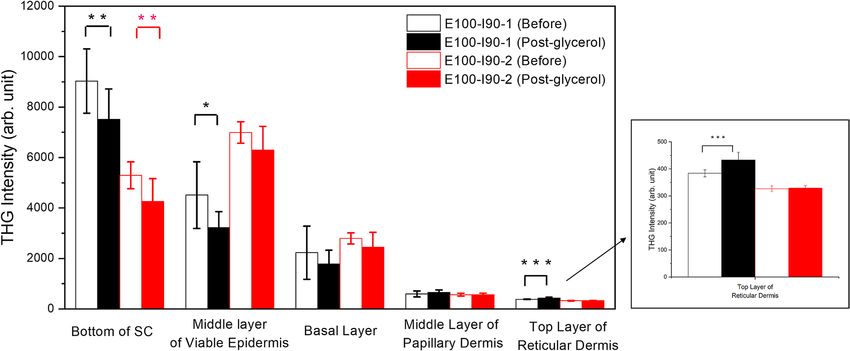
www.nature.com/scientificreports/
Figure 10. The schematic diagram showing the harmonic generation microscope system. DBS Dichroic beam
splitter, BPF Band-pass filter, PMT Photomultiplier tube, ND neutral density.
Optical clearing agents. We chose glycerol as the OCA in our experiments, because it is one of the most
popular OCAs in previous studies11,27,30,32,33,38. Glycerol was purchased from Sigma-Aldrich (Product Number:
G2289) which meets USP testing specifications. For 100% glycerol experiments, we used pure glycerol. For 50%
(V/V) glycerol solutions, we mixed pure glycerol with deionized water of the same volume.
Experimental apparatus. For bright-field imaging, we used LEICA ICC50 HD (bright-field trans-illumi-
nation microscopy) to document the visual changes on the skin tissue before and after the optical clearing. The
eyepiece for CCD was set on 10×/20 combining with the 4×/0.10 objective lens to provide 40 times magnified
skin images. Variation of the sample transmission can be observed by bright-field images.
For HGM imaging of human skin, the system setup is shown in Fig. 10. A homemade femtosecond
Cr:forsterite laser was used as the light source to provide 1262 nm at the central wavelength68. The ultrashort
pulse duration (38 fs) of this laser makes it ideal to generate efficient harmonic signals at the focal point. Double
chirped mirrors69 were utilized to compensate for the dispersion of the optical system for the shortest pulse
width in human skin. A telescope (New port, KPX193 AR18) was used to collimate the laser light to maintain
the beam size after a long traveling path. The excitation power of the laser can be adjusted and maintained via
a ND wheel (New port, 50FS02DV.2). The light guide, which is critical for the human clinical study, was able to
move the HGM microscope conveniently to image different areas of the human skin. The 2D scanner was a com-
bination of a resonant 8 kHz mirror and a galvanometer mirror to generate 2D scans (Thorlabs Laser Scanning
Essentials Kit). The scan lens and tube lens not only increased the beam size to make it fulfill the back aperture
of the objective lens but also formed a 4f system to make tilted scanning light go back to the back aperture of
the objective lens. The laser light was focused in the human skin by an objective lens (Olympus, UApoN340,
NA = 1.15). The SHG (630 nm) and THG (410 nm) signal would be generated at the focal point and the signal
will be collected by the same objective lens. The first dichroic beam splitter (DBS) (Thorlabs/ DMLP900L) was
used to reflect the harmonic signals collected by the objective lens and the second DBS (Thorlabs/ DMLP505R)
was used to separate the signals of SHG (630 nm) and THG (410 nm). The signals of the SHG and THG will be
detected by two individual photomultiplier tubes (PMTs) (Hamamatsu/R928 for SHG and Hamamatsu/R4220P
for THG) with band-pass filters (BPF) inserted (Semrock FF02-617/73 for SHG and Semrock FF01-417/60). The
objective lens was attached to a 3D stepping motor (Sigma Koki/TSDM40-15X) which can move the imaging
plane through computer control. Following Ref.69, the pulse group delay dispersion (GDD) at the illumination
plane after the objective was − 60 f s2, corresponding to a pulsewidth of 28 fs. Since it has been reported that the
chromatic dispersion value of water with lipid at 1300 nm is zero70 and the group velocity dispersion value of
water71 at 1262 nm as − 47 fs2/mm, we thus expect that the GDD value of 300-μm-thick skin tissues at 1262 nm
is on the order of − 10 f s2n so that its effect on lengthening the 1262 nm pulse duration is negligible.
Study protocol. Before the glycerol application, we took the bright-field images and HGM images of the
skin sample. Then we applied the glycerol by immersing the whole sample into the solution or topically applied
by slightly brush the solution on the epidermal side of the skin. After the glycerol application, we took the bright-
filed images and HGM images of the skin sample again as post-glycerol. The condition and parameters of both
Scientific Reports | (2021) 11:329 | https://doi.org/10.1038/s41598-020-77889-z 10
Vol:.(1234567890)www.nature.com/scientificreports/
Case type Agent Method Application time Subjects
E100-I90 100% Glycerol Immersion 90 min 2
E50-I90 50% Glycerol + 50% dd H2 O Immersion 90 min 2
E50-T90 50% Glycerol + 50% dd H2 O Topical 90 min 4
Table 6. Three different case types of the ex vivo optical clearing study.
the imaging system were maintained the same during all the measurements. Three different case types were
studied in this research (Table 6). We first studied the case of 100% immersion due to its well-understood and
promising OC effect. Two tissues from different parts of the skin from different volunteers were included. Lower
concentration glycerol was found less effective8,17,28,33 and the effect was not well-studied in previous works. We
thus compared the OC effect of 50% glycerol with immersion with the case of 100% glycerol. Two tissues from
different parts of the skin from different volunteers were included in the second case type. To further study the
OC potential of the safe 50% glycerol with topical application, four tissues from different parts of the skin from
different volunteers were included. The results of the third case type, 50% glycerol with topical application, will
help future in vivo human skin trials. As 100% glycerol might be harmful to human skin which is not helpful for
the in vivo human skin trials, we did not use it for topical application.
Imaging protocol. For HGM imaging, we took en face 2D images (235 μm × 235 μm; 512 × 512 pixels) of
the skin at different depths with a 1.8 μm vertical step size between images ranging from the stratum corneum
to the reticular dermis to form one 3D image stack. The 2D pixel size is 460 nm, which is close to the previously
measured lateral resolution in live human s kin72. The average power of the laser after the objective was 100 mW,
same as previous in vivo clinical trials42–48,54. With a laser repetition rate of 105 MHz, the corresponding pulse
energy was 0.95 nJ per pulse, with a maximum pulse fluence of 0.18 J/cm2 at the focal spot and a corresponding
scanning power density of 181 W/cm2 at the sample plane. Under the same experimental conditions, pervious
clinical studies indicated that the nonlinear photodamage for 1260-nm is far below the threshold to cause the
DNA damage and can be n egligible42–48,54. After HGM imaging of the same imaging condition, previous in vivo
clinical studies reported that there was no erythema, pigmentation, crust, or vesicular formation, nor does the
volunteer feels heat or discomfort42–48,54. For each sample, at least six image stacks acquired at different points
of the skin were collected. The number depended on the size of each sample. With a system frame rate of 30
frame/s, each en face 2D image were averaged with 15 frames. The THG modality can provide information about
the morphological structure of the epidermis54,73, but the signal is relatively weak to image the collagen in the
dermis. On the contrary, the SHG modality can provide the information of collagen fi bers54 in the dermis. It is
noted that for fair comparison, we have fixed the PMT voltages to be the same throughout the comparison study.
In order to get a reasonable image quality in deep layers, the pixel intensity in the uppermost layer (SC) might
thus be saturated, which would affect the intensity comparison analysis of SC but not the structure analysis
on the layer depth. Furthermore, the image intensity was strongly affected by the imaging system alignment.
To ensure a fair comparison, instead of normalization, all the presented pre- and post-glycerol images were
acquired by the same system setting which is under a tight performance control, while the operating conditions
were constantly checked and confirmed to be the same before and after the glycerol application by taking the
images of a calibration sample (gallium nitrite grown on top of double-side polished sapphire substrate), which
can generate strong and stable SHG signal on the thin gallium nitrite layer74.
Analysis procedure. The group information will be blinded before the analysis. The person (JHL) who
analyzed the HGM image didn’t know whether the stack was from before or post-glycerol. We analyzed two dif-
ferent types of parameters from the HGM skin images to study the effects of the optical clearing, which are the
thickness of the skin layers (structure analysis) and the harmonic generation intensities (intensity analysis). The
images of THG and SHG modalities were presented with red and green false colors. The images were processed
and analyzed using Image J (National Institutes of Health, https://imagej.nih.gov/ij/).
Structure analysis: Thickness variation of the skin tissue after the introduction of OCAs was proved as one
of the most important mechanisms in previous studies. Shrinkage or swelling of tissues will affect the scattering
coefficient32. After the glycerol application, glycerol solution might diffuse into the skin and cause dehydration
so as to make the skin shrink. However, the variation of thickness might be different in different layers of the
skin (skin structure for the top to the bottom: the stratum corneum, viable epidermis, papillary dermis, and
reticular dermis75) and might result in different optical clearing efficacies. Five different parameters related to
the layer thickness were investigated, which are the thickness of SC, the thickness of viable epidermis, depth of
the basal layer, depth of the middle papillary dermis layer, and depth of the top reticular dermis layer48,69. On the
top of the SC, the strongest THG signal will be generated. We defined the top layer of the SC as where the THG
signal started to appear. The thickness of the SC is counted from the top layer of SC to the top layer of the viable
epidermis. The top of the viable epidermis (or the bottom of SC) is defined as the number of the existing dark
nuclei of the skin epidermis image is more than six. The thickness of the viable epidermis is counted from the
top layer of the viable epidermis to the stratum basale layer, which shows strong THG signals of the cytoplasm
due to m elanin76,77. In the area of papillary dermis, the collagen fibers start to appear and show the strong SHG
54
signal . Beneath the papillary dermis, the much thicker reticular dermis is composed of dense collagen fibers.
We choose the first skin layer, beneath the papillary dermis, that completely lacks the signal of basale lamina
Scientific Reports | (2021) 11:329 | https://doi.org/10.1038/s41598-020-77889-z 11
Vol.:(0123456789)www.nature.com/scientificreports/
Figure 11. The HGM images of human skin obtained at different depths showing different skin structures.
THG and SHG are shown with false red and green colors. The definitions of 5 different parameters related to the
layer thickness are displayed. SC Stratum corneum. Scale bar: 100 μm. White arrow: cells.
as the top of the reticular dermis. The middle papillary dermis layer is defined as the central layer between the
stratum basale layer and the top reticular layer (Fig. 11).
Intensity analysis: The intensity analysis in this study is quite different from the analysis that frequently
used in some previous studies. Although provided with a stack of images at different skin depths, we are not
going to compare the intensity at the same skin depth before and after the glycerol application by plotting the
depth-dependent intensity diagram. After the application of glycerol, layer depth will follow the variation of
structures (for example, shrinkage), and it is unsuitable to compare the image intensity at the same depth since
the image intensity will be affected by the shift of the layer depth. Based on the high 3D resolution and label-free
characteristic of the HGM that enables us to distinguish different skin sub-layers, we implemented the position
correction to achieve the image intensity comparison of the same skin structures before and after the glycerol
application. We recorded and compared the average THG intensities of five different skin layers before and post-
glycerol applications, which include the bottom of stratum corneum, the middle layer of the viable epidermis,
the basal layer, the middle layer of the papillary dermis, and the top layer of the reticular dermis. The average
SHG intensities of three different depths were recorded, which were the middle layer of papillary dermis, the
top reticular dermis, and the layer with the maximum SHG intensity.
The result of the skin thickness and the HGM image intensity was expressed as mean ± standard deviation.
Independent sample t-test was used for comparisons. Statistics were performed with the excel software (Microsoft
office 2013), and P < 0.05 was considered statistically significant.
Received: 18 June 2020; Accepted: 30 September 2020
References
1. Forli, A. et al. Two-photon bidirectional control and imaging of neuronal excitability with high spatial resolution in vivo. Cell. Rep.
22, 3087–3098 (2018).
2. Spalteholz, W. Über das Durchsichtigmachen von menschlichen und tierischen Präparaten und seine theoretischen Bedingungen,
nebst Anhang (S. Hirzel, Leipzig, 1914).
3. Tuchin, V. V. et al. Light propagation in tissues with controlled optical properties. J. Biomed. Opt. 2, 401–417 (1997).
4. Liu, H., Beauvoit, B., Kimura, M. & Chance, B. Dependence of tissue optical properties on solute-induced changes in refractive
index and osmolarity. J. Biomed. Opt. 1, 200–212 (1996).
5. Rylander, C. G. et al. Dehydration mechanism of optical clearing in tissue. J. Biomed. Opt. 11, 041117. https : //doi.
org/10.1117/1.2343208 (2006).
6. Rommel, C. E. et al. Contrast-enhanced digital holographic imaging of cellular structures by manipulating the intracellular refrac-
tive index. J. Biomed. Opt. 15, 041509. https://doi.org/10.1117/1.3449567 (2010).
7. Plotnikov, S. et al. Optical clearing for improved contrast in second harmonic generation imaging of skeletal muscle. Biophys. J.
90, 328–339 (2006).
8. Sdobnov, A., Darvin, M. E., Lademann, J. & Tuchin, V. A comparative study of ex vivo skin optical clearing using two-photon
microscopy. J. Biophotonics 10, 1115–1123 (2017).
9. Mao, Z., Zhu, D., Hu, Y., Wen, X. & Han, Z. Influence of alcohols on the optical clearing effect of skin in vitro. J. Biomed. Opt. 13,
021104. https://doi.org/10.1117/1.2892684 (2008).
10. Yu, T., Wen, X., Tuchin, V. V., Luo, Q. & Zhu, D. Quantitative analysis of dehydration in porcine skin for assessing mechanism of
optical clearing. J. Biomed. Opt. 16, 095002. https://doi.org/10.1117/1.3621515 (2011).
11. Genin, V. et al. Ex vivo investigation of glycerol diffusion in skin tissue. JBPE 7, 825–842 (2016).
12. Vargas, O., Chan, E. K., Barton, J. K., Rylander, H. G. & Welch, A. J. Use of an agent to reduce scattering in skin. Laser Surg. Med.
24, 133–141 (1999).
13. Majdzadeh, A., Wu, Z., Lui, H., McLean, D. I. & Zeng, H. Investigation of optically cleared human skin in combined multiphoton
and reflectance confocal microscopy. Opt. Life Sci. https://doi.org/10.1364/NTM.2015.NM4C.6 (2015).
14. Song, E. et al. Optical clearing assisted confocal microscopy of ex vivo transgenic mouse skin. Opt. Laser Technol. 73, 69–76 (2015).
Scientific Reports | (2021) 11:329 | https://doi.org/10.1038/s41598-020-77889-z 12
Vol:.(1234567890)www.nature.com/scientificreports/
15. Cicchi, R., Pavone, F. S., Massi, D. & Sampson, D. D. Contrast and depth enhancement in two-photon microscopy of human skin
ex vivo by use of optical clearing agents. Opt. Express 13, 2337–2344 (2005).
16. Samatham, R., Wang, N. K. & Jacques, S. L. Investigation of the effect of hydration on dermal collagen in ex vivo human skin tissue
using second harmonic generation microscopy. Photon. Therap. Diagn. XII. https://doi.org/10.1117/12.2214040 (2016).
17. Son, T. & Jung, B. Cross-evaluation of optimal glycerol concentration to enhance optical tissue clearing efficacy. Skin Res. Technol.
21, 327–332 (2015).
18. Wang, R. K., Xu, X., Tuchin, V. V. & Elder, J. B. Concurrent enhancement of imaging depth and contrast for optical coherence
tomography by hyperosmotic agents. J. Opt. Soc. Am. B 18, 948–953 (2001).
19. Sdobnov, A. Y., Tuchin, V. V., Lademann, J. & Darvin, M. E. Confocal Raman microscopy supported by optical clearing treatment
of the skin—influence on collagen hydration. J. Phys. D Appl. Phys. 50, 285401. https://doi.org/10.1088/1361-6463/aa77c9 (2017).
20. Choi, B. et al. Determination of chemical agent optical clearing potential using in vitro human skin. Lasers Surg. Med. 36, 72–75
(2005).
21. Vargas, G., Chan, K. F., Thomsen, S. L. & Welch, A. J. Use of osmotically active agents to alter optical properties of tissue: Effects
on the detected fluorescence signal measured through skin. Lasers Surg. Med. 29, 213–220 (2001).
22. Galanzha, E. I. et al. Skin backreflectance and microvascular system functioning at the action of osmotic agents. J. Phys. D Appl.
Phys. 36, 1739. https://doi.org/10.1088/0022-3727/36/14/313 (2003).
23. Chernova, S. P., Natal’ya, V. K., Pravdin, A. B. & Tuchin, V. V. Dynamics of optical clearing of human skin in vivo. Proc. SPIE 4162,
227–235 (2000).
24. Vargas, G., Readinger, A., Dozier, S. S. & Welch, A. J. Morphological changes in blood vessels produced by hyperosmotic agents
and measured by optical coherence tomography. Photochem. Photobiol. 77, 541–549 (2003).
25. Khan, M. H. et al. Optical clearing of in vivo human skin: Implications for light-based diagnostic imaging and therapeutics. Lasers
Surg. Med. 34, 83–85 (2004).
26. Proskurin, S. G. & Meglinski, I. V. Optical coherence tomography imaging depth enhancement by superficial skin optical clearing.
Laser Phys. Lett. 4, 824–826 (2007).
27. Mao, Z., Han, Z., Wen, X., Luo, Q. & Zhu, D. Influence of glycerol with different concentrations on skin optical clearing and
morphological changes in vivo. Fiber Opt. Commun. Sens https://doi.org/10.1117/12.823310 (2009).
28. Xu, X. & Zhu, Q. Feasibility of sonophoretic delivery for effective skin optical clearing. IEEE Trans. Biomed. Eng. 55, 1432–1437
(2008).
29. Xu, X. & Zhu, Q. Sonophoretic delivery for contrast and depth Improvement in skin optical coherence tomography. IEEE J. Sel.
Top. Quantum Electron. 14, 56–61 (2008).
30. Fox, M. A. et al. Dermal scatter reduction in human skin: A method using controlled application of glycerol. Lasers Surg. Med. 41,
251–255 (2009).
31. Xu, X., Zhu, Q. & Sun, C. Assessment of the effects of ultrasound-mediated alcohols on skin optical clearing. J. Biomed. Opt. 14,
034042. https://doi.org/10.1117/1.3156827 (2009).
32. Wen, X., Mao, Z., Han, Z., Tuchin, V. V. & Zhu, D. In vivo skin optical clearing by glycerol solutions: Mechanism. J. Biophoton. 3,
44–52 (2010).
33. Zhong, H. et al. In vitro study of ultrasound and different-concentration glycerol-induced changes in human skin optical attenu-
ation assessed with optical coherence tomography. J. Biomed. Opt. 15, 036012. https://doi.org/10.1117/1.3432750 (2010).
34. Guo, X. et al. In vivo comparison of the optical clearing efficacy of optical clearing agents in human skin by quantifying perme-
ability using optical coherence tomography. Photochem. Photobiol. 87, 734–740 (2011).
35. Hovhannisyan, V., Hu, P. S., Chen, S. J., Kim, C. S. & Dong, C. Y. Elucidation of the mechanisms of optical clearing in collagen
tissue with multiphoton imaging. J. Biomed. Opt. 18, 046004. https://doi.org/10.1117/1.JBO.18.4.046004 (2013).
36. Wang, R.K., et al. Optical clearing of in vivo human skin with hyperosmotic chemicals investigated by optical coherence tomogra-
phy and near-infrared reflectance spectroscopy International Conference on Advanced Laser Technologies: Biomedical Optics 5486,
129–135 (2004)
37. Larin, K. V. et al. Optical clearing for OCT image enhancement and in-depth monitoring of molecular diffusion. IEEE J. Sel. Top
Quant. Electron. 18, 1244–1259 (2012).
38. Fluhr, J. W. et al. Glycerol accelerates recovery of barrier function in vivo. Acta Derm. Venereol. 79, 418–421 (1999).
39. Bissett, D. L. & Mcbride, J. F. Skin conditioning with glycerol. J .Soc. Cosmet. Chem. 35, 345–350 (1984).
40. Chu, S. W. et al. Multimodal nonlinear spectral microscopy based on a femtosecond Cr: Forsterite laser. Opt. Lett. 26, 1909–1911
(2001).
41. Anderson, R. R. & Parrish, J. A. The optics of human skin. J. Invest. Dermatol. 77, 13–19 (1981).
42. Tsai, M. R. et al. Differential diagnosis of nonmelanoma pigmented skin lesions based on harmonic generation microscopy. J.
Biomed. Opt. 19, 036001. https://doi.org/10.1117/1.JBO.19.3.036001 (2014).
43. Lee, J. H., Shih, Y. T., Wei, M. L., Sun, C. K. & Chiang, B. L. Classification of established atopic dermatitis in children with the
in vivo imaging methods. J. Biophoton. 12, e201800148. https://doi.org/10.1002/jbio.201800148 (2019).
44. Liao, Y. H. et al. In vivo third-harmonic generation microscopy study on vitiligo patients. J. Biomed. Opt. 25, 014504. https://doi.
org/10.1117/1.JBO.25.1.014504 (2019).
45. Liao, Y. H. et al. Quantitative analysis of intrinsic skin aging in dermal papillae by in vivo harmonic generation microscopy. Biomed.
Opt. Express 5, 3266–3279 (2014).
46. Ho, Y. H., Pan, Y., Sun, C. K. & Liao, Y. H. Presence of intralesional melanocytes as a histopathological feature of actinic keratosis
based on in vivo harmonic generation microscopy in Asians. Photodermatol. Photoimmunol. Photomed. https://doi.org/10.1111/
phpp.12595(2020).
47. Lin, K. H., Liao, Y. H., Wei, M. L. & Sun, C. K. Comparative analysis of intrinsic skin aging between Caucasian and Asian subjects
by slide-free in vivo harmonic generation microscopy. J. Biophotonics 13, e201960063. https://doi.org/10.1002/jbio.201960063
(2020).
48. Liao, Y. H. et al. Determination of chronological aging parameters in epidermal keratinocytes by in vivo harmonic generation
microscopy. Biomed. Opt. Express 4, 77–88 (2013).
49. Tsafas, V. et al. Polarization-dependent second-harmonic generation for collagen-based differentiation of breast cancer samples.
J. Biophoton. 13, e202000180. https://doi.org/10.1002/jbio.202000180 (2020).
50. Gavgiotaki, E. et al. Nonlinear imaging of female breast tissue biopsies. Eur. Conf. Biomed. Opt. https://doi.org/10.1117/12.25262
85 (2019).
51. Tokarz, D. et al. Intravital imaging of osteocytes in mouse calvaria using third harmonic generation microscopy. PLoS ONE 12,
e0186846. https://doi.org/10.1371/journal.pone.0186846 (2017).
52. You, S. et al. Intravital imaging by simultaneous label-free autofluorescence-multiharmonic microscopy. Nat. Commun. 9, 2125.
https://doi.org/10.1038/s41467-018-04470-8 (2018).
53. Becker, L. C. et al. Safety assessment of glycerin as used in cosmetics. Int. J. Toxicol. 38, 6S-22S. https://doi.org/10.1177/10915
81819883820 (2019).
54. Chen, S. et al. In vivo virtual biopsy of human skin by using noninvasive higher harmonic generation microscopy. IEEE J. Sel. Top
Quantum Electron. 16, 478–492 (2010).
Scientific Reports | (2021) 11:329 | https://doi.org/10.1038/s41598-020-77889-z 13
Vol.:(0123456789)You can also read