Measurement of the Angular Distribution of Wavelength-Shifted Light Emitted by TPB
←
→
Page content transcription
If your browser does not render page correctly, please read the page content below
Measurement of the Angular Distribution of Wavelength-Shifted Light
Emitted by TPB
J. Schrott1,2 , M. Sakai1,2 , S. Naugle1,2 , G. D. Orebi Gann1,2 ,
S. Kravitz1,2 , D. McKinsey1,2 , R.J. Smith1,2
1
University of California, Berkeley
2
arXiv:2108.08239v2 [physics.ins-det] 27 Oct 2021
Lawrence Berkeley National Laboratory
July 2020
Abstract
We present measurements of the angular distribution of
re-emitted light from tetraphenyl butadiene thin films
when exposed to 128 nm light, which is the peak of the
liquid Argon (LAr) scintillation spectrum, in vacuum.
Films ranging from 250 nm to 5.5 µm in thickness are
measured. All films were fabricated by evaporation de-
position on ultraviolet transmitting (UVT) acrylic sub-
strates. Preliminary comparisons of the angular dis-
tribution to that produced by a detailed Monte Carlo
model are also presented. The current shortcomings of
the model are discussed and future plans briefly out-
lined.
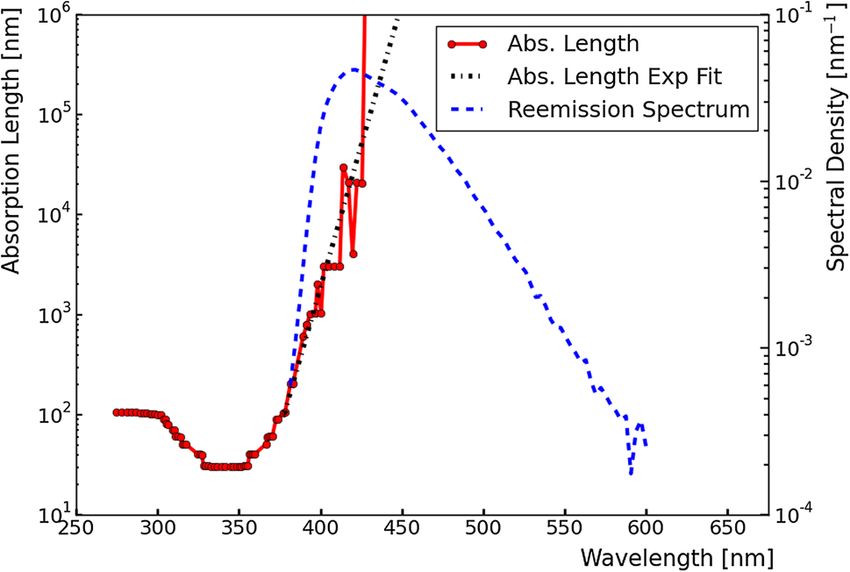
1 Introduction Figure 1: Scintillation spectra for various noble gases. The
spectral transmittance of materials used in some common
Noble liquid (NL) radiation detectors are a widely used optical windows are also shown [33].
tool in modern particle physics experiment. These
detectors enable a variety of research programs rang-
ing from neutrino physics [1, 2] and dark matter ing NL detectors to be used as so-called time projection
searches [3–20] to other rare-event measurements [21– chambers [1].
31]. In recent years, significant effort has been commit- In concert with the research efforts mentioned above,
ted to exploring how large-scale NL detectors can an- there are pushes to better understand materials that
swer pressing questions in these fields. Numerous such comprise the inner volumes of NL detectors. As designs
detectors have been proposed, and several are already are refined, accurate modeling of the optics of these ma-
operational or projected to be in the near future [1, terials becomes an important limiting factor in search-
13, 20, 26, 31, 32]. Unsegmented monolithic NL detec- ing for new physics. In particular, those materials which
tors enjoy better self shielding than water or organic strongly affect light collection must be well-understood.
scintillators and have typical photon yields of 20,000 to Despite their wide use, NL detectors are burdened
40,000 photons/MeV, leading to excellent energy reso- by the fact their scintillation light is deep in the ultra-
lution and low energy thresholds. Because of the par- violet (UV) wavelength regime (178 nm for Xenon and
ticular process by which NLs scintillate, involving ex- down to approximately 80 nm for Helium or Neon). Fig-
cited dimer molecules, they are also highly transparent ure 1 shows the scintillation emission spectra of several
to their own scintillation light and therefore make very NLs as well as the transmittances of some materials
scalable detectors. Yet another feature are the long re- commonly used in optical windows [35]. Light below
combination times observed of free electrons produced 160 nm is heavily absorbed by most optical windows and
when charged particles collide with and ionize atoms in cannot be detected by typical photo-multiplier tubes
an NL. These electrons can drift large distances through (PMTs). Figure 2 shows the wavelength dependent
a liquid volume when an electric field is applied, allow- sensitivities of some common photo-cathode materi-
1
re-emitted light from evaporation-deposited TPB films
                                                                 on acrylic when exposed to 128 nm light, which is the
                                                                 peak of the liquid argon (LAr) scintillation spectrum.
                                                                 Past measurements of the relative intensity of transmit-
                                                                 ted and reflected light through a TPB film on a silicon
                                                                 substrate have been made [44], and these measurements
                                                                 are consistent with the data taken in this study. In
                                                                 this paper, measurements of the angular distribution of
                                                                 re-emitted light are made for multiple TPB film thick-
                                                                 nesses ranging from 250 nm to 5.5 µm.
                                                                    Both the integral of the angular distribution of re-
                                                                 emitted light and the ratio of transmitted and reflected
                                                                 light from a TPB film as functions of film thickness
                                                                 are of interest for those hoping to maximize the light
                                                                 collection efficiencies of their detectors. In a detector
                                                                 configuration with TPB applied to the outer surface of
Figure 2: Typical radiant sensitivities of some common           a PMT window, the ideal behavior of the TPB is to
photo-cathode materials [34].                                    maximize the (shifted) transmitted light. In addition
                                                                 to being a useful measurement in its own right, the an-
                                                                 gular distribution of re-emitted light can in theory be
                                                                 used to extract important micro-physical optical prop-
                                                                 erties of TPB via comparison to a detailed Monte Carlo
                                                                 (MC) model. Therefore these measurements can inform
                                                                 how TPB is modeled in future optical simulations. The
                                                                 methodology of such a MC study is outlined in Sec-
                                                                 tion 6.
                                                                    Section 2 provides an overview of the hardware and
                                                                 basic operation of the experimental apparatus. Sec-
                                                                 tion 3 details the fabrication of TPB film samples. Sec-
                                                                 tion 4 discusses the measurements used to account for
                                                                 backgrounds and degradation of the optical components
                                                                 from UV exposure. Section 5 presents the data and
                                                                 results from this study. Section 6 presents prelimi-
                                                                 nary comparisons of the data to the angular distribu-
Figure 3: Spectral absorption length (red) and re-emission
spectral density (blue) of TPB [35].                             tions produced by a micro-physical MC model. Sec-
                                                                 tions 7 and 8 are conclusions and acknowledgments re-
                                                                 spectively.
als [34]. A critical element of some NL detectors is the
use of wavelength-shifting materials to absorb and re-
emit scintillation light at more readily detectable wave-        2    Experimental Apparatus
lengths.
                                                                 This section describes the optical elements used to pro-
   A popular wavelength shifter is tetraphenyl butadi-
                                                                 duce the monochromatic light incident on the TPB sam-
ene (TPB), which can be deployed in numerous ways
                                                                 ples. The apparatus used in this study builds upon
in the inner volume of an NL detector. Incoming scin-
                                                                 two former experiments conducted at Lawrence Berke-
tillation photons are absorbed by TPB and then re-
                                                                 ley National Laboratory; namely a previous study of
emitted at detectable wavelengths before they are inci-
                                                                 the micro-physical optical properties of TPB [35] and a
dent on a PMT. Figure 3 shows both the re-emission
                                                                 more recent project known as the Immersed BRIDF (bi-
spectrum and wavelength dependent absorption length
                                                                 directional reflectance intensity distribution function)
of TPB [35].
                                                                 Experiment in Xenon (IBEX), which investigated the
   Previous studies have produced measurements of var-
                                                                 optical reflectivity of PTFE in both vacuum and liquid
ious optical properties of TPB including the absorption
                                                                 xenon [32]. The apparatus used in this study is the
and emission spectra, timing of re-emitted light, and in-
                                                                 same as that used in the latter, and the basic arrange-
trinsic quantum efficiency of a single TPB molecule [33,
                                                                 ment of the optical chain remains unchanged. Figure 4
35–48]. However, the angular distribution of re-emitted
                                                                 shows a schematic of the apparatus. The optical chain
light has not been fully explored. This paper presents
                                                                 begins with a McPherson Model 632 light source [49],
the first measurement of the full angular distribution of
                                                                 which produces light in the 115 nm to 400 nm wave-

                                                             2
Figure 5: Quantum efficiency of the Hamamatsu R6041-
06 photo multiplier tube (purple) along with the re-emission
spectral density of TPB (blue) [34].
Figure 4: Schematic of the experimental apparatus when
viewed from above. The orange line represents the beam of
broad spectrum light produced at the source and focused were exclusively positioned normal to the incident beam
onto the diffraction grating. The purple line represents the
in this study, the ability to rotate the sample holder is
monochromatic, 128nm beam illuminating the TPB film.
The blue arrows diverging from the sample represent the
crucial for calibration of the sample holder dial and val-
wavelength shifted light after absorption and re-emission by idation of the MC geometry. The sample holder can
the TPB. The PMT viewing angle θ can be adjusted with a simultaneously hold four different samples aligned ver-
stepper motor. tically. It can be moved up and down to choose which
sample to illuminate or to lift the entire holder out of
the optical chain (all while under vacuum).
length range. This broad spectrum light is focused with Initial amplification of the raw PMT signal is done
a McPherson Model 615 focusing elbow through a ver- with a Phillips Scientific Model 777 low noise ampli-
tical slit and onto a McPherson Model 234/302 Vac- fier. A LeCroy Model 623B discriminator defines the
uum Ultraviolet Monochromator, which can be adjusted triggering threshold and outputs square wave trigger
to reflect monochromatic light of a desired wavelength pulses. The trigger pulses are amplified once more and
into the main vacuum chamber. The wavelength dis- sent to a rate meter that integrates and outputs an
tribution of the resulting beam is less than 10 nm full analog voltage logarithmically proportional to the rate
width at half maximum. In the main vacuum cham- of the discriminator output. The signal from the rate
ber, the monochromatic light is collimated before hit- meter output is finally digitized and piped to a Lab-
ting the TPB sample housed in an aluminum sam- View module. Small corrections are made to the signal
ple holder. Pictures of the apparatus are provided in in LabView to account for non-linearities between the
Kravitz (2020) [32]. The entire optical chain is housed PMT rate and signal response up to O(MHz), which is
in vacuum. roughly the maximum observed rate in this apparatus.
In the TPB film, the UV light may be absorbed and The threshold of the discriminator was set to a con-
re-emitted. The re-emitted light is wavelength shifted stant value which attempts to minimize the number of
and distributed according to the spectrum shown in Fig- triggers on false events and maximize counting of real
ure 3. This re-emitted light can then be collected by a photon pulses.
Hamamatsu R6041-06 PMT whose viewing angle rela- Of all the elements in the optical chain, only the PMT
tive to the beam path can be varied from 25° to 185°, rotation axis and sample holder rotation axis are fixed
with 180° corresponding to the PMT facing straight into in place. The beam therefore had to be aligned so as to
the beam if the TPB sample were removed from the be incident on the center of the sample holder. A dis-
optical chain. The aperture of the PMT is 0.965 cm in cussion of the alignment procedures used in this study
diameter and subtends a solid angle of 4π ·3×10−4 from is found in Kravitz (2020) [32].
the center of the TPB film. The quantum efficiency of
the PMT is shown in Figure 5. The adjustable PMT
viewing angle allows for the measurement of the angular 3 Sample Fabrication
distribution of re-emitted photons.
The TPB sample can also be rotated about the axis TPB is an opaque organic material that forms small
coming out of the page in Figure 4. While TPB films crystal domains in the solid state. High purity TPB
3Table 1: List of all TPB thin film samples and their mea-
sured thicknesses using a profilometer.
1500
Top
1250 Top-middle
Middle
Sample Thickness (µm) Uncertainty (µm)
1000 Bottom-middle
Height [nm]
+0.07
Bottom SN114 0.24 −0.07
750
+0.21
SN105 0.57 −0.14
500 +0.13
SN104 0.60 −0.13
250 +0.05
SN107 1.31 −0.05
0 +0.07
SN108 2.55 −0.06
0.25 0.50 0.75 1.00 1.25 1.50 +0.09
SN111 3.68 −0.08
Stylus scan distance [mm]
+0.28
SN112 5.32 −0.28
Figure 6: Thickness uniformity check of the TPB film. +0.15
SN113 5.39 −0.15
The thickness was measured at five locations on the same
TPB film spaced in uniform intervals from one edge of the
film (Top) through the middle of the film (Middle) to the
diametrically opposing edge (Bottom). The measurements substrate. No Kapton tape was used for the fabrication
are overlaid here with arbitrary offsets along the horizontal of the production data samples. The slightly smaller
axis. All five thickness measurements depicted by the height radius of the film leaves the peripheral edge of the sub-
of the step are consistent with each other. The large spikes strate exposed so profilometer scans can be made at the
are likely caused by specs of dust on the TPB surface. TPB-acrylic boundary. These profilometer scans were
performed twice for each sample at two diametrically
opposite locations at the circumference of the film. The
can readily be purchased in powder form. In this study,
results of these two measurements were averaged to des-
films were fabricated on 1-inch diameter acrylic sub-
ignate a single thickness for each sample. A list of TPB
strates by heated evaporation deposition of pure TPB
samples used in this study is presented in Table 1 along
powder. The thickness of the films can be controlled by
with their measured thicknesses.
varying the amount of evaporated TPB as well as the
The stylus force used during the profilometer scans
distance between the substrate and heated TPB source.
can be adjusted. It was confirmed that using a force
In this study, a Tectra Mini Coater was used at a source-
of 1 mg × 9.8 m/s2 or less is weak enough to prevent
substrate distance of 4.2 in.
damage of the TPB film. This was done by compar-
To verify the scale, uniformity, and reproducibility of
ing the angular distribution of re-emitted light from
sample film thicknesses, samples were scanned with a
a TPB sample before and after scans using different
KLA-Tencor D-600 profilometer (also known as Alpha-
forces. The re-emission performance of the film was
Step) at the Marvell Nanofabrication Laboratory at UC
unaffected to within uncertainties by the scan. All film
Berkeley. The profilometer uses a stylus that is physi-
thickness scans for samples presented in this study were
cally placed on the TPB surface and dragged across it
performed within this permissible force range.
to measure its topography. Although the surface of an
acrylic substrate can vary by as much as 100 nm from
flat, it was found that evaporation deposition nonethe- 4 Measurements
less produces films of uniform thickness. This was con-
firmed by fabricating a test sample with a thin strip A complete measurement of the angular distribution of
of Kapton tape covering the middle of the substrate. re-emitted light from a TPB film involves three distinct
The TPB was deposited and the Kapton tape removed types of measurement to account for backgrounds and
to reveal a TPB-acrylic boundary that ran through the systematic effects. A list of the different measurements
middle of the sample. A profilometer step-height scan is given below. A description of the full measurement
was made at five locations uniformly spaced along this procedure follows and a flowchart summarizing this pro-
boundary, as shown in Figure 6, to confirm that the film cedure is given in Figure 7.
thickness near the center of the sample was consistent
with that near the circumference. This particular test • TPB Re-emission Measurement
showed a thickness of (566 ± 6) nm or, equivalently, a This is the signal measurement. The PMT rate is
variation of 1 %. measured every five degrees in viewing angle from
The TPB films used for production data were coated 25° to 185° with the beam on and the TPB sam-
on identical 1-inch diameter, circular UVT acrylic sub- ple placed in front of the beam at normal inci-
strates in a 0.9-inch diameter area concentric with the dence. Typical rates at a viewing angle near 180°
4are O(10 kHz).
• Dark Rate Measurement
x3
This is a PMT dark-rate and stray-light back-
ground measurement. The PMT rate is measured
every five degrees in viewing angle from 25° to 185°
with the lamp off and the TPB sample lifted out
of the main vacuum chamber. Typical rates at any xN samples
given viewing angle are O(10 Hz).
• Contamination Measurement
This measures the small amount of visible “con-
tamination” light in the UV beam and is used to
monitor UV induced degradation of optical com-
ponents (Sections 4.3 and 4.4). The PMT rate is
measured at 179°, 180°, and 181° with the beam on
and the TPB sample lifted out of the main vacuum
chamber. Typical rates at the viewing angle 180°
are O(1 kHz).
4.1 Data taking procedure
Once the apparatus is under vacuum, the following steps
are taken to realize a complete measurement of the an-
gular distribution of re-emitted light from a TPB film.
First, a dark rate measurement is made at the start of
Figure 7: Flow chart summarizing the data taking proce-
any run to record the level of this background. After the
dure.
dark rate measurement, the lamp is turned on and left
to heat up for 30 minutes so its output is stable. With
the lamp stabilized, a contamination measurement is The second instability has a characteristic time on
made. After the contamination measurement, the de- the order of tens of seconds. It can be accounted for in
sired TPB sample can be placed in front of the beam at the following way. For a single PMT rate measurement,
normal incidence. With the TPB in front of the beam, 50 PMT rate readings are sampled within . 1 s and fit
a TPB re-emission measurement is taken. Immediately with a Gaussian in LabView. Ideally these 50 measure-
after the angular distribution measurement, the sample ments look Poissonian. Occasionally, the distribution
is removed from the beam path and another contami- is bi-modal, indicating that PMT instability has inter-
nation measurement is made, identical to the first. The fered with the measurement. The criterion employed
average of the integrals of the two contamination mea- for the distribution having a well-defined central value
surements is used to normalize TPB angular distribu- is that the mean of a fitted Gaussian must be within
tions taken at different times. Normalizing to contami- the interquartile rank of the distribution. If this is not
nation corrects for the degradation of the lamp window the case, the 50 readings are re-sampled. As an addi-
due to UV exposure (Section 4.3). Additional TPB re- tional cross check, for each scan across angles, the full
emission measurements are performed, interleaved with scan is repeated three times and the results for a given
contamination measurements, for a frequent monitor of angle averaged, with an additional uncertainty included
potential UV degradation. After data-taking is con- to account for the spread between measurements. This
cluded, a second dark rate measurement is performed procedure is followed for signal, dark rate, and contam-
and checked for consistency with the first. ination measurements.
The following sections describe the background and
systematic considerations in more detail.
4.3 Degradation of the deuterium lamp
4.2 PMT stability There are two time dependent degradation effects that
affect rate measurements. First is the degradation of
The PMT exhibits instability on two time scales. The the magnesium fluoride window of the deuterium lamp
first and simpler of the two is a slow, exponential de- due to polymerization of vacuum contaminants while
crease of the PMT dark rate from the moment it is first the lamp is in operation. The second is a gradual degra-
turned on. This is dealt with by letting the PMT sta- dation of the TPB performance. Even after significant
bilize for several hours before taking data.
5use, the degradation of the deuterium lamp can be re-
versed by following a window cleaning procedure avail-
able from its manufacturer, McPherson. However, the
rate of degradation during use was found to be much
greater just after a cleaning than after many hours of
use. It was crucial to ensure the lamp intensity re-
mained stable over the course of a single angular dis-
tribution measurement. Because the lamp output in-
tensity was adequate for measurements even after some
degradation, it was decided to let the lamp degrade to
a point of relative stability where the change in lamp
output over the course of one angular distribution mea-
surement was much smaller than the Poisson statistics
of the measurement. To confirm the lamp output had
advanced to a point of adequate stability, three consecu- Figure 8: Angular distributions of re-emitted light from
tive angular distribution measurements were compared a TPB film taken before (blue) and after (gray) significant
and found to agree within Poisson uncertainties. lamp window degradation. The cluster of points with lower
Although this strategy ensures lamp degradation is intensity at viewing angles 179,180, and 181 are the con-
negligible over the course of one measurement of the tamination measurements taken at the same time as each
angular distribution for one sample, after a number of angular distribution measurement. By scaling the “after”
such measurements the effect can become important. measurement (gray) data such that the sum of the contam-
A strategy was therefore needed to normalize the over- ination measurements is the same for before and after, we
see excellent agreement between the before and after data.
all integral of angular distributions taken for different
This establishes that normalizing to contamination light is
samples at different times to account for long term lamp
justified.
degradation.
A useful measurement for handling this is the photon
rate seen by the PMT when looking directly into the lem of normalizing data taken on different samples at
unobstructed 128 nm beam, referred to in this study different times. If a sample is exposed to a significant
as a contamination measurement. Although the PMT amount of VUV light, its wavelength shifting efficiency
is not sensitive to the dominant 128 nm light from the will degrade and data taken before and after this degra-
beam, it is sensitive to a small amount of longer wave- dation will no longer agree when normalized by contam-
length “contamination” light which leaks in through the ination.
monochromator slit. Tests show the degradation of TPB has a negligible
It was observed that the intensity of this contamina- effect on the angular distribution of re-emitted light
tion light co-varied with the intensity of the dominant when the TPB has only been exposed to vacuum ul-
128 nm light as a function of lamp degradation. This traviolet (VUV) light during a few data taking periods.
was concluded by taking angular TPB re-emission dis- This was verified by taking data multiple times with
tribution measurements with the same sample before a previously unused sample and confirming the angu-
and after significant lamp degradation and normaliz- lar distributions were identical over the course of these
ing to the intensities of the contamination light taken few measurements. To avoid effects caused by TPB
at the two times. When normalized to the contamina- degradation, only samples that had minimal previous
tion light intensity, the angular distributions agree very use were deployed for production data. Moreover, the
well as shown in Figure 8. Thus contamination mea- production TPB samples were stored in a dedicated vac-
surements of the unobstructed 128 nm beam were made uum chamber to avoid prolonged exposure to ambient
before and after every TPB sample measurement, as de- light and moisture. The samples used for production
scribed above. As stated in Section 4.1, the average of data had never been used with the exception of three
the before- and after-contamination measurements was samples (SN104, SN112, SN113) listed in Table 1 that
used to normalize angular distributions taken at differ- were used once before.
ent times, and the fractional difference between the two
was incorporated as an additional uncertainty on the
corresponding angular distribution data.
4.5 Indirect scattering of light
With the lamp in operation, there can also be back-
4.4 Degradation of TPB samples grounds from indirect scattering of longer wavelength
light off of reflective surfaces inside the vacuum cham-
Although several tests prove the contamination light is ber. Both shifted light from the TPB and contami-
a good measure of lamp degradation even after many nation light in the beam can contribute to this back-
hours of “lamp time”, this alone does not solve the prob-
6ground. This effect was estimated by shining the 128 nm
beam onto an 0.635-cm thick aluminum disk in the sam- ×10−2
ple holder in the same configuration as when taking 0.24 µm 1.31 µm 5.32 µm
Normalized rate [arb. units]
TPB data. The magnitude of the effect was confirmed 0.57 µm 2.55 µm 5.39 µm
6
0.60 µm 3.68 µm
to be < 1 % of that seen with the PMT measuring TPB
re-emission.
Because of the concern that reflective surfaces in the 4
stainless steel vacuum chamber may affect measure-
ments, black Acktar “Metal Velvet” foil was used to
2
cover the inner walls of the chamber[50]. The foil sheets
are highly non-reflective in the wavelengths of interest
(≤ 0.2 % specular reflectance and ≤ 1 % hemispherical 0
reflectance). No change in the TPB re-emission mea- 50 100 150
Viewing angle [°]
surement was observed before and after the foil instal-
lation to within uncertainties. Figure 10: Same data as in Figure 9 but with each angular
distribution normalized to unity.
5 Results
Relative intensity (peak normalized)
Table 1 summarizes the TPB film thicknesses used in
this study. This range was chosen to span the thickness
1.0
at which previous works measured the greatest wave-
length shifting efficiency.
Figure 9 shows the angular distributions measured 0.8
from these samples when normalized to contamination
as discussed above. For PMT angles in the range 90° to
0.6 McKinsey et al., 1997
120°, the line of sight from the TPB/acrylic sample to
Benson et al., 2018
the PMT is obstructed by the back edge of the sample Benson et al., Monte Carlo, 2018
holder. This effect has been studied in MC and its im- 0.4 Production TPB samples
pact on the measured distribution is well understood in
0.0 2.5 5.0 7.5 10.0 12.5 15.0
terms of the thickness of the sample holder and angular TPB film thickness [µm]
alignment of the sample holder normal to the beam.
Figure 11: The integrated re-emission intensity of TPB
thin film samples as a function of measured film thickness
×104 in this study is shown in black labeled “Production TPB
1.75
0.24 µm 1.31 µm 5.32 µm samples”. An overlay comparison is made with other pre-
1.50 0.57 µm 2.55 µm 5.39 µm vious studies. The peak values of all data sets shown are
0.60 µm 3.68 µm normalized to unity.
1.25
Rate [Hz]
1.00
spectively). A similar asymmetry has been observed be-
0.75
fore when measuring re-emitted light from TPB films on
0.50 silicon substrates [44]. This asymmetry is much larger
than can be accounted for by scattering of contami-
0.25
nation light in the beam, which give photon rates of
0.00 ≈ 1 kHz exclusively in the narrow PMT viewing angles
50 100 150
Viewing angle [°] subtended by the beam. Figure 10 shows the same data
but with each angular distribution normalized to unity
Figure 9: TPB re-emission intensity as a function of PMT in order to explicitly show the variation in shape. In
viewing angle for a 128 nm beam incident on TPB thin film theory, one expects this asymmetry to be less severe for
samples of varying thickness. All the re-emission measure- thicker samples, in which the re-emitted light is more
ments are normalized to their corresponding contamination likely to undergo a second absorption if it proceeds to-
measurements.
wards the “back” of the TPB sample, but this trend is
not obviously apparent in the data.
An interesting pattern in these angular distributions Figure 11 shows the relative integrals of these dis-
is that more light is detected behind the TPB sam- tributions as functions of sample thickness normalized
ple relative to the beam than on the same side as the to the peak. Using χ2 instead of the peak changes the
beam (described as transmitted and reflected light re- relative normalization of the data by about 5 %. The
7thickness corresponding to the peak wavelength shift-
ing efficiency is consistent with results of past measure-
ments. Previous studies only looked at the re-emitted
light on one side of the TPB sample, so the observed
agreement is not necessarily trivial.
6 Monte Carlo Studies
Previous studies suggest the remission of light from
the bulk of a TPB film happens isotropically [35, 44].
However, the angular distribution of re-emitted pho-
tons from a TPB film is theoretically affected by the
film thickness as mentioned above. Thicker films re-
sult in an angular distribution more heavily populated
at small angles, because fewer absorbed and re-emitted
photons are able to travel through the entire film with-
Figure 12: Rendering of the geometry used to simulate the
out being absorbed a second time.
angular distribution or re-emitted light from TPB films of
This sample-specific effect can in theory be leveraged various thicknesses.
to extract micro-physical properties of TPB by compar-
ing angular distributions for multiple TPB film thick-
nesses to detailed MC simulations.
In this study, a micro-physical MC model of the ex-
periment was made in an attempt to explore such an
analysis. The simulation was built using the RAT Mini-
CLEAN toolkit, which is a C++ wrapper for the pop-
ular GEANT4 particle transport simulation software.
Figure 12 shows a rendering of the model geometry. The
optical model of the TPB used is based on the model
developed by Benson et al. [35] in connection with data
they took in the same study.
The model geometry was validated by measuring the
reflections of a 400 nm beam off a mirror in the sam-
ple holder with the sample holder rotated to multiple
beam-mirror incident angles, and comparing to simu-
lated result. Figure 13 shows the MC prediction for the Figure 13: The angular distribution of re-emitted light
from various TPB samples as simulated by a MC Model.
shape of the angular distribution of light emitted by the
TPB for the same range of film thicknesses as presented
in Figure 9. Figure 14 shows a comparison of data to rotation stage relative to the origin.
MC for the 5.39 µm film thickness. With the MC geometry validated, it became clear the
The error bars in Figures 13 and 14 include both sta- current optical model fails to reproduce some notable
tistical and systematic uncertainties having to do with features of the measured angular distributions. Namely,
the geometry of the apparatus. Systematic uncertain- MC does not reproduce the aforementioned asymmetry
ties were evaluated by measuring the effects of geomet- between reflected and transmitted light in data. Fur-
ric parameters on the angular distributions in MC. The thermore, it was discovered that no plausible combina-
change in the angular distribution corresponding to a 1σ tion of adjustments to parameters in the optical model
variation of a given geometrical parameter was added in could reproduce the asymmetry.
quadrature to the total error on the MC angular distri- Four parameters affecting the asymmetry between re-
butions. In the apparatus, the intersection of the beam flected and transmitted light in MC were thoroughly
with a plane normal to the beam and containing the axis studied: the UV absorption length, the visible absorp-
of the PMT rotation stage defined the origin. Among tion length, the UV scattering length, and the visible
the geometric systematics accounted for, the most rel- scattering length. Here absorption lengths refer to the
evant were the displacement of the sample holder ro- typical distance a photon travels through the TPB bulk
tation axis relative to the origin, the displacement of before undergoing an inelastic interaction with a TPB
sample holder from its own rotation axis, the angular molecule (e.g. shifting), and scattering lengths refer to
displacement of the sample holder from normal to the the typical distance a photon travels through the TPB
beam, and lateral displacement of the axis of the PMT
8before undergoing an elastic interaction with a TPB Though it is unknown what optical processes lead to
molecule (i.e. no shifting). Naively one might suppose the asymmetry seen in data, it is possible to induce de-
certain combinations of these parameters could produce cent agreement between MC and data by superficially
a large asymmetry between reflected and transmitted scaling the left side of the MC angular distribution as
light. For instance, one might think that a long UV seen in Figure 14. This scaling is not the same when
absorption length, meaning the photons travel further applying the correction to MC for different TPB thick-
into the TPB before being absorbed, combined with a nesses, nor does it appear to obey some simple function
short visible scattering length, meaning the re-emitted of TPB thickness.
photons are likely to scatter in the TPB film before One way to reproduce the attenuation of reflected
escaping, results in an attenuation of reflected light. light in MC is to construct a thin layer at the front
This however is not the case; at large UV absorption of the TPB film which strongly scatters visible light.
lengths, it becomes equally likely for a UV photon to Although the choices of the thickness of the layer and
be absorbed at any depth into the TPB film and so no the scattering length are arbitrary, it is found that a
additional scattering of the re-emitted light can prefer- model like this can induce agreement between MC and
ence one direction over the other. This was confirmed data similar that in Figure 14.
in MC. It was observed that no combination of the men-
tioned parameters could produce an asymmetry of the
magnitude seen in data, even when values several sigma 7 Conclusions
away from the expected values were used.
We have presented measurements of the angular dis-
One possible cause of the mis-modelling could be poor
tribution of re-emitted light from TPB films ranging
handling of reflections and scattering at the surface of
in thickness from 250 nm to 5.5 µm when exposed to
the TPB, which scanning electron microscope (SEM)
128 nm light in vacuum. Specifically, we measure pho-
images show has a complicated topography. Another
ton rates at 32 PMT viewing angles from 25° to 185°
could be invalid use of the Rayleigh limit when mod-
as described in Section 2. This was done on 8 different
elling scattering in the TPB, meaning it may be incor-
samples as summarized in Table 1.
rect to treat the scatterers as point particles.
For all samples, we observed an asymmetry between
the amount of re-emitted light that escaped the film in
the backward (reflected) and the forward (transmitted)
directions. We observed higher photon emission rates
on the backside of the TPB film than on the front side.
This is evident in Figures 9 and 10. The asymmetry is
not yet understood and presents the greatest challenge
to performing a MC analysis with this data. The asym-
metry could not be reproduced in MC by adjusting any
of the bulk or surface optical properties available in the
model. As described in Section 6, decent agreement be-
tween the shape of data and MC is observed for either
the reflected or transmitted light individually, but the
ratio of the integrals of the reflected and transmitted
light do not match between the two. Good agreement
between data and MC can be induced by applying a
Figure 14: This figure illustrates the decent shape- scaling to either the transmitted or reflected side of the
agreement that can be induced between MC and data if the
angular distribution as seen in Figure 14. As compared
reflected part (left) of the MC angular distribution is scaled
down. Red shows the nominal angular distribution produced
to what is modeled in MC, it is unknown whether the
by MC when normalized so the transmitted light in MC and asymmetry in data comes from additional attenuation
Data agree. Green shows the decent shape agreement that of reflected light, reduced attenuation of transmitted
can be achieved by scaling the reflected side of the angular light, or some combination of the two.
distribution by some constant. This plot shows the angular Some possible explanations for the asymmetry in-
distribution for a 5.39 µm TPB sample. Note the choice to clude surface effects which may cause additional scatter-
normalize to transmitted light and then “correct” the inte- ing of visible light on the exposed surface of the TPB
gral of reflected light as opposed to the other way around is film, but not on the side attached to the acrylic sub-
essentially arbitrary. The choice to normalize to transmitted strate. This would further attenuate the reflected light.
light in this figure was made because most plausible physical Another possibility may be that the effective size of the
explanations for the asymmetry involve additional attenua-
visible scatterers in TPB are on the order of crystal do-
tion of reflected light rather than increases in transmitted
light.
mains rather than TPB molecules, meaning a Rayleigh
treatment of visible scattering is unjustified. Perform-
914
ing an analysis in the Mie scattering limit could increase D. Akerib et al. (LUX), Phys. Rev. Lett. 118, 021303
the amount of transmitted light seen in MC. (2017).
The observed asymmetry in the angular distribution 15
E. Aprile et al. (XENON), Phys. Rev. Lett. 123,
of re-emitted light may have implications for detector 251801 (2019).
design. Broadly speaking the asymmetry can be taken 16
advantage of in detector design by orienting films so J. Calvo et al. (ArDM), JCAP 03, 003 (2017).
17
more light is seen where desirable and less where unde- R. Brunetti et al. (WARP), New Astron. Rev. 49,
sirable. Future modeling of the asymmetry may lead to edited by D. Cline, 265–269 (2005).
better micro-physical optical models of TPB for use in 18
M. Boulay (DEAP), J. Phys. Conf. Ser. 375, edited
MC simulations of detectors that deploy TPB. by L. Oberauer et al., 012027 (2012).
19
D. Akimov et al., Astropart. Phys. 27, 46–60 (2007).
8 Acknowledgements 20
E. Aprile et al., Astroparticle Physics 35, 573–590
(2012).
Construction and calibrations were supported by the
21
Laboratory Directed Research and Development Pro- C. Wittweg et al., (2020).
gram of Lawrence Berkeley National Lab under U.S. 22
G. Anton et al. (EXO-200), Phys. Rev. Lett. 123,
Department of Energy Contract No. DEAC02- 161802 (2019).
05CH11231. Monte Carlo model development was sup- 23
F. Agostini et al. (DARWIN), Eur. Phys. J. C 80, 808
ported by the U.S. Department of Energy, Office of Sci- (2020).
ence, Office of High Energy Physics, under Award Num-
24
ber DE-SC0018974. N. Raj, Phys. Rev. Lett. 124, 141802 (2020).
25
A. Bondar et al., JINST 12, edited by L. Shekhtman,
C05010 (2017).
References 26
D. Baxter et al., Phys. Rev. Lett. 118, 231301 (2017).
1
B. Abi et al. (DUNE), “Prospects for Beyond the 27
V. Chepel et al., JINST 8, R04001 (2013).
Standard Model Physics Searches at the Deep Un- 28
J. Albert et al. (EXO), Phys. Rev. Lett. 120, 072701
derground Neutrino Experiment”, (2020).
(2018).
2
R. Acciarri et al. (MicroBooNE), JINST 12, P02017 29
S. Shakeri et al., (2020).
(2017).
30
3 S. Amerio et al. (ICARUS), Nucl. Instrum. Meth. A
A. Bernstein et al., Journal of Physics: Conference
527, 329–410 (2004).
Series 1468, 012035 (2020).
31
4 J. Myslik (LEGEND), PoS ICHEP2018, 636 (2019).
L. Tvrznikova, Ph.D. thesis (Apr. 2019).
32
5 S. Kravitz et al., Eur. Phys. J. C 80, 262 (2020).
I. Katsioulas (NEWS-G), 53rd Rencontres de
33
Moriond on Electroweak Interactions and Unified V. Gehman et al., Nucl. Instrum. Meth. A 654, 116–
Theories (2018), pp. 221–226. 121 (2011).
34
6
L. Baudis, Phys. Dark Univ. 4, edited by F. Avignone Hamamatsu Photonics K.K., www.hamamatsu.com.
et al., 50–59 (2014). 35
C. Benson et al., Eur. Phys. J. C 78, 329 (2018).
7 36
K. Rielage et al. (MINICLEAN), Phys. Procedia 61, V. Gehman, JINST 8, edited by S. Seibert, C09007
edited by F. Avignone et al., 144–152 (2015). (2013).
8 37
M. Schumann, (2012). H. Yang et al., Nucl. Sci. Tech. 31, 28 (2020).
9 38
A. Manalaysay, 46th Rencontres de Moriond on J. A. Samson, Applied optics 6, 403–408 (1967).
Electroweak Interactions and Unified Theories (June 39
W. Burton et al., Appl. Opt. 12, 87–89 (1973).
2011), pp. 417–424.
40
10 S. E. Wallace-Williams et al., The Journal of Physical
P. Agnes et al. (DarkSide), Phys. Rev. D 93, [Adden-
Chemistry 98, 60–67 (1994).
dum: Phys.Rev.D 95, 069901 (2017)], 081101 (2016).
41
11 D. McKinsey et al., Nuclear Instruments and Meth-
K. Abe et al., Nucl. Instrum. Meth. A 716, 78–85
ods in Physics Research Section B: Beam Interactions
(2013).
with Materials and Atoms 132, 351–358 (1997).
12
L. Baudis (DARWIN Consortium), J. Phys. Conf. Ser. 42
B. Jones et al., JINST 8, P01013 (2013).
375, edited by L. Oberauer et al., 012028 (2012).
43
13 R. Francini et al., 10.1088/1748-0221/8/09/P09006
D. Akerib et al. (LZ), Nucl. Instrum. Meth. A 953,
(2013).
163047 (2020).
44
D. Stolp et al., JINST 11, C03025 (2016).
1045
S. P. Regan et al., Applied optics 33, 3595–3599
(1994).
46
R. Allison et al., JOSA 54, 747–751 (1964).
47
E. C. Bruner, JOSA 59, 204–211 (1969).
48
E. Segreto, Phys. Rev. C 91, 035503 (2015).
49
Model 632 Deuterium lamp, McPherson Inc, www .
mcphersoninc.com/pdf/632.pdf.
50
Metal Velvet, Acktar, www . acktar . com / product /
metal-velvet-2/.
11You can also read