ICC 124-7 - International Coffee Organization
←
→
Page content transcription
If your browser does not render page correctly, please read the page content below
ICC
                                                                                                E
                                                                    124-7

                                                          14 March 2019
                                                          English only

International Coffee Council                              Country Coffee Profile: Kenya
124th Session
25 – 29 March 2019
Nairobi, Kenya

Background

         In accordance with the objectives of the International Coffee Agreement 2007, the
International Coffee Organization is required to act as a centre for the promotion,
collection, dissemination and publication of economic, technical and scientific information,
statistics and studies, as well as the results of research and development relating to coffee
matters. With regard to those provisions, the Secretariat has supported the Agriculture and
Food Authority Coffee Directorate in the production of this Country Coffee Profile for Kenya.

Action

         The International Coffee Council is requested to note this document.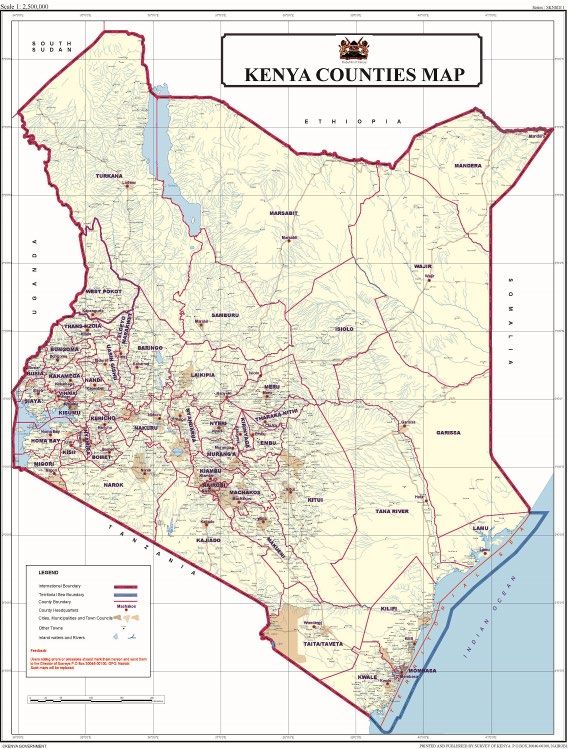
ICC-124-7                                                     1

             AGRICULTURE AND FOOD AUTHORITY
                   COFFEE DIRECTORATE

            COUNTRY COFFEE PROFILE
                      KENYA

Kenya                                         ICO Coffee Profile
2                                                                                                                          ICC-124-7

                                                            CONTENTS

Preface       .......................................................................................................................... 5
Foreword      .......................................................................................................................... 6
Summary       .......................................................................................................................... 7
1.     Background ................................................................................................................. 8
       1.1. Geographical setting of Kenya ........................................................................ 8
       1.2. Economic setting ............................................................................................. 9
       1.3    Summary of the history of coffee in Kenya .................................................... 9
2.     Coffee production ...................................................................................................... 10
       2.1. Geographical Distribution of coffee production and types of coffee.............. 10
       2.2. Coffee production systems .............................................................................. 11
       2.3. Coffee season ................................................................................................... 12
       2.4. Smallholdings and estate farms ....................................................................... 12
       2.5. Coffee Yields and Other Characteristics .......................................................... 12
       2.6. Volume of coffee production ........................................................................... 13
       2.7. Gender Gap ...................................................................................................... 13
3.     Production cost over the last five years ...................................................................... 13
4.     Farm Incomes and coffee payments to growers ......................................................... 14
5.     Research and extension ............................................................................................... 16
       5.1. Coffee research ................................................................................................ 16
       5.2. Research on climate change and coffee .......................................................... 16
       5.3. Coffee extension services ................................................................................ 16
6.     Coffee Processing......................................................................................................... 17
7.     Stakeholders in the coffee sector ................................................................................ 17
       7.1. Farmers’ associations/cooperatives ................................................................ 18
       7.2. National Coffee Authority ................................................................................ 18
       7.3. Government’s further involvement ................................................................. 19
       7.4. The private sector ............................................................................................ 19
       7.5. Financial institutions ........................................................................................ 20
8.     Marketing structure ..................................................................................................... 20
       8.1. Farmers’ associations/cooperatives exporting coffee..................................... 21
       8.2. Specification of coffee grades and indicative premiums................................. 22
9.     Value addition .............................................................................................................. 22
       9.1. Domestic coffee consumption during the last five years ................................ 22
       9.2. Inventories during the last five years .............................................................. 23
10.    Coffee exports ............................................................................................................. 23

ICO Coffee Profile                                                                                                              Kenya
ICC-124-7 3
11. Export regulations ........................................................................................................ 25
11.1. Export duty and taxes ...................................................................................... 25
11.2. Other levies ...................................................................................................... 25
12. Macroeconomic aspects of the coffee sector ............................................................. 26
12.1. Coffee and trade balance................................................................................. 26
12.2. Share of coffee in Gross Domestic Product ..................................................... 26
12.3. Employment generated by the coffee sub-sector: .......................................... 26
13. Environmental challenges ............................................................................................ 26
14. Prospects for coffee production .................................................................................. 27
LIST OF TABLES
Table 1: Distribution of coffee holdings................................................................................... 12
Table 2: Kenya coffee production over the last five years ...................................................... 13
Table 3: Average production cost during the last five years ................................................... 13
Table 4: Cherry payment rates by region and county ............................................................. 15
Table 5: Categories and number of stakeholders .................................................................... 17
Table 6: Average auction price 1998/99-2017/18 .................................................................. 20
Table 7: Direct sales volume and value .................................................................................. 21
Table 8: Calibration of different grades of Kenyan coffee....................................................... 22
Table 9: Volumes of coffee consumed locally from 2009/10 to 2017/18 ............................... 23
Table 10: Performance of coffee exports from 2012/13 to 2017/18 ..................................... 23
Table 11: Coffee exports by destination, 2017/18 .................................................................. 24
LIST OF FIGURES
Figure 1: Kenya and its geographical setting ............................................................................. 8
Figure 2: Coffee-growing Areas ............................................................................................... 11
Kenya ICO Coffee Profile4 ICC-124-7
LIST OF ACRONYMS
AFA Agriculture and Food Authority
CB Coffee Board
CBK Coffee Board of Kenya
CMB Coffee Marketing Board
CRI Coffee Research Institute
GAP Good Agricultural Practices
GDP Gross Domestic Product
GMP Good Manufacturing Practices
KARLO Agriculture Research and Livestock Organization
KCPA Kenya Coffee Producers Association
KCTA Kenya Coffee Traders Association
KEPHIS Kenya Plant Health Inspectorate Services
Ksh Kenya Shilling
MT Metric Tonnes
NCE Nairobi Coffee Exchange
ICO Coffee Profile KenyaICC-124-7 5
PREFACE
Kenya’s rich endowment of volcanic soils, altitude, rainfall and temperatures enables the
country to produce high quality coffee that is rated among the best in the world. The sector
contributes to the livelihoods of over 700,000 smallholder growers, as well as providing
substantial foreign exchange earnings. However, as occurred in many other African coffee-
producing countries, the end of the export quota system of the International Coffee
Agreement coincided with a sharp decline in Kenyan coffee production from an annual
average of 1.7 million bags in the 1980s to current levels of less than 1 million bags. I
welcome the decision of the government to restructure the sector as one of the country’s
strategies to reduce poverty in rural communities and was particularly pleased by the
request from Kenyan coffee authorities to prepare this country profile.
The publication of a series of country profiles is one of the objectives of the International
Coffee Agreement 2007, specifically collecting, disseminating and publishing economic,
technical and scientific information, statistics and studies, as well as the results of research
development in coffee matters. These objectives have been reinforced in the Organization’s
Five-year Action Plan, approved by the International Coffee Council during its 120th Session,
held in Yamoussoukro (Côte d’Ivoire) in September 2017.
In this regard, Member countries have been provided with guidelines to be used as a
framework for a comprehensive report on the coffee sector in specific countries. Therefore,
these profiles are extremely important in improving the visibility of the world coffee
economy and identifying key trade flows. They should also serve as a reference point from
which policies can be developed and further analysis can be undertaken.
I would like to thank Mr Anthony Muriithi, Director General of the Agriculture and Food
Authority (AFA) and his technical staff for the preparation of this report. Thanks are also due
to Professor Joseph Kieyah, Chairman of the National Task Force on Coffee Sub-Sector
Reforms, for his continued and invaluable support to the work of the International Coffee
Organization. I sincerely hope that this profile will provide ICO Members and other
stakeholders with relevant information on the coffee sector of Kenya and its new direction
to regain its previous dynamism. Finally, the ICO Secretariat and I welcome any observations
and suggestions that will contribute to improving future publications.
José Sette
Executive Director
International Coffee Organization
Kenya ICO Coffee Profile6 ICC-124-7
FOREWORD
Kenya is a country of great diversity, lying towards the East African coast and centrally
located on the Equator, which splits the country into two almost equal parts. The various
diverse features of Kenya have, in terms of physical, geographical and social economic
attributes, given the country comparative advantages that have enabled it to grow and
become the leading economic powerhouse within East Africa.
Agriculture is the backbone of Kenya’s economy and the coffee industry has been one of the
key pillars of the country’s economic development for decades. The coffee sub-sector
contributes annually an average of US$230 million in foreign exchange earnings and is
ranked as Kenya’s fourth most important export, after horticulture, tourism and tea. This
key role is recognized in the Government’s efforts to fight poverty and is central to the
agricultural sector’s contribution towards the realization of Kenya’s Vision 2030, which is the
country’s blueprint premised on three pillars and in the Big 4 Government Agenda.
Kenya prides itself as a producer of superior quality coffee, largely due to positive attributes
arising from favourable growing conditions: well-distributed rainfall, high altitude (1,500–
2,000 metres above sea level), moderate temperatures and deep red volcanic soils. In
addition, the method of processing the coffee for the market contributes significantly to the
above-mentioned attributes.
The Kenyan coffee sector is under the auspices of the Coffee Directorate, one of eight
Directorates of the Agriculture and Food Authority (AFA). The AFA is a government agency
under the Ministry of Agriculture, Livestock, Fisheries and Irrigation and is responsible for
the development, regulation and promotion of scheduled crops as provided for in the Crops
Act of 2013.
The Kenya Constitution 2010 introduced two levels of governments: national and county.
Subsequently, the agricultural sector was devolved to the county governments in order to
ensure efficiency and effective service delivery. In this regard, collaboration between the
national and county governments has given greater focus to the coffee sub-sector in the
counties, through increased resource allocation for improved production and productivity.
This is expected to change the future outlook of coffee to a more profitable enterprise and,
thus, promote the sustainability of the coffee industry.
I take this opportunity to welcome all the delegates attending the 124th ICO Council session
and meetings in Nairobi, Kenya. KARIBUNI
Anthony Muriithi
Director General,
Agriculture and Food Authority
ICO Coffee Profile KenyaICC-124-7 7 SUMMARY Kenyan coffee is grown on an estimated total area of 115,570ha in 32 counties out of a total of 47 counties in the country. The country has a dual production system with about 3,000 large estates and over 700,000 smallholder growers. Introduced in the end of the 1800s by the colonial government, coffee already played a crucial role in the economy of the country by the time of its independence in 1963. The sole type of coffee produced in the country is Arabica, which is planted during the rainy season from April to October with two harvest periods (from April to June and from October to December). Coffee is grown without shade and the average yield is estimated at 302kg/ha for smallholder farms and 556kg/ha for estate farms. The annual average production is below 900,000 bags. After harvest, farmers deliver their cherries to their primary societies for processing. The timeframe until farmers are paid is largely dependent on the efficiency of the marketing agents and the availability of buyers. Cooperative societies are required by law to pay farmers at least 80% of the total upon delivery of their cherries. However, cherry repayment rates differ from region to region, ranging from 84.6% to 10.2%. In Kenya coffee is marketed through a central auction system managed by the Nairobi Coffee Exchange Management Committee, which consists of representatives of the industry stakeholders. Direct sales to buyers from importing countries have been authorized as a second window. The main export destinations are Germany (15.8% of total exports in coffee year 2017/18), United States of America (15.7%), Belgium (14%), Republic of Korea (12.1%) and Sweden (8.2%). In terms of value addition, 25 registered local roasters process 138,500 bags of coffee, although domestic consumption is estimated at around 18,396 bags only. Kenya has a strong research institution that developed two improved varieties, Ruiru 11 and Batian, which are expected to contribute to governmental efforts to promote sustainable coffee production. The stakeholders of the industry consist of government, coffee growers and the private sector. The regulatory body is the Agriculture and Food Authority (AFA), which is also in charge of the sector’s development. The private sector supports the coffee industry at various stages in the value chain. The Kenyan coffee sector is mainly funded by national and local governments. One of the major challenges of the sector is climate change, which affects production due to unreliable and erratic rains with shorter seasons. As part of the government’s coffee revitalization programme, designed by the National Task Force on Coffee Sub-Sector Reforms, a number of challenges will be addressed in order to renovate the coffee sector in Kenya. Kenya ICO Coffee Profile
8 ICC-124-7
1. BACKGROUND
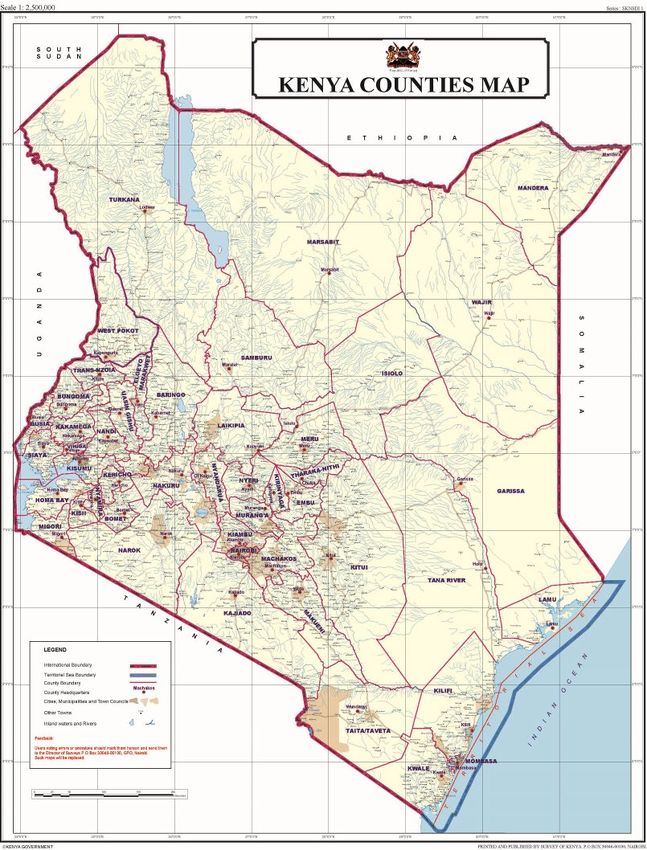
1.1. Geographical setting of Kenya
Kenya lies astride the Equator on the East coast of Africa. It is a medium-sized country by
continental standards, covering an area of about 586,600km2. Inland water bodies cover
some 10,700km2, the bulk of which in Lakes Victoria and Turkana.
To the East lies the Indian Ocean and the Republic of Somalia, to the North lie Ethiopia and
South Sudan, to the West lies Uganda and to the South lies the Republic of Tanzania. The
geographic coordinates of Kenya are: 1 00 N, 38 00 E.
The climate of Kenya varies from tropical along the coast to arid in the interior. The weather
in Kenya is generally sunny year-round, with the main rainy seasons being from March to
May and from November to December.
Figure 1: Kenya and its geographical setting
ICO Coffee Profile KenyaICC-124-7 9 1.2. Economic setting The major economic activities in Kenya include agriculture, tourism, forestry and fishing, energy and manufacturing. The sectors have contributed to an annual growth in national Gross Domestic Product (GDP) of about 5% over the last five years. According to estimates made in 2018, Kenya had a GDP of $86 billion, becoming the 69th largest economy in the world. Agriculture continues to be a major contributor to the country’s economic growth and development, accounting directly for 24.5% and indirectly for 27% of the country’s GDP. In addition, the sector contributes to 65% of total exports and employs over 80% of Kenya’s rural workforce. The coffee sub-sector is one of the sub-sectors contributing to this growth in agriculture through foreign exchange earnings, family farm incomes, employment creation and food security. The value of coffee as a percentage of all export goods represented 5.5% in 2017, while its share of GDP is 0.22%. The coffee industry contributes an average of KShs 23 billion per year in foreign exchange earnings, ranking fourth after tourism, tea and horticulture. Therefore, the government recognizes the strategic role played by the sector in the economic empowerment of coffee farmers and service providers. 1.3. Summary of the history of coffee in Kenya Coffee was first planted in Kenya at Bura in the Taita Hills in 1893 and later grown under irrigation at Kibwezi, in 1900, and at Kikuyu, near Nairobi, in 1904. In the 1930s, following the Devonshire White Paper report of 1923, the colonial government allowed controlled planting of coffee outside European-settled areas, particularly in Kisii and Meru. When Kenya attained its independence in 1963 the coffee industry was already playing a significant role in the economy by, among other things, being the leading source of foreign exchange. At that time, there was no statutory control, in terms of crop husbandry, production, processing, grading and marketing. The marketing of coffee was handled by individuals and through rudimentary institutions between 1900 and 1933. At the request of coffee farmers, the colonial government enacted the Coffee Industry Ordinance in 1932, and established a Coffee Board (CB) in January 1933. The role of the Coffee Board was licensing, inspection and promotion. Kenya ICO Coffee Profile
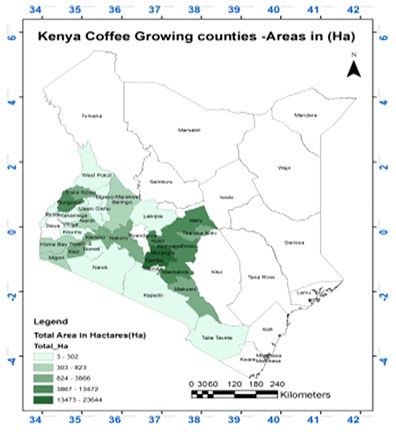
10                                                                                 ICC-124-7

On the other hand, the Kenya coffee auctions, as a mode of selling Kenyan coffee, were
established in 1934 and the liquoring department of Coffee Board was created in 1935 to
enhance the grading and selling of coffee. The first coffee auction was inaugurated in
September 1935. The Coffee Marketing Board (CMB) was established under Coffee
Marketing Ordinance No. 6 of 1946 and became fully operational on 1 July 1947 to cater for
coffee marketing activities, with functions including central warehousing, sales of coffee at
central auctions, liquoring and financing.

Ordinance No. 26 of 1960 consolidated the Coffee Industry Ordinance and the Coffee
Marketing Ordinance into the Coffee Ordinance Cap 333. This measure came into effect on
5 July 1960, when the Coffee Board of Kenya (CBK) and the CMB were established under the
same law.

Act 13 of 1971 abolished the CMB and consolidated the function of coffee marketing within
the regulatory functions of the CBK. Since then, the CBK controlled the coffee sub-sector up
to July 2001, when a new Coffee Act 2001 was enacted that specified new roles for CBK as
an industry regulator.

2.     COFFEE PRODUCTION

2.1.   Geographical Distribution of coffee production and types of coffee

Coffee-growing areas are located within the Western, Rift Valley, Central Kenya and Mt
Kenya regions, as shown in figure 2 below. Coffee is grown in the high potential areas
between 1,400 and 2,200 metres above sea level, with temperature ranging from 15 to
24° Celsius, in red volcanic soils that are deep and well drained. Over 99% of Kenyan coffee
is Arabica, whose main varieties are SL 28, SL 34, K7, Ruiru 11, Batian and Blue Mountain.

ICO Coffee Profile                                                                    Kenya
ICC-124-7                                                                               11

                              Figure 2. Coffee-growing Areas

2.2.    Coffee production systems

Kenya coffee is produced under two systems, comprising smallholder farmers affiliated to
co-operative societies and coffee estates, which are individually managed coffee
plantations. A total of 115,570ha of land is dedicated to coffee production in 32 counties,
distributed as follows: co-operatives 88,278ha and estates 26,222ha.

Coffee is mainly grown under rain-fed conditions, with some large coffee estates having
established irrigation systems. Most Kenyan coffee is grown without shade, but shaded
coffee is becoming increasingly popular in order to mitigate the effects of climate change,
although no attempt has been made to quantify the area under shade. Research is ongoing
to determine the appropriate shade trees.

Kenya                                                                    ICO Coffee Profile
12 ICC-124-7
2.3. Coffee season
Coffee planting is usually done during the rainy seasons, in the months of April and October,
while harvesting takes place during two periods every year, with the first crop from April to
June and the second from October to December.
2.4. Smallholdings and estate farms
Coffee is grown by an estimated 800,000 smallholder farmers, clustered under
500 cooperative societies, and a total of about 3,000 coffee estates, categorized as small,
medium and large, are involved in coffee production as indicated in Table 1.
Table 1: Distribution of coffee holdings
Sector Size of Number of Share of
acreage farmers total farmers
Small holder affiliated Varies 800,000 99.63%
Estates holdings distributed as follows
Small estates 5-20 acres 2,400 0.30%
Medium estates 20-50 acres 500 0.06%
Large estates Over 50 acres 100 0.01%
Total number of coffee farmers 803,000 100%
2.5. Coffee Yields and Other Characteristics
The plant population per hectare of traditional coffee varieties with spacing of 2.74m x
2.74m is about 1,350 bushes, while the plant population of R11 spaced at 2m by 2m is 2500.
The national average coffee yield is estimated at 302kg/ha, whereas the average yield in the
estate sector is 556 kg/ha.
Coffee farmers use organic and inorganic fertilizers when establishing coffee. For sustained
production, farmers apply recommended fertilizers after soil analysis by the Coffee Research
Institute (KALRO-CRI). Coffee farmers also apply recommended agrochemicals to manage
pests in coffee bushes. However, the use of inorganic chemicals has decreased due to the
introduction of disease-resistant varieties, such as Ruiru11 and Batian.
ICO Coffee Profile KenyaICC-124-7 13
2.6. Volume of coffee production
The trend of production of Kenyan coffee has oscillated between 40,000 to 50,000 Mt over
the last six years. Table 2 illustrates Kenyan coffee production in the last six years.
Table 1: Kenya coffee production over the last five years
Year 2012/13 2013/14 2014/15 2015/16 2016/17 2017/18
Production (MT) Estates 13,773 16,805 14,808 15,267 14,151 10,997
Co-operatives 26,092 32,652 27,230 30,758 24,468 30,381
Total 39,865 49,475 42,038 46,121 38,620 41,375
2.7. Gender Gap
Land ownership is culturally dominated by men. However, women provide over 60% of the
workforce in farms and coffee wet mills. This situation is gradually changing as a result of
the affirmative action stipulated in the Kenya Constitution 2010. Women who own farms
are largely those who have been widowed.
3. PRODUCTION COST OVER THE LAST FIVE YEARS
Production costs of coffee vary with levels of productivity and between the varieties under
establishment. Below is a tabulation of an average cost of production per year:
Table 3: Average production cost during the last five years
Cost of coffee production
Medium
Production level Low Mgt High Mgt Sl Variety Sl Variety Ruiru 11/Batian
Mgt
Yield (tonne of clean coffee /ha) 0.27 0.4 0.81 0.95 2.00 3.57
Production/tree (kg of cherry) 1.42 2.11 4.26 5 10.53 10
Average price (USD/50 kg cc) 235.48 235.48 235.48 235.48 235.48 235.48
Gross revenue (Ksh/hectare) 128,708 194,030 389,995 459,671 967,729 1,727,396
Gross revenue (Ksh/tonne) 483,864 483,864 483,864 483,864 483,864 483,864
Cost of production/ha 98,367 148,853 258,741 271,678 136,735 106,931
Cost of production/tonne 369,801 371,204 321,018 285,977 68,368 29,953
Net Revenue per Tonne (Ksh) 17,291 15,887 66,073 101,115 318,724 357,139
Kenya ICO Coffee Profile14 ICC-124-7
Table 3: Average production cost during the last five years. Continued.
Loss and profit analysis per kg of cherry
Medium
Production level Low Mgt Mgt High Mgt Sl Variety Sl Variety Ruiru 11/Batian
Production per tree in kgs of
cherry 1.4 2.1 4.3 5 10.5 10
Cost per kg of cherry 52.83 53.03 45.86 50.16 40.85 9.77
Average price per kg of cherry 69.12 69.12 69.12 69.12 69.12 69.12
Loss/profit per kg of cherry 16.29 16.09 23.26 18.96 28.27 59.35
Source: Coffee Research Institute
Crop losses
Crop losses in coffee production can arise at the farm and in processing units. At the farm,
coffee losses can arise from nutritional deficiencies, diseases and insect pest attacks that can
reduce the volume and quality of coffee. Coffee processing starts during picking, in which
selective sorting of cherries helps to maintain quality. In wet mills, the quality of coffee can be
compromised as a result of poor pulping, grading, washing, drying and storage. Losses
incurred at the farm level could be significant, but no figures are available to indicate their
extent. From field visits during processing times, it is noted that farmers have taken great care
to minimize losses by traveling short distances to the wet mills at which they are registered.
Farmers are required to register in the wet mill stations nearest to their land.
4. FARM INCOMES AND COFFEE PAYMENTS TO GROWERS
Smallholder coffee farmers in Kenya harvest and deliver cherries to their respective mills for
primary processing, comprising the removal of pulp and consequent transformation of the
final product into parchment. Parchment coffee is then delivered to over twenty licensed
millers for processing to produce clean coffee grades. Clean coffee grades are stored in
warehouses, while samples are presented for marketing at the Nairobi Coffee Exchange.
Upon sale of the coffee, growers get paid directly, if they are estate farmers, or through co-
operative societies.
The timeframe until farmers are paid is largely dependent on the efficiency of the marketing
agents and availability of buyers. Cooperative societies are required to pay at least 80% of
sales proceeds to farmers. Table 4 below shows the highest and the lowest cherry payment
rates per kilo of cherry. According to KALRO, the highest production cost is Kshs 52.30/kg
while the lowest production cost is Kshs 10/kg depending on different varieties and
management style.
ICO Coffee Profile KenyaICC-124-7 15
Table 4: Cherry payment rates by region and county
Region/County 2015/16 2016/17 2017/18
Highest Lowest Highest Lowest Highest Lowest
rate-KES rate-KES rate-KES rate-KES rate-KES rate-KES
CENTRAL/MT
KENYA WEST 84.6 10.2 119.1 20 105 12.75
KIAMBU 65 25 75.76 25.8 93.43 30
KIRINYAGA 78.7 30.7 119.1 47.72 103 30.95
MURANGA 70.75 10.2 90.1 20 88.1 18.1
NYERI 84.6 20 105 29 105 12.75
MT KENYA EAST 74 14.2 104.88 12 97.45 9
EMBU 74.2 14.2 104.88 26.87 97.45 17.4
MACHAKOS 74 15 75 12 51.00 9
MAKUENI 56 15 56.5 44.63 34.83 17
MERU 53.23 18 62.05 28 76.4 18.5
TAITA 25 25
THARAKA NITHI 63 35 73 29.5 72 14.04
NORTH RIFT 78 14 66.41 24.2 92.67 28
ELGEYO
MARAKWET 44.2 44 44.36 34.62 50 29
NANDI 53 14 53.3 37.5 72 28
TRANS NZOIA 78.2 24 66.41 24.2 92.67 24
UASIN GISHU 27 27 28.13 28.13 34 34
WEST POKOT 48 34 48 37.83 48 37.5
NYANZA 50 10.7 55 17.19 55 9.55
HOMA BAY 50 25 50 30 40 25
KISII 37.75 10.7 54.42 17.19 48.55 9.55
KISUMU 13.5 13.5 55 55 55 55
MIGORI 45 33 54.3 41.5 53 33.8
NYAMIRA 35 15 52.4 29.22 44 12.38
SOUTH RIFT 55.92 14 81 25 78.9 17
BARINGO 43 28.5 64.15 38 45.2 35.54
BOMET 37 14 70.7 25
KERICHO 54.43 31.7 81 31.57 78.9 17
LAIKIPIA 30 30
NAKURU 55.92 29.11 70 44.22 59.4 41
NAROK 23 23
WESTERN 55.7 14 71.31 27.5 77.5 31
BUNGOMA 55.7 14 71.31 27.5 77.5 31
KAKAMEGA 30 30 48 48
VIHIGA
Grand Total 84.6 10.2 119.1 12 105 9
Kenya ICO Coffee Profile16 ICC-124-7 5. RESEARCH AND EXTENSION 5.1. Coffee research In Kenya, coffee research is undertaken by the Coffee Research Institute (CRI) of the Kenya Agriculture Research and Livestock Organization (KARLO). The Institute has made several recommendations with regard to Good Agricultural Practices (GAP) and Good Manufacturing Practices (GMP). In addition, the Institute has conducted major research aimed at ensuring the sustainability of production through an efficient value chain and climate mitigation measures. The Coffee Research Institute has developed two improved varieties, namely Ruiru11 and Batian, which are part of the efforts to enhance production sustainability. The improved varieties are resistant to Coffee Berry Disease and Leaf Rust Disease, thus lowering the cost incurred in the control by fungicides. Over 300,000 farmers are estimated to have planted the new varieties. 5.2. Research on climate change and coffee The Coffee Research Institute has undertaken research and made recommendations on various measures to mitigate the adverse effects of climate change. Some of these measures include use of suitable shade trees, mulching material, and the adjustment of spraying programmes to cope with changing trends in the manifestation of coffee pests and diseases. 5.3. Coffee extension services Before the promulgation of the Kenya Constitution 2010, coffee extension services were the responsibility of the national government in collaboration with other stakeholders in the coffee sub-sector. However, following the promulgation of the Kenya Constitution 2010, certain functions related to agriculture, including provision of extension services, were devolved to the county governments. However, the Coffee Directorate of the Agriculture and Food Authority, in collaboration with other relevant stakeholders, provides capacity building to the counties’ agricultural staff and other coffee value chain players. The collaborating private agencies include Technoserve, Solidaridad, certification bodies (UTZ, 4C, Fairtrade) and management services providers. The Coffee Research Institute develops technologies, releases new coffee varieties and carries out research on disease and pest management, while the Ministry of Agriculture sets policy guidelines. ICO Coffee Profile Kenya
ICC-124-7                                                                                  17

6.      COFFEE PROCESSING

Most Kenyan coffee (90%) is wet processed at washing stations owned by cooperative
societies and estate farmers, whereas less than 10% of coffee is dry processed into buni
(dried coffee that has not undergone pulping). The parchment coffee from washing stations
is graded into Parchment 1, 2, 3 and lights, ready for onward transportation to a dry mill.
Every coffee cooperative society has its own members and jurisdiction. Members should not
move from one society to another because of commitments (e.g. loan recovery purpose)
Therefore, movement from one society to another is discouraged since this may lead to loan
defaults. In situations where mismanagement exists, members move without seeking
permission from authorities.

Quality control

Coffee quality begins with selective picking on the farm, followed by sorting, pulping and
careful sun-drying. Parchment coffee is analyzed for moisture content to ensure adequate
drying before it is milled into seven primary grades of clean coffee and two grades of buni in
conformity with the International Coffee Standard. Mills and exporters also carry out coffee
cupping in order to ensure conformity with quality standards.

7.      STAKEHOLDERS IN THE COFFEE SECTOR

The coffee value chain comprises a variety of members, namely: Ministry, government
agencies and departments, coffee growers, millers, marketing agents, management agents,
warehouses, transporters and financial institutions. The following Table 5 contains
categories and number of the stakeholders who have been registered by the Agriculture and
Food Authority (AFA)-Coffee Directorate

                      Table 5: Categories and number of stakeholders
                         No                 Category               Size
                            1.   Smallholder farmers              700,000
                            2.   Estates                            3,000
                            3.   Co-operative societies              500
                            4.   Cooperative Unions                   14
                            5.   Pulping stations-co-operatives     1,001
                            6.   Pulping stations-estates           3,000
                            7.   Coffee millers                       17
                            8.   Commercial marketing agencies        10

Kenya                                                                       ICO Coffee Profile
18 ICC-124-7
No Category Size
9. Nairobi Coffee Exchange 1
10. Grower marketers 25
11. Warehouses 24
12. Management agents 4
13. Coffee dealers 77
7.1. Farmers’ associations/cooperatives
Coffee growers and some service providers are organized into associations for purposes of
self-regulation and lobbying for facilitative policies and regulations. There are about ten
growers’ unions, a Commercial Coffee Millers and Marketing Agents Association, the Kenya
Coffee Traders Association (KCTA) and the Kenya Coffee Producers Association (KCPA)
within the coffee value chain.
7.2. National Coffee Authority
The former Coffee Board of Kenya was the sole regulator of the coffee sub-sector and was
governed by the Coffee Act of 2001 and Coffee General Regulations of 2002. However,
following reforms in the agricultural sector, there was a merger of former Boards of all
commodity boards that show the repeal of the previous Acts and enactment of the
Agriculture and Food Authority Act 2013 and the Crops Act 2013 that was operationalized in
August 2014. This led to the establishment of the Agriculture and Food Authority with eight
Directorates for different crops. Therefore, the Agriculture and Food Authority-Coffee
Directorate is responsible for the regulation, development and promotion of the coffee sub-
sector in Kenya. The Coffee Directorate ensures enforcement of the regulations and
standards for coffee quality in the coffee industry.
The Authority is headed by a Director General, while the Directorate is led by the Head of
the Coffee Directorate who is supported by a total of fifty staff with a countrywide network
of field offices. The Directorate has three Departments, namely: Regulation and Compliance;
Promotion; and Technical and Advisory Services.
The mandate of AFA-Coffee Directorate is to sustainably develop and promote the coffee
value chain through effective regulation for economic growth. Its role is to: undertake
formulation of the coffee sub-sector policy for general guidance and direction of the coffee
industry in consultation with county governments; review Kenyan coffee standards in
consultation with the Kenya Bureau of Standards, coffee industry stakeholders and county
ICO Coffee Profile KenyaICC-124-7 19 governments; enforce coffee industry standards and codes of practice; promote Kenyan coffee in the domestic and international markets in collaboration with county governments, the private sector and stakeholders; promote initiatives to add value to coffee; facilitate coffee exports, re-exports, and imports through issuance of relevant documents; represent Kenya in international forums of the coffee industry; and maintain a national industry database for research and planning. 7.3. Government’s further involvement The Ministry of Agriculture, Livestock, Fisheries and Irrigation is in charge of policy formulation for the coffee industry and overseas operations of the Authority, whereas the State Department of Co-operatives is in charge of cooperatives policy and regulates the cooperatives sector. Other Departments that support the coffee sub-sector include the State Department of Trade, Ministry of Foreign Affairs, the Treasury, Attorney General and other state organs. Agriculture is currently a devolved function under the authority of county governments, which are responsible for financing, technical support, enforcement of standards, regulation and extension services. The sub-sector is also, from time to time, supported by development partners, such as the World Bank and the European Union. The Ministry of Agriculture supports the sub-sector by providing policy direction (policy formulation/development) and by building the capacity of county governments’ staff on matters related to coffee, while the Ministry of Foreign Affairs provides coffee market linkages through foreign missions. The Treasury provides funds for running institutions responsible for the promotion, development and regulation of the sector. The Attorney General provides legal services to the government on coffee matters. Crop husbandry has been devolved to the counties, so county governments provide extension services through agricultural extension officers domiciled in their respective counties. They promote the expansion of coffee by providing subsidized inputs, such as fertilizers, and coffee seedlings. Some counties have designated coffee extension officers. 7.4. The private sector The private sector supports the coffee sub-sector at various stages in the value chain with regard to the production, processing, milling, marketing and capacity building, among other services. The private sector comprises coffee millers, marketing agents and non- governmental organizations, among other players. The private sector supplies inputs and crop-processing materials, as well as training growers in Good Agricultural and Good Manufacturing Practices. Over 80% of the total milling infrastructure is owned by the private sector, which also carries out most of the marketing functions. Kenya ICO Coffee Profile
20                                                                                ICC-124-7

7.5.    Financial institutions

The coffee sector is funded by the national government, county governments, banks,
SACCOs and development partners. Specifically, the Commodities Fund (former Coffee
Development Fund) was established to provide affordable credit to coffee farmers, which
benefit has been extended to other crops since 2014, following the establishment of the
AFA. It is estimated that 100,000 farmers have received loans since the credit facility was
established.

8.      MARKETING STRUCTURE

Kenyan coffee is marketed through a central auction and direct sales. The central auction is
administered by the Nairobi Coffee Exchange Management Committee, which is drawn from
industry stakeholders. Coffee marketing agents who have been contracted by coffee
growers offer coffee for sale in a competitive auction to the highest bidders among coffee
dealers (exporters). The AFA Coffee Directorate annually licenses the marketing agents and
dealers who participate at the auction floor.

Direct sales entail engagement between the grower-marketer and overseas buyers. Grower-
marketers are coffee growers who are licensed to market their own coffee directly to
overseas buyers. However, in cases where growers do not have the capacity to market their
product directly, commercial marketing agents facilitate the process by drawing up sales
agreements between producers and buyers and handling other marketing logistics.

                      Table 6: Average auction price 1998/99-2017/18
Coffee Year            No. Bags       Weight Traded-kg       Value (US$)       Avg Price/50kg
1998/1999             1,119,790             67,406,795       159,633,152              118.41
1999/2000             1,424,087             85,862,945       144,043,500               83.88
2000/2001             1,080,171             65,163,902        89,063,020               68.34
2001/2002              785,897              47,427,241        73,683,754               77.68
2002/2003              970,706              58,612,490        76,827,524               65.54
2003/2004              875,328              52,873,632        87,992,443               83.21
2004/2005              822,182              49,753,670       120,403,162              121.00
2005/2006              782,482              47,495,275       128,290,188              135.06
2006/2007              878,580              53,368,337       143,006,663              133.98
2007/2008              648,031              39,461,673       139,878,939              177.23
2008/2009              853,428              51,881,026       160,459,376              154.64
2009/2010              595,156              36,197,159       171,347,974              236.69

ICO Coffee Profile                                                                    Kenya
ICC-124-7 21
Coffee Year No. Bags Weight Traded-kg Value (US$) Avg Price/50kg
2010/2011 551,334 33,633,235 221,468,088 329.24
2011/2012 712,132 43,366,142 190,810,778 220.00
2012/2013 625,185 38,141,308 127,164,403 166.70
2013/2014 671,438 40,927,603 174,151,188 212.76
2014/2015 568,766 34,754,166 142,507,244 205.02
2015/2016 628,733 38,375,591 148,927,012 194.04
2016/2017 557,544 34,090,505 159,201,866 233.50
2017/2018 582,887 35,675,449 145,220,024 203.53
The table above shows the performance of the Nairobi Coffee Exchange (NCE) over the last
20 years. Despite the decline in the volume of coffee marketed through this window, its
value has been increasing over the years.
8.1. Farmers’ associations/cooperatives exporting coffee
A few coffee farmers’ associations and cooperatives export coffee directly to overseas
coffee buyers, occasionally facilitated by contracted commercial marketing agents. These
exports are conducted under the direct sales marketing system.
Table 7: Direct sales volume and value
Direct Sales (DS)
Year
Weight (kg) Value (US$)
2007/08 2,045,280 8,106,791
2008/09 1,195,560 4,385,904
2009/10 3,784,154 19,492,410
2010/11 2,231,981 22,211,998
2011/12 5,701,514 33,580,664
2012/13 3,723,449 17,991,934
2013/14 8,282,060 42,988,034
2014/15 7,183,000 40,028,589
2015/16 7,543,758 41,048,102
2016/17 6,755,743 43,738,496
2017/18 7,962,253 44,980,154
Direct sales provide an alternative channel through which coffee is marketed in Kenya. The
contracts are signed between overseas buyers and farmers directly, with facilitation by
marketing agents.
Kenya ICO Coffee Profile22 ICC-124-7
8.2. Specification of coffee grades and indicative premiums.
Once coffee parchment and buni have been dry milled, the clean coffee is then graded into
seven primary grades and two primary grades for parchment and buni respectively. The
grades are: E, AA, AB, PB, C, T, TT and MH, ML; with grades E, AA, AB and PB being regarded
as the premium grades. Some Kenyan coffees are also grown under certification schemes
and fetch premiums prices that vary according to the scheme in question.
Table 8: Calibration of different grades of Kenyan coffee
Grade and description Screen size
E (Elephant) Two beans joint together Retained by screen 21 (8.3mm)
AA (Flat bean) Retained by screen 18/17 (7.2mm)
AB (Flat bean) Retained by screen 16 (6.35mm)
PB (Peaberry-Oval bean) Retained by screen 12 (4.76mm)
C (Smaller beans) Retained by screen 10 (3.96mm)
TT (Lights from AA and AB) Gravity separated
T (Smallest beans, broken, chipped) Passing through 7 (2.9mm)
9. VALUE ADDITION
Growers and private roasters are licensed to undertake the roasting, packaging and
marketing of Kenyan coffee locally and internationally. Today, 25 roasters (of which four are
grower-marketers) and one university are involved in coffee roasting and packaging. The
coffee for roasting is purchased at the auction and, after roasting, is retailed in major urban
centres and coffee shops. A survey conducted in 2017 showed that the number of coffee
shops increased from 206 in 2015 to 278 in 2017.
9.1. Domestic coffee consumption during the last five years
Domestic coffee consumption has grown by 2% to 5% annually over the last five years.
According to the latest survey conducted by the Coffee Directorate in 2017, the total
number of coffee houses grew to 399, compared to 206 in 2015. This development is
attributable to consumption by the growing middle class.
On the other hand, in its efforts to promote domestic coffee consumption, the Coffee
Directorate has entered into partnerships with Kenyatta University, Jomo Kenyatta
University of Agriculture and Technology, Multimedia University, Moi University and
ICO Coffee Profile KenyaICC-124-7 23
University of Eldoret. Other partners are Egerton University, United States International
University-Africa, Dedan Kimathi University, Machakos University and Mount Kenya
University. The idea is based on targeting youth in order to promote a coffee-drinking
culture in Kenya. Table 4 below shows coffee consumption volumes over the last nine years.
Table 9: Volumes of coffee consumed locally from 2009/10 to 2017/18
Year Local consumption(MT)-GBE No. Bags-60kg
2009/10 509.90 8,498
2010/11 566.60 9,443
2011/12 629.50 10,492
2012/13 716.00 11,931
2013/14 744.00 12,405
2014/15 756.00 12,591
2015/16 771.00 12,842
2016/17 1,051.20 17,520
2017/18 1,103.76 18,396
9.2. Inventories during the last five years
Once harvested, milled and warehoused, coffee in Kenya is all sold within the growing
season, with the exception of minimal stocks held by exporters for periods not longer than
six months. Therefore, no significant inventories can be reported.
10. COFFEE EXPORTS
Table 10 below contains a summary of Kenyan coffee exports in the last six years, and Table
11 reports coffee exports by destination.
Table 10: Performance of coffee exports from 2012/13 to 2017/18
Coffee year Net Weight-kg FOB Value (US$) Value (Ksh)
2012/13 49,031,461.31 217,018,127.61 18,209,676,550.66
2013/14 47,175,294.11 228,426,961.63 19,733,013,644.91
2014/15 44,064,026.78 223,385,715.01 21,010,597,868.28
2015/16 44,342,470.01 205,674,854.90 20,893,006,028.47
2016/17 43,378,724.78 227,827,991.12 23,468,566,737.90
2017/18 43,289,615.31 229,514,404.53 23,307,949,319.83
Kenya ICO Coffee Profile24 ICC-124-7
Table 11: Coffee exports by destination, 2017/18
Destination No. of 60-kg bags FOB Value %
Germany 113,636.96 36,502,289.25 15.75%
United States 113,421.78 42,026,682.39 15.72%
Belgium 101,235.22 31,370,405.96 14.03%
Korea, Republic of 87,111.00 25,129,162.36 12.07%
Sweden 58,823.83 20,020,999.94 8.15%
Australia 25,278.03 9,545,978.94 3.50%
Finland 23,076.00 6,667,018.26 3.20%
Norway 18,343.83 7,554,350.60 2.54%
United Kingdom 17,222.98 7,701,028.91 2.39%
Tunisia 15,945.33 2,364,784.63 2.21%
Canada 14,878.83 5,559,178.26 2.06%
Netherlands 13,411.82 4,764,372.73 1.86%
Japan 12,587.11 5,342,535.45 1.74%
Spain 10,637.00 3,641,816.71 1.47%
United Arab Emirates 10,454.00 1,303,651.22 1.45%
Romania 10,220.00 3,433,881.12 1.42%
Syrian Arab Republic 8,720.00 988,200.00 1.21%
Jordan 8,411.00 2,105,790.00 1.17%
France 7,747.00 1,289,510.33 1.07%
India 7,096.00 995,404.44 0.98%
Italy 6,750.87 1,223,143.75 0.94%
Switzerland 4,360.00 1,323,982.08 0.60%
New Zealand 4,051.80 1,359,062.68 0.56%
Taiwan 3,839.15 1,751,498.77 0.53%
Republic Of Djibouti 3,720.00 308,760.00 0.52%
Croatia 3,200.00 401,006.40 0.44%
Saudi Arabia 2,869.00 1,094,694.66 0.40%
China 2,446.78 921,103.90 0.34%
South Africa 1,843.22 565,870.15 0.26%
Madagascar 1,680.00 252,000.00 0.23%
Turkey 1,324.00 239,375.55 0.18%
Russian Federation 1,215.00 287,635.17 0.17%
Oman 989.00 155,106.90 0.14%
Poland 930.00 100,440.00 0.13%
Denmark 678.00 351,540.77 0.09%
Iran 646.67 139,405.00 0.09%
Malaysia 600.00 55,908.00 0.08%
Lebanon 462.45 79,675.24 0.06%
Hong Kong 414.00 157,228.28 0.06%
Bulgaria 320.00 121,339.33 0.04%
Greece 320.00 62,976.00 0.04%
Singapore 250.00 108,030.00 0.03%
Latvia 188.00 92,587.00 0.03%
ICO Coffee Profile KenyaICC-124-7 25
Destination No. of 60-kg bags FOB Value %
Philippines 100.00 36,068.40 0.01%
Czech Republic 18.17 7,537.00 0.00%
Belize 15.00 7,038.00 0.00%
Ireland 4.77 4,350.00 0.00%
Total 721,493.59 229,514,404.50 100.00%
11. EXPORT REGULATIONS
Kenyan coffee exports are regulated by the Coffee General Regulations 2002 and the Kenya
Coffee Trading Rules 2012. All coffee dealers (exporters) must be licensed annually by the
Coffee Directorate to be eligible to export Kenyan coffee.
Samples for all coffee on offer are submitted to the Central Sample Room, managed by the
Nairobi Coffee Exchange and the Coffee Directorate, for quality checks and distribution to
coffee dealers (exporters).
All coffee exports must obtain phytosanitary certification from the Kenya Plant Health
Inspectorate Services (KEPHIS) and Certificates of Origin from the Coffee Directorate. The
Directorate facilitates exports through a Single Window System, in which traders apply
online for approval of consignments from the comfort of their offices, thus reducing the
time required to process trade documents. All coffee dealers are expected to file returns of
all coffee exports with the Coffee Directorate, for monitoring and data collection purposes.
An arbitration mechanism has been established to deal with disputes before other judicial
processes, as stipulated in the law governing the sub-sector.
11.1. Export duty and taxes
Green coffee beans do not attract any export duty or tax, since they are considered to be a
raw material. However, export sales of roasted coffee are subject to an additional 16%
Value Added Tax on the value added to the coffee exported.
11.2. Other levies
No levies are imposed on coffee or coffee products in Kenya.
Kenya ICO Coffee Profile26 ICC-124-7 12. MACROECONOMIC ASPECTS OF THE COFFEE SECTOR The coffee sub-sector continues to play a central role in the social-economic development of Kenya. It is a source of employment, a foreign exchange earner and a source of food security in the country. However, a number of macroeconomic factors influence the performance of the coffee sector in Kenya. The high cost of production factors – fertilizers, spraying chemicals, irrigation water, electricity and labour – has made coffee farming an expensive venture. The high volatility of coffee prices also poses a challenge. Consequently, enterprises such as dairy, horticulture and real estate are now occupying land previously used for coffee production. The Kenyan Government has endeavored to improve coffee production and productivity by distributing coffee-specific fertilizers that are sold to farmers at subsidized prices. 12.1 Coffee and trade balance Agriculture is the backbone of Kenya’s economy, although the country is a net importer, especially of non-agricultural goods. In this regard, coffee exports contribute significantly to narrowing the gap between exports and imports. 12.2 Share of coffee in Gross Domestic Product Coffee contributes about 0.5% to Kenya’s GDP. 12.3 Employment generated by the coffee sub-sector: The coffee sub-sector is estimated to employ 30% (five million people) of the labour force in the agriculture sector. 13. ENVIRONMENTAL CHALLENGES The effects of climate change, such as unreliable and erratic rains with shorter seasons, are posing unanticipated challenges to coffee production. Extremely heavy rains lead to higher erosion levels, resulting in loss of soils, leaching of nutrients and consequent soil infertility. On the other hand, the dynamics of incidence of coffee pests and their management are evolving rapidly due to changing climatic conditions. The changing environment is also posing challenges to patterns of cherry ripening and drying of parchment because of unpredictable rainfall patterns. ICO Coffee Profile Kenya
ICC-124-7                                                                               27

The Coffee Research Institute has made various recommendations on approaches towards
environmentally sustainable coffee production systems. One such system is integrated
farming, in which mulching, conservation agriculture, organic fertilizers and use of bio
stimulants are recommended.

14.     PROSPECTS FOR COFFEE PRODUCTION

The country has developed a coffee revitalization programme anchored on a recent
National Report Task Force Report on the Coffee industry.

The coffee revitalization programme seeks to support farm expansion, adoption of
improved coffee varieties, increased usage of affordable/subsidized farm inputs, and
training of farmers on best agricultural practices. The government is also keen to enhance
availability of affordable credit to coffee growers. These efforts are projected to spur an
increase in Kenyan coffee production to over 100,000 MT of clean coffee in five years.

Kenya                                                                    ICO Coffee Profile
You can also read