EDNA sampled from stream networks correlates with camera trap detection rates of terrestrial mammals
←
→
Page content transcription
If your browser does not render page correctly, please read the page content below
www.nature.com/scientificreports
OPEN eDNA sampled from stream
networks correlates with camera
trap detection rates of terrestrial
mammals
Arnaud Lyet1,2*, Loïc Pellissier3,4, Alice Valentini5, Tony Dejean5, Abigail Hehmeyer1 &
Robin Naidoo1,6
Biodiversity monitoring delivers vital information to those making conservation decisions.
Comprehensively measuring terrestrial biodiversity usually requires costly methods that can rarely
be deployed at large spatial scales over multiple time periods, limiting conservation efficiency. Here
we investigated the capacity of environmental DNA (eDNA) from stream water samples to survey
terrestrial mammal diversity at multiple spatial scales within a large catchment. We compared
biodiversity information recovered using an eDNA metabarcoding approach with data from a dense
camera trap survey, as well as the sampling costs of both methods. Via the sampling of large volumes
of water from the two largest streams that drained the study area, eDNA metabarcoding provided
information on the presence and detection probabilities of 35 mammal taxa, 25% more than camera
traps and for half the cost. While eDNA metabarcoding had limited capacity to detect felid species
and provide individual-level demographic information, it is a cost-efficient method for large-scale
monitoring of terrestrial mammals that can offer sufficient information to solve many conservation
problems.
Data quality plays a critical role in detecting and understanding biodiversity change (e.g. ref.1,2), but generating
information over entire landscapes with robust and repeatable sampling is generally outside the scope of most
management and conservation p rograms3. The taxonomic groups most often in need of conservation efforts,
such as vertebrate predators and their prey4–7, are also the most elusive and difficult to monitor. As a result,
conservation decisions are often made using outdated, static and/or fragmentary data that do not necessarily
reflect how species use the landscape, and are therefore more likely to fail8,9. For decades, the need for higher
quality biodiversity information balanced with budget, time and capacity constraints has motivated the search
for more cost-efficient methods and optimal sampling designs for biodiversity across wide landscapes10. Efficient
sampling designs would enable balancing the benefits of collecting presence or abundance data at a large number
of sites with the costs of field s ampling11. While it remains a challenge, continuing technological advances sug-
gest that trade‐offs between sampling precision, sample size and the extent of the sampling a rea12 might soon be
transformed by novel biomonitoring methods.
The gap in both spatial and temporal biodiversity data for conservation could be filled by environmental
DNA metabarcoding approaches (eDNA hereafter)13, which enables the capture, amplification and sequencing of
DNA molecules from aquatic environments that allow the inference of species p resence14. Networks of streams,
through which precipitation percolates, function as conveyor belts of DNA from the entire landscape15.While
eDNA from stream water has mainly been used to detect aquatic o rganisms16, it also offers the potential for
detecting terrestrial organisms17,18, and could be used for quantitative assessment of terrestrial biodiversity. A
deeper understanding of the detectability of terrestrial organisms via stream eDNA would allow more efficient
use of this approach for monitoring biodiversity and conservation19,20. Unlike aquatic animals whose DNA is
inherently in the water, the mechanisms by which the DNA of a terrestrial animal is transferred to stream water
are complex and likely depend on the behaviour of the a nimal21. Where the animal goes and what it does affects
1
World Wildlife Fund, Wildlife Conservation Team, Washington, DC, USA. 2World Wild Fund for Nature, Tigers
Alive Initiative, Singapore, Singapore. 3Landscape Ecology, Institute of Terrestrial Ecosystems, Department of
Environmental Systems Science, ETH Zürich, Zürich, Switzerland. 4Swiss Federal Institute for Forest, Snow and
Landscape Research WSL, Birmensdorf, Switzerland. 5SPYGEN, Le Bourget du Lac, France. 6University of British
Columbia, Vancouver, BC, Canada. *email: arnaud.lyet@wwfus.org
Scientific Reports | (2021) 11:11362 | https://doi.org/10.1038/s41598-021-90598-5 1
Vol.:(0123456789)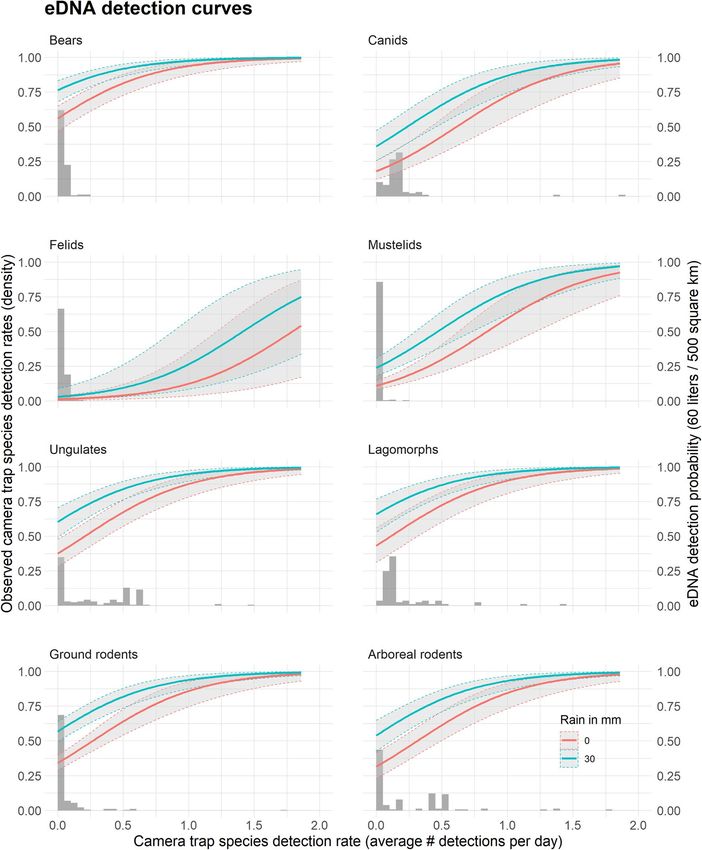
www.nature.com/scientificreports/

          Scientific Reports |   (2021) 11:11362 |   https://doi.org/10.1038/s41598-021-90598-5   2

Vol:.(1234567890)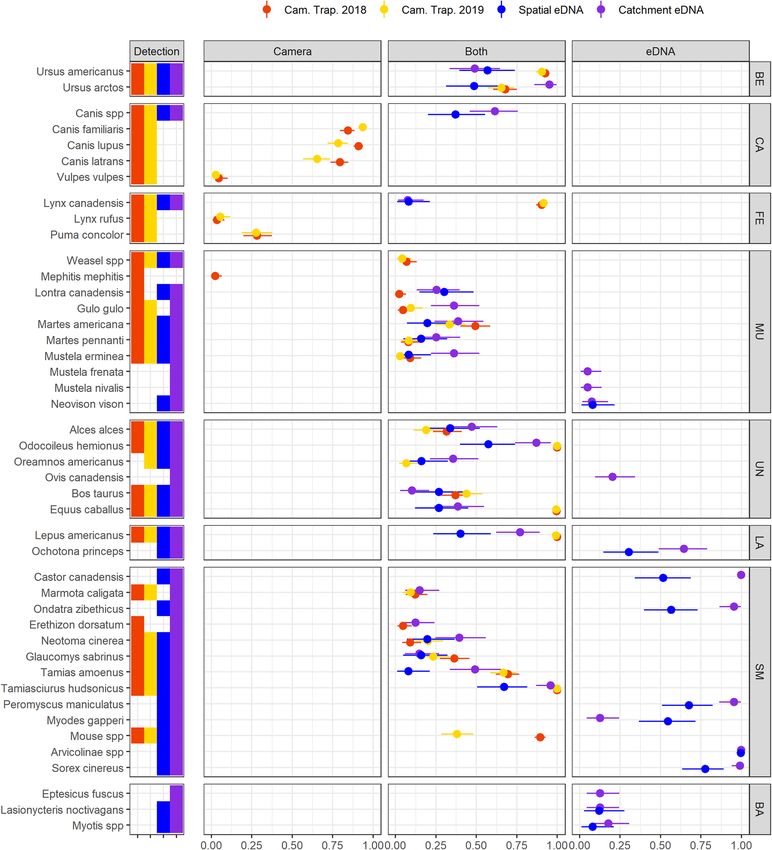
www.nature.com/scientificreports/
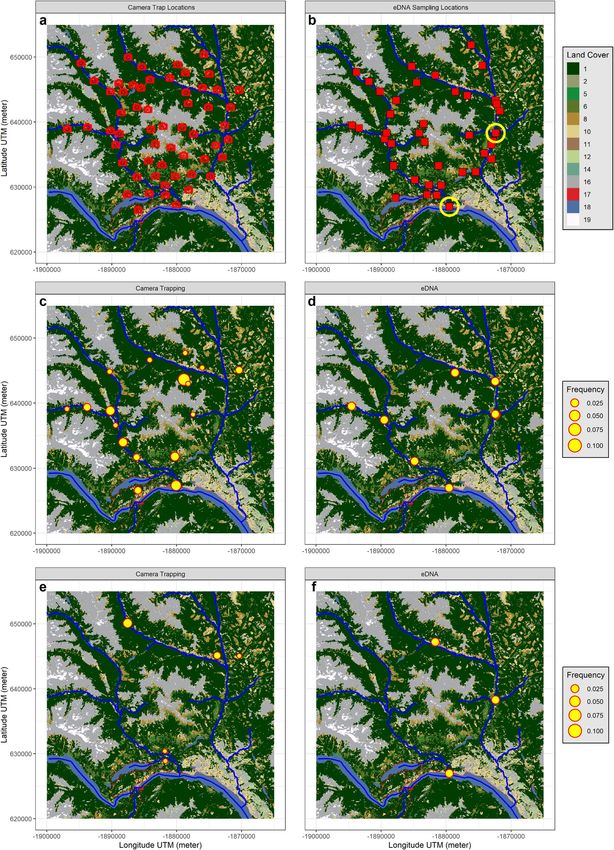
◂Figure 1. Study area, sampling location and species detection examples. The top of the figure indicates North
and the scale is given by the latitude and longitude graduations shown in Universal Transverse Mercator
(UTM) in meter (see Supplementary Figure 1 for the general location of the study area in British Columbia).
The top row panel (a,b) shows the sampling sites within the study area’s hydrological system, the camera trap
(a) and the eDNA sampling locations (b) in 2018 (red squares) and 2019 (yellow circles). The main streams are
shown on the maps (blue lines) as well as the main Land Cover types. Code descriptions: 1, 2, 5, 6 = forest; 8,
11 = grasslands and 10, 12 = shrublands; 14 = wetland, 16 = barren lands; 17 = urban; 18 = water and 19 = snow
and ice. The UTM coordinates in meter are shown on both x and y axis. The two bottom rows (c–f) show the
comparison of camera trap 2018 (left) vs. eDNA 2018 (right) detection of two species, Alces alces (c,d), and
Martes pennanti (e,f), in the study area. For the camera trap method, the size of the circle indicates the average
number of independent detections per day at the station. For eDNA, the circle only indicates that the species
was detected in at least one sample at the location. The maps were created using R v4.0.355 (https://cran.r-proje
ct.org/).
the quantity and quality of interaction with water, for example swimming, wallowing, release of saliva while
drinking, and deposition of urine or faeces in w ater22–25. Ecological factors such as the abundance and distribu-
tion of the species, and its position in the food chain—faeces dropped in water will transfer DNA of the host
species and of all animal species c onsumed26—might also affect the detection probability of taxonomic groups
within water eDNA samples. When combined with environmental properties of hydrological networks such as
the size of the stream27, the drainage area or the amount of precipitation, it is clear that a variety of factors could
influence terrestrial species detectability via e DNA17,28.
Here, we evaluate the opportunities that eDNA offers for understanding the spatial and temporal distribu-
tion and detection probabilities of terrestrial species, and for documenting multiple facets of biodiversity at the
landscape scale. We propose a catchment-level eDNA sampling framework directed towards multispecies moni-
toring programs, and test it against conventional surveys of the terrestrial mammal assemblage in a mountainous
landscape in British Columbia, Canada. We evaluate the effectiveness of two different eDNA survey designs
based on the sampling of large volumes of stream water: a spatial design allowing fine scale site-level monitoring
vs. a catchment design sampling from two streams at the base of the catchment (Fig. 1). By contrasting these two
sampling approaches, we investigated the ability of eDNA to capture diversity at different spatial scales: at sites,
between sites, and across the entire landscape. We compared the eDNA surveys with a simultaneous camera trap
survey covering the same area, and with prior knowledge of the regional mammal community. We hypothesized
that species ecology would play a strong role in shaping the effectiveness of eDNA surveys for terrestrial mam-
mals: semi-aquatic and small mammals that are abundant and represent a large proportion of the diet of small
carnivores29 and birds of p rey30 would be amongst the most frequently detected groups, followed by herbivores
and omnivores which produce larger quantities of faeces and are more abundant29. In contrast, we expected that
carnivores at the top of the food chain would be more difficult to detect as they are present at lower abundance
and must drink from or enter a body of water for eDNA deposition to o ccur23–25. Moreover, in addition to spe-
cies’ life history attributes, we expected that physical characteristics and environmental conditions of the stream
channel sampled, including catchment area, stream size and precipitation, would all further influence the signal
recovered from terrestrial mammals via eDNA.
Results
The eDNA surveys involved filtrating a total of ~ 1,400 L of water in 2018 (50 samples from 42 sites) and ~ 2,300 L
in 2019 (36 samples from 2 sites). We obtained a total of 12,757,213 sequencing reads in 2018 and 7,641,854
reads in 2019, of which 6,310,334 (49.5%) and 4,308,349 (56.4%) were retained, respectively, after bioinformatic
filtering (see “Methods” section). The camera trap m onitoring31 involved 57 motion-triggered camera traps that
were active for a total of 5,746 trap-days in 2018 and 5,847 in 2019. They produced a total of 17,939 independent
pictures of mammals in 2018 and 17,946 in 2019.
Relative landscape‑level frequency. eDNA sampling effectively characterized mammal assemblage
properties at our study landscape. In terms of total diversity, across all sites, field replicates and years, eDNA
recorded 32 species-level detections, two genus-level detections, (Canis, Myotis) and one subfamily-level detec-
tion (Arvicolinae). Camera traps identified 27 unique species across all years and pictures (26 in 2018, and 24 in
2019) and captured small rodents and mustelids that could not be identified to the species-level (Fig. 2). eDNA
sampling uniquely detected and identified 14 taxa (Fig. 2)—12 species-level, one genus-level (Myotis) and one
subfamily-level (Arvicolinae)—but missed the detection of four species of carnivores: the commonly-detected
Puma concolor (31 pictures in 2018 and 29 in 2019), as well as Vulpes vulpes, Lynx rufus, and Mephitis mephitis
which were amongst the least frequently detected mammals (respectively 3, 3, and 1 pictures in 2018 and 1, 3,
and 0 pictures in 2019). Canis spp were detected in 9 eDNA samples in 2018 and 23 samples in 2019, but the 12S
marker used could not differentiate between C. lupus lupus, C. lupus domesticus and C. latrans.
We also found that eDNA sampling performed at the base of the catchments in 2019 (catchment design)
recovered a higher diversity of species than the sum of local site-level sampling in 2018 (spatial design): 32 species
and three unresolved taxa for the former versus 25 species and three unresolved taxa for the latter (Fig. 2, Sup-
plementary Table 1a,b). In addition, the detection probability per volume (i.e., detection probability per species
per 60 L of water averaged across all samples in the same year; see “Methods” section) was superior or equivalent
for all species in the catchment design except for Myodes gapperi. Despite discrepancies in recovered diversity, we
Scientific Reports | (2021) 11:11362 | https://doi.org/10.1038/s41598-021-90598-5 3
Vol.:(0123456789)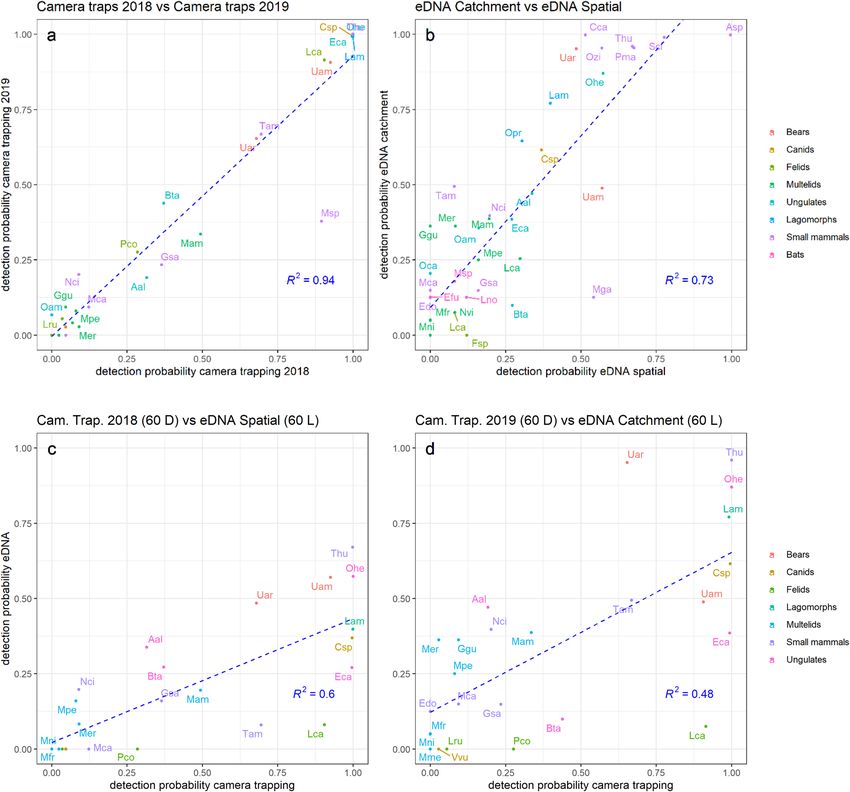
www.nature.com/scientificreports/

                                            Figure 2.  Overall species detection probabilities. To highlight the differences between methods, we divided the
                                            figure in three panels labelled “Camera”, “Both”, and “eDNA”. The left panel shows species detected via camera
                                            trapping only, the middle panel shows species detected by both camera trapping (red and yellow) and either
                                            eDNA sampling strategy (blue and purple), and the right panel shows species detected only by eDNA. The plain
                                            circles indicate the average detection probabilities for every species. The horizontal bars show the limit of the
                                            95% Bayesian Credibility Interval. Scientific names of the taxa are on the left of the panel. Taxa are grouped
                                            by higher taxonomic level, which code is displayed on the right of the figure: BE for Bears, CA for canids, FE
                                            for felids, UN for ungulates, LA for lagomorphs, SM for small mammals, and BA for bats. The figure does not
                                            include 3 additional species (Rangifer tarandus, Mus musculus and Felis spp) each detected in at least one eDNA
                                            sample, but which detection might result from contamination (see supplementary Tables 1a,b).

          Scientific Reports |   (2021) 11:11362 |               https://doi.org/10.1038/s41598-021-90598-5                                                 4

Vol:.(1234567890)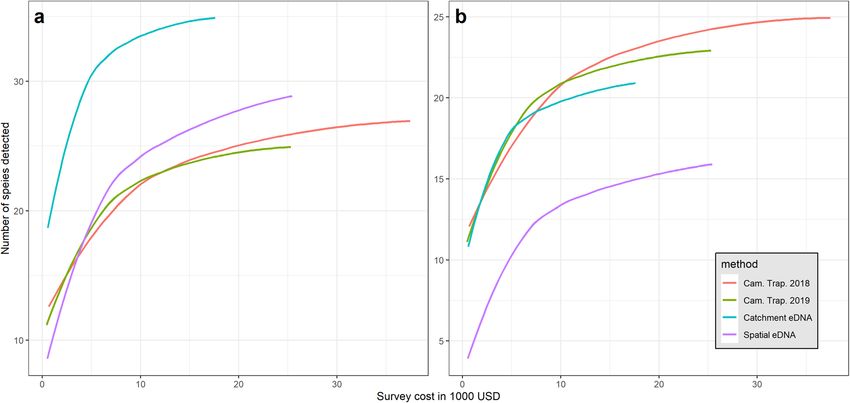
www.nature.com/scientificreports/
Figure 3. Species detection correlations between years and between methods. The top panels show the
comparison of the average detection probabilities between 2018 and 2019 camera trapping surveys (a), and
between catchment (y-axis) and spatial (x-axis) eDNA sampling strategies (b). Panel (a) includes only species
targeted by the camera trap surveys, while panel (b) includes all species. The bottom panels (c,d) show the
comparison of average detection probabilities between camera trapping (x-axis) and eDNA (y-axis), and
includes only the species targeted by camera trap surveys: panel (c) shows camera trapping 2018 vs spatial
eDNA, and panel (d) shows camera trapping 2019 vs catchment eDNA. Each individual species is represented
by a dot and its associated label corresponds to the first letter of the genus followed by two first letters of the
species name (e.g. “Uam” for Ursus americanus, or “Csp” for Canis spp). Full taxonomic names can be cross-
referenced with the y-axis of Fig. 2. The dotted lines show the linear regression between the two variables. R 2 is
the coefficient of correlation of the regression and is shown at the bottom right corner on each panel.
found a strong correlation between eDNA detection probability in the two independent sampling years of 2018
and 2019 (R2 = 0.73; Fig. 3) suggesting a robust temporal signal of detection probabilities within eDNA samples.
While eDNA samples for the spatial design and catchment design were collected from different years, the
camera trap survey suggested the relative frequency of species present in the study area did not vary between the
two years. First, camera detection rates per species were similar between 2018 and 2019 ( R2 = 0.94), suggesting
a stable community of mammals in the study area (Fig. 3, Supplementary Figure 6). Additionally, for species
targeted by camera traps, the detection probabilities recovered from both eDNA sampling strategies showed
significant positive associations with the average camera trap detection probabilities estimated in 2018 and 2019
(R2 = 0.61 in 2018, R
2 = 0.49 in 2019, Fig. 3, see “Methods” section).
Scientific Reports | (2021) 11:11362 | https://doi.org/10.1038/s41598-021-90598-5 5
Vol.:(0123456789)www.nature.com/scientificreports/
Site-level (or sample-level for catchment eDNA) diversity estimates showed more contrasting patterns between
eDNA and camera trap survey methods. We found that camera traps recovered a higher diversity per site than
eDNA spatial, while eDNA spatial had a stronger turnover of species among sites, partly explained by differ-
ences in local stream environmental conditions or species-specific detection probabilities. The average site-level
diversity was 5.6 species for eDNA spatial, 15.2 for eDNA catchment, 8.8 for camera trapping in 2018 and 8.0 for
2019. The proportion of diversity turnover between sites (or samples for catchment eDNA) was 0.66 and 0.68 for
camera trapping in 2018 and 2019, 0.81 and 0.57 for eDNA spatial and catchment, respectively.
Effect of taxonomic group, local environment, and year on species detection using eDNA. We
found that taxonomic group, species ecology and environmental factors explained differences among detection
patterns observed between samples, sites, species and methods. In general, species that were frequently and
widely detected on the camera grid were also frequently and widely detected in our eDNA samples, while those
rarely detected were also rare in our eDNA samples (Fig. 1, Supplementary Figure 2). We found that species
detection probability from eDNA was associated with taxonomy, even when the effect of local environmental
conditions and spatial variation patterns in species’ camera trap detection rates were accounted for (see “Meth-
ods” section and Supplementary Tables 2a,b). Small mammals had the highest average detection probabilities
(0.50 and 0.59 in 2018 and 2019, respectively), followed by lagomorphs (0.34 and 0.67) and ungulates (0.31 and
0.38), with the lowest for carnivores (0.23 and 0.32) and bats (0.10 and 0.14). In addition, we found significant
differences in detections between ecological groups related to diet preference, with a higher detection of species
with mixed (omnivores) and plant-based (herbivores) diets as compared to species with exclusively animal-
based (carnivores) diets (see model selection and parameter estimates in Supplementary Tables 3a,b). The model
further indicates that eDNA site detection probability correlates with the catchment area, the volume of water fil-
tered, and precipitation intensity (see taxonomic detection curves Fig. 4), all of which are likely to affect the qual-
ity of the information recovered from eDNA. Despite the eDNA catchment and spatial sampling design being
implemented in two different years, we found no evidence of a residual year effect that could have been caused
by environmental factors not included in our models. In the three model selection procedures performed, the
best models that included the year effect were not significantly better than the best model without a year effect. In
addition, the beta estimates for this effect were close to zero in all cases, with confidence intervals that included
zero (Supplementary Tables 2, 3 and 5).
Survey cost estimation and comparative cost‑efficiency. From an estimation of the total cost of
each survey type (Table 1, Supplementary Table 4), we assessed the relative cost-efficiency of cameras and eDNA
sampling to recover diversity indicators. For each method and year, we investigated the relationship between
the number of species detected and the cost of the survey (Fig. 5). We found that the eDNA catchment design
yields more species detections per dollar invested, while the eDNA spatial design and camera trap surveys had
similar cost-effectiveness. In particular, the detection of 20 taxa required ten cameras in 2018, fourteen cameras
in 2019, ten spatial samples of water in 2018, and only two catchment water samples in 2019. The respective costs
were evaluated at USD $6,710, $6,370, $5,190, and $1,136. Overall, the results indicate that the eDNA catchment
design is more cost-efficient than the spatial design for the assessment of total diversity of species. In addition, our
results show that the cost-efficiency of eDNA sampling could be further improved by collecting larger volumes
of water than the standard 60 L used to monitor fish27,32, and by sampling immediately after heavy rainfall (Sup-
plementary Tables 5a,b, Supplementary Figure 3). Our best model predicts that the filtration of 90 L of water
from a large stream (600 km2 catchment) after a 30 mm rainfall would yield the detection of 23 species, while
60 L would only yield 19 species.
Discussion and conclusions
Due to the fractal nature of stream networks33 and the conveyor effect of waterflow, we show how sampling
eDNA from streams can allow quantification of the presence/absence and detection probabilities of a landscape’s
mammalian fauna, even for most species present at low density, aside from felids and canids (Figs. 2, 3). Our data
demonstrate that eDNA approaches can inventory a broad diversity of terrestrial mammals in a cost-efficient
manner at the landscape scale, despite recent opinions to the c ontrary21. Specifically, an integrative sampling
design with large volumes of water collected from a few large streams within a catchment area, offers a more
cost-efficient approach to quantifying biodiversity, compared with the sampling of multiple small streams scat-
tered throughout this same area.
eDNA recovered from water samples integrates an occupancy signal of both aquatic and terrestrial organisms,
offering a new monitoring tool for conservation22,34. Existing studies comparing eDNA from water17,18 or from
soil21 to camera trapping in the same area showed that for a few terrestrial species, their ability to be detected from
eDNA was associated with their behaviour. For instance, Sales et al.17 showed that water based eDNA metabar-
coding provided detection rates comparable or superior to conventional survey methods per unit of survey effort
for three species. However, these studies were conducted on a small scale, with small volumes of water filtered
and low eDNA and camera trap sampling efforts, which raised questions on the capacity to use eDNA at larger
scales21. Our study used a multiscale sampling design in a large landscape, with intensive camera trapping (57
camera trap locations) and large volumes of water (~ 3700 L) from numerous streams (42 locations) and showed
that eDNA can, in fact, provide a more cost-efficient approach for monitoring mammals over large landscapes.
Conservation requires not only information about species presence/absence, but also requires quantification
of the relative abundance of species to detect early trends in population dynamics35–37. Here, we show that a
relationship exists at the catchment scale between eDNA detection probability and camera trap detection rates
of terrestrial mammals. In addition, the strong correlation between the average eDNA detection probability in
Scientific Reports | (2021) 11:11362 | https://doi.org/10.1038/s41598-021-90598-5 6
Vol:.(1234567890)www.nature.com/scientificreports/
Figure 4. Taxonomic eDNA detection curves. Relationship between the eDNA detection probability at a
site (y-axis, right side), the average camera trap detection rate at the catchment (x-axis), and the rain the
day prior to sampling (no rain in red, 30 mm in blue). Curves are calculated for 60 L of water filtered from a
stream draining a 500 k m2 catchment. The figure shows the mean predicted value (solid lines) and associated
standard errors (± SE, grey areas), calculated using the parameter estimates from the model with the lowest
AICc (Supplementary Tables 2a,b). The histograms represent the observed density distribution of the average
camera trap detection rates associated with eDNA sampling sites (y-axis, left side). For instance, on the “Ground
rodents”, the histogram indicates that more than 75% of the eDNA sampling locations were associated with a
catchment where on average across all camera trap located in the catchment, less than 0.2 ground rodents were
detected every day, or one ground rodent detected every 5 days. Data from 2018 and 2019 are combined.
2018 and 2019, the consistent relationship between eDNA detection probabilities, and camera trap detection
rates in consecutive years suggest that the results are robust over two years of sampling (Fig. 3). However, the
Scientific Reports | (2021) 11:11362 | https://doi.org/10.1038/s41598-021-90598-5 7
Vol.:(0123456789)www.nature.com/scientificreports/
# of eDNA samples or camera Cost per sample or camera
Method sites Re-usable equipment Single-use equipment Labour and lab work Logistic Total cost site
CT 2018 57 $11,970 $503 $24,800 $858 $38,273 $671
CT 2019 57 $840 $482 $23,600 $821 $25,922 $455
eDNA 2018 50 $1,053 $4,746 $19,203 $948 $25,950 $519
eDNA 2019 36 $3,498 $2,721 $13,858 $441 $20,465 $568
Table 1. Costs of terrestrial mammal inventory for each survey method and year (US $). The table shows
a summary of the costs for each survey method and year. Total cost calculation includes four budget
components: re-usable equipment, single use equipment, labour and lab work, and logistic. Re-usable equipment
includes camera traps, water pumps and rechargeable batteries, single use equipment includes AA batteries
and eDNA sampling kits, labour and lab work combines staff time for field work as well as time spent for data
analysis, logistic includes expenses related to local transportation from headquarters to field study sites. Cost
per eDNA sample or camera trap site is obtained by dividing the total cost by the number of samples or sites.
See Supplementary Table 4 for detailed description of each cost component.
Figure 5. Comparison of cost-efficiency between survey methods to recover the total mammal diversity at
the study scale. The figures show the curves of cumulative total mammals’ diversity (y-axis) per thousand USD
(x-axis) invested in the survey. Colours indicate the different survey methods and years as shown in the legend.
The panel (a) compares methods’ cost effectiveness when all the taxa detected by either method are included in
the analysis, while panel (b) only includes species targeted by camera trapping methods (see “Methods” section).
Detailed cost analyses per survey are presented in the method section (see also Table 1 and Supplementary
Table 4).
relationship between detection rates and true species abundance is unknown and would require further research
before stream eDNA detection could be used as a robust indicator of relative abundance for mammal species.
ndings17,22, we observed that detection patterns recovered from stream eDNA were
In agreement with recent fi
associated with certain ecological characteristics of species, such as diet and body size. Using a formal statisti-
cal modelling approach (as suggested in Sales et al.17), we showed that eDNA detection do correlate with these
ecological traits and with local detection rates of species measured by camera-traps (Supplementary Tables 2 and
3). Our results provide a robust framework to better understand and predict species detection patterns using
eDNA. Ecological associations of eDNA detection rates were mirrored in our detections by taxonomic groups
(Fig. 4), where we observed a higher detection of ungulates, lagomorphs and small mammals, and a poorer
detection of carnivores. Species with an animal-based diet (top predators) were much less detectable via eDNA
than those with a mixed (omnivorous predators) or exclusively plant-based diet (herbivores). This was true,
even when variation in local camera detection rate and the positive effect of animal body size were accounted
for. The detection curves in Fig. 4 showed the lowest eDNA detection profiles for strict carnivorous species like
felids29, and a slightly higher detection profile for mustelids and canids, which included omnivorous species
like Martes americana for the former, and Canis familiaris and Canis latrans for the latter42. Lower detection
rates for felid may stem from species’ ecologies17. We found a similar detectability for omnivore and herbivore
species (Supplementary Table 3) which could result from a high proportion of plants, seeds and fruits in the
Scientific Reports | (2021) 11:11362 | https://doi.org/10.1038/s41598-021-90598-5 8
Vol:.(1234567890)www.nature.com/scientificreports/
diet of omnivore species at the time of the sampling38. This, along with a very large body size, likely explains the
higher eDNA detection profile of bears as compared to strict carnivore species (Fig. 4). This result suggests that
detection of omnivores may vary seasonally in response to changes in their diet. As a result, accurate monitor-
ing of this ecological group might require extra constraints on protocols such as maintaining the same sampling
period every year or conducting seasonal sampling (which would increase costs). Despite the lack of statistical
evidence for higher detection of small mammals compared to other herbivores (ungulates and lagomorphs) as
we hypothesized (Fig. 4, Supplementary Table 2b), our results showed that among twelve taxa detected by eDNA,
six had a detection probability close to 1 in the catchment design, and six were detected and identified only by
eDNA (Fig. 2, Supplementary Table 1).
Although the intensive catchment sampling was not conducted the same year as the spatial sampling, we are
confident that differences between the two are not related to a higher number of species available in 2019 than
2018 in the sampling area. As shown on Fig. 2, more species were detected with camera traps in 2018 than in 2019
and the detection rates were very similar for all taxa except mouse spp group (see Figs. 2, 3a, and Supplementary
Figure 6). Site-level eDNA detection probabilities are related to three key environmental and sampling factors
that are easy to measure: the area of the watershed where the sample was taken, the intensity of the rain prior to
the sampling, and the volume of water filtered (Fig. 4). Our results are consistent with the hypothesis that both
the volume of water filtered and the duration of the filtration increase the probability of detection of every spe-
cies independently, hence a higher expected number of species detected per sample (Supplementary Figure 3,
Supplementary Tables 2, 3, and 5). Indeed, a larger volume of water increased the chance of capturing the DNA
present at low abundance in the body of water, and a longer sampling time is expected to increase the number of
direct (e.g. drinking) and indirect (e.g. bird faeces) animal-water interaction events that occur upstream before
or during the s ampling20,26,39. This knowledge can help increase the cost-efficiency of eDNA surveys by informing
when, where, and how to prioritize water collection. With careful modelling of detection probabilities, accounting
for species ecology, behaviour, and physical traits as well as environmental and sampling factors, eDNA could
become a superior cost-efficient technique for quantitative assessment of wildlife populations.
We recognize that the application of eDNA at a landscape scale has some limitations. While increasing the
catchment area increases species detection probability, there might be a threshold where the dilution of DNA in
a larger volume of water40,41 makes it impossible to detect rare species. This would limit our ability to detect rare
species across large areas. The results also showed limited power for felids and one canid present at low-density,
which suggest that a greater sampling effort and further optimization of the sampling design are required for
these taxa. As terrestrial mammals at the top of the food chain, felids and canids occur at lower densities and
are naturally more difficult to detect as they must drink from or enter a body of water for eDNA deposition to
occur23–25. However, the higher detection of these species with soil-based e DNA21 suggest that detection might
be increased by sampling water only after heavy rains or in early spring when the snow melts and transfers a
higher quantity of eDNA fragments to the stream network. The spatial detection model and predictive curves
(Fig. 4) provide a useful means to estimate the sampling effort needed to optimize the detection of these species
in their landscapes. We also recognize that while eDNA can provide information on a large number of taxa at
once it cannot provide the same level of detail on individuals and populations as can several other survey meth-
ods. Camera trapping, for instance, allows the identification of individuals for certain species from photos, the
application of statistical models to estimate population size and d ensity42, and the determination of behavioural
43
states and life history stages of individuals . This enhanced level of information on focal species, required to
assess conservation metrics such as minimum viable population and extinction r isk44, must be weighed against
the higher resources required for data collection, processing and analysis, which limits its application to a small
number of species. Conversely, with the same sampling and analysis technique, eDNA could potentially accu-
rately measure parameters of occupancy and detection probabilities of hundreds of species, in all taxonomic
groups (mammals, amphibians, fish, etc.), and in many compartments of the e cosystem20.
Our study demonstrates that eDNA sampling of the stream network integrates information on terrestrial
mammal presence and detection frequencies across an entire landscape, providing a significant advantage over
traditional methods that require expensive and time-consuming deployment of sampling devices. The eDNA
catchment sampling has significant potential application in conservation, including (1) collecting cost-effective
quantitative baseline information on diverse wildlife species, from small rodents to large ungulates; (2) tracking
changes in community composition over time and the detection frequencies of species in relation to environ-
mental changes and human threats; (3) rapidly providing information on the status and possible disruption
of ecological functions of entire ecosystems (e.g., measuring prey availability for large carnivores); and (4)
cost-efficiently locating rare and nearly extinct species across large landscapes (although rare felids and canids
would require optimized field protocols). Our results suggest that the application of optimized eDNA sampling
strategies could transform how biodiversity is monitored in large landscapes, providing decision-makers with
more comprehensive quantitative biodiversity data and on faster time scales, ultimately improving our ability
to safeguard biodiversity.
Methods
Study area and general sampling design. We conducted our study in and around the South Chilcotin
Mountains provincial park (hereafter, "SCM") in southwestern British Columbia, Canada. The provincial park
was established in 2010 and covers 568 k m2 of forested mountains and alpine terrain. The SCM is notable for
its diversity of large wildlife species, including predators such as grizzly bear (Ursus arctos horribilis), wolverine
(Gulo gulo), and fisher (Pekania pennanti), as well as large ungulates such as moose (Alces alces), mule deer
(Odocoileus hemionus), and mountain goat (Oreamnos americanus)45,46. In addition to the protected area, there
is a mix of logging, mining, ranching, tourism, and private land holdings in the region. In order to obtain com-
Scientific Reports | (2021) 11:11362 | https://doi.org/10.1038/s41598-021-90598-5 9
Vol.:(0123456789)www.nature.com/scientificreports/
parable sampling of mammal species in the SCM we deployed two protocols in parallel—eDNA and camera
trapping—over a 1,216 km2 area defined by the two main watersheds (Fig. 1). We were primarily interested in
the comparative effectiveness of an eDNA “spatial sampling design” (i.e., collecting single water samples in many
small streams scattered throughout the study area) vs. a “catchment sampling design” (i.e., collecting many sam-
ples of water from two larger creeks that drain the entire study area) for the detection of terrestrial mammals.
Camera trap sampling design. We used camera traps to sample trails and logging roads used by wild-
life. From June 2018 until September 2019, we installed and monitored 57 camera traps spaced evenly across
the region using a hexagonal array of 3 km grids, with one camera per grid31. This spacing allows for effective
sampling of the range of medium- and large-bodied wildlife species using the area43,47. Cameras were set out to
maximize the detection of medium and large size mammals, and the survey grid was not expected to detect high
alpine (Ovis canadensis, Oreamnos americanus, Ochotona princeps), aquatic (Neovison vison, Lontra canadensis,
Castor canadensis, Ondatra zibethiucus), or volant species (bats) to any significant degree or in any relation to
their actual abundance in the environment. We identified to species level all pictures containing wildlife observa-
tions, including mammals, birds, and amphibians, although only mammal species were considered in this study
and some small mammals could not be reliably identified to species from camera trap images. We classified them
using the Camelot software package48. For the purpose of this study, we only used data from July to September,
in both 2018 and 2019, to provide a robust overview of the mammal community present in the area during the
snow-free summer months, and also to get some insight into the relative abundance and distribution of each
species. Despite some variation noticeable in some species, the weekly number of camera trap detections was
stable over the 3-month sampling period (Supplementary Figure 4).
eDNA sampling design. Using a Digital Elevation Model and derived hydrology network, we mapped all
streams and associated watersheds within the study area. Based on this map and the camera trap locations, we
implemented two different sampling designs. In 2018, the eDNA sampling sites were selected to match the spa-
tial distribution of camera trap sites as closely as possible ("spatial design"). To do this, we identified the nearest
streams to each camera trap and chose an eDNA sampling site on an accessible portion of the stream, wider than
one meter, and for which the upstream catchment area contained the camera trap in question. Between Sep-
tember 14th and September 2 5th 2018 we collected a total of 50 eDNA samples from 42 sites, with two replicates
taken at eight of these sites (Fig. 1). The distance between the sampling site and nearest camera trap ranged from
119 to 1666 m. Each sample consisted of the in situ filtration of 30 L of water using a portable Vampire pump
on speed level 2 running for 30 min, a sterile filtration kit, and a VigiDNA filter (SPYGEN, Le Bourget du Lac).
When possible, water was pumped from the middle of the stream, or otherwise from the fastest flowing portion
of the stream accessible from the shore. The total quantity of water that could be filtered depended on the con-
centration of suspended sediment (CSS). Clogging from sediment sometimes resulted in filtration ending before
30 min; when this happened, we estimated the approximate volume of water filtered based on average flow rates
of one litre per minute.
In 2019, we tested a different sampling approach, collecting water only from the mouth of two large creeks
that drained the two main watersheds of the study area ("catchment design"; Fig. 1). For this protocol we used a
12 Volt Athena Peristaltic Pump (#ATHPERI-10000) that allowed the filtration of a larger volume of water per
sample. We used two pumps simultaneously to collect 36 samples over 8 days (4 days per site) between Septem-
ber 10th and 20th 2019. On the first two days, we collected six samples at each site, with the speed of the pump
adjusted appropriately to filter: (a) 70–80 L of water over 5 h, (b) 50–60 L over 2 h, and (c) 25–35 L over 30 min
(two replicate samples were collected on each setting). Every other day, we collected four samples daily with the
pump adjusted to scenario (a). Measurements of the flow were performed every 30 min while sampling and values
were averaged over the sampling period to build the covariate. For both years, immediately after the filtration,
the filters were filled with 80 mL of CL1 preservative buffer (SPYGEN), labelled, and stored at room temperature.
eDNA laboratory methods. The DNA extraction was performed in a dedicated controlled DNA labora-
tory equipped with separate cleanrooms with positive air pressure, UV treatment and frequent air renewal.
Decontamination procedures were conducted before and after all manipulations. The DNA extraction and
amplification were performed following the protocol of Pont et al.27. The amplification step was conducted
following Valentini et al.49. A universal mammal 12S mitochondrial rDNA primer (Mamm01: 5′-CCG CCC
GTC ACY CTC CT-3′ and 5′-GTA YRC TTA CCW TGT TAC GAC-3′; Taberlet et al.50) with human blocking
primer (5′-CCT CCT CAA GTA TAC TTC AAA GGA CAT TTA ACT-3′) was used to amplify metabarcoding
sequences. Five negative extraction controls and two negative PCR controls (ultrapure water) were amplified
and sequenced in parallel to the samples to monitor possible contaminations. The purified PCR products were
pooled in equal volumes to achieve a theoretical sequencing depth of 300,000 reads per sample. Two libraries
were prepared using the MetaFast protocol and two paired-end sequencing (2 × 125 bp) was carried out using an
Illumina HiSeq 2500 sequencer on a HiSeq Rapid Flow Cell v2 using the HiSeq Rapid SBS Kit v2 (Illumina, San
Diego, CA, USA) for 2018 samples and a MiSeq (2 × 125 bp, Illumina, San Diego, CA, USA) with the MiSeq Flow
Cell Kit Version3 (Illumina, San Diego, CA, USA) for 2019 samples following the manufacturer’s instructions
at Fasteris (Geneva, Switzerland). Bioinformatic analysis was performed using the programs in the OBITools
package (http://metabarcoding.org/obitools, ref.51) following Pont et al.27. The program ecotag was used for the
taxonomic assignment of Molecular Operational Taxonomic Units (MOTUs) with the sequences extracted from
release 138 of European Nucleotide Archive (ENA) database (standard sequences) and a curated database, built
from the previous one, by retrieving only the mammalians species present in British Columbia (87 species in
total) following the IUCN red list (https://www.iucnredlist.org). All MOTUs present in the negative controls
Scientific Reports | (2021) 11:11362 | https://doi.org/10.1038/s41598-021-90598-5 10
Vol:.(1234567890)www.nature.com/scientificreports/
were deleted from the database as suggested by Barba et al.52. The species found in the negative controls were
human and domestic animals: chicken, turkey, pig, dog and cat. These two latter species had different sequences
than those present in the field samples. MOTUs showing less than 96% similarity to the reference databases were
removed. MOTUs showing a match with sequences of a unique taxa were assigned to the species level. MOTUs
showing a match with more than one taxon in the reference database, were assigned to the genus or subfamily
taxonomic level. A species of the genus Marmota was included in the results despite a match lower than 95%,
because the closest taxa available in the database was a close relative species of the same genus. Finally, consider-
ing the erroneous assignments of a few sequences to the wrong sample due to tag-jumps53, all sequences with a
frequency of occurrence below 0.001 per taxon and per library were discarded. After the bioinformatic filters, no
reads were found in the extraction and PCR controls. The results were analysed as 1/0 (detection/non-detection)
in each eDNA sample (see below).
Estimating average detection probabilities by species and sampling method. In order to com-
pare the relative detection power of eDNA vs camera trapping, and among eDNA sampling strategies, we esti-
mated for each species (or higher-level taxa when species level identification was not possible), the detection
probability per 60 L of water sample for eDNA, and per 60 days of camera trapping. This choice is arbitrary
but consistent with the effort level recommended in camera trapping surveys for community a ssessments54.
Although no guideline exists for water eDNA survey of terrestrial mammals, 60 L is the volume of water recom-
mended for surveys of aquatic organisms32. In this analysis, because we were interested in the global pattern of
detection at the level of the study area, we assumed the likelihood of detecting a given species to be equivalent
across all sites or samples. We used a Bayesian statistical analysis approach to estimate the detection probabili-
ties of each species with each method and sampling design. All the analyses were performed using program R
v4.0.355 and JAGS software56 to use Markov Chain Monte Carlo (MCMC) to approximate posterior distributions
for every parameter. The detailed description of the approach and models are provided as Supplementary Meth-
ods (Supplementary Method 1), while the data and code can be found at the link provided in the Data and Code
Availability sections below.
Sampling costs and cost‑efficiency analysis. To obtain the costs per camera trap site and eDNA sam-
ple, we estimated the total cost of each survey and then divided it by the number of sites or samples (Table 1, Sup-
plementary Table 4). We considered four budget components: equipment, local transportation, staff time, and
lab work. Equipment was divided into reusable items (camera traps, water pumps and rechargeable batteries)
that can be used during several survey seasons, and single use items (AA batteries, eDNA sampling kits). Staff
time included the time spent by researchers in the field for each sampling scheme. Local transportation included
only expenses related to car usage to reach the field sites. It was estimated using the total distance travelled from
the field station headquarters to the sites or cluster of sites, and a standard cost per kilometre was applied. Lab
work included all activities that cannot be conducted in the field such as eDNA analysis and post-processing of
camera trap images for species identification. Lab costs for eDNA included analyses such as DNA extraction,
PCR amplification, sequencing, and bioinformatics. The estimated costs were based on total labour days for each
technique.
Using results from all eDNA samples and camera traps, we computed the mean site-level diversity, propor-
tion of species turnover between sites57 and total diversity or observed species richness (e.g. ref.58,59) for each
sampling method and design. To compare the effectiveness of each sampling design to recover the diversity of
mammals at multiple scales, we used bootstrap resampling method (with 1000 iterations) to estimate species
turnover between site and total diversity values and associated 95% confidence intervals along the full gradient of
sampling effort allocated in the field (i.e. 1 to 57 camera traps, 1 to 50 eDNA samples in 2018, and 1 to 36 eDNA
samples in 2019). Two versions of diversity parameters were computed for eDNA: one that considered all the
taxa detected by this method, the other that included only species detectable and identifiable by camera trapping
methods (i.e., excluding volant mammals, most species of small rodents, and semi-aquatic species). Finally, for
each method and year, we multiplied the number of samples or sites by their respective costs (Table 1) to plot
the relationship between each diversity parameter and the corresponding cost of deploying N camera traps or
collecting and analysing N water samples.
Modelling site diversity (number of species per sample) and species detection probabilities
in relation to environmental factors, local abundance, and taxonomic group. First, we used
a Generalized Linear Model (GLM) to analyse the effects of environmental factors and sampling covariates on
the number of species detected by eDNA at the site level. We used Poisson regression, which assumes that the
outcome variable comes from a Poisson distribution and uses the logarithm as the link function. Our analysis
was conducted on eDNA samples from both 2018 and 2019 with all taxa detected by this method (Fig. 2). We
considered four covariates: area of the upstream watershed, volume of water filtered, rainfall on the day preced-
ing the sampling (www.worldweatheronline.com/gold-bridge-weather-history), and year (as factor) to account
for possible annual variation not explained by the three other covariates. For each set of models, we tested all
possible combinations of one, two, three, and four covariates in an additive manner.
Second, we used a similar GLM approach to analyse the spatial relationship between eDNA detection of a
species at a site and its average detection rate across all camera traps located in the catchment defined by the
eDNA sampling site. Detection rates contain information about local animal density and intensity of their local
activity, and was not used in our study as a proxy for species relative abundance as the relationship between ani-
mal density and detection rates is complex and species dependent (see for instance ref.60–62). We used a Binomial
logistic regression, which assumes that the outcome variable comes from a Binomial distribution with a logit
Scientific Reports | (2021) 11:11362 | https://doi.org/10.1038/s41598-021-90598-5 11
Vol.:(0123456789)www.nature.com/scientificreports/
link. In addition to the local detection rate, we also considered the environmental and sampling factors described
above, and a family-level taxonomic effect in one set of models (see Supplementary Table 2a), or, in a second
set of models, the diet and average weight of the s pecies63 instead of the taxonomic group (see Supplementary
Tables 3a,b). For each set of models, we tested all possible combinations of one, two, three, four, five, six, and
seven covariates in an additive manner. For this analysis, we only considered species that were targeted by our
camera trap survey (see above). We used a model selection approach based on Akaike Information Criteria for
small sample size (AICc) to compare models with each other and with the null m odel64. The model with the
smallest AICc was considered to best describe the data. Competing models with AICc differences lower than 2
were considered equivalent. Finally, we used the parameter estimates from the best model to predict the number
of species detected and the species detection probabilities per sample under different plausible sets of values for
all significant explanatory variables.
Data availability
All Illumina raw sequences data are available on Dryad at with the identifier https://datadr yad.org/stash/share/
29rN8nHrTQpt3l3wuUuDil4ebW2AIQcH13Ll43PQ2lg.
Code availability
The camera trapping datasets that support the findings of this study and R code used to produce the results are
provide R codes in GitHub at https://doi.org/10.5281/zenodo.4771193.
Received: 3 March 2021; Accepted: 13 May 2021
References
1. Pereira, H. M. et al. Scenarios for global biodiversity in the 21st century. Science 330, 1496–1501 (2010).
2. Pereira, H. M. et al. Essential biodiversity variables. Science 339, 277–278 (2013).
3. Stem, C., Margoluis, R., Salafsky, N. & Brown, M. Monitoring and evaluation in conservation: a review of trends and approaches.
Conserv. Biol. 19, 295–309 (2005).
4. Atwood, T. B. et al. Herbivores at the highest risk of extinction among mammals, birds, and reptiles. Sci. Adv. 6, eabb8458 (2020).
5. Cardillo, M. et al. Human population density and extinction risk in the world’s carnivores. PLoS Biol 2, e197 (2004).
6. Ripple, W. J. et al. Status and ecological effects of the world’s largest carnivores. Science 343, 1241484 (2014).
7. Wolf, C. & Ripple, W. J. Prey depletion as a threat to the world’s large carnivores. R. Soc. Open Sci. 3, 160252 (2016).
8. Kissling, W. D. et al. Building essential biodiversity variables (EBV s) of species distribution and abundance at a global scale. Biol.
Rev. 93, 600–625 (2018).
9. Nesshöver, C., Livoreil, B., Schindler, S. & Vandewalle, M. Challenges and solutions for networking knowledge holders and better
informing decision-making on biodiversity and ecosystem services. Biodivers. Conserv. 25, 1207–1214 (2016).
10. Gardner, T. A. et al. The cost-effectiveness of biodiversity surveys in tropical forests. Ecol. Lett. 11, 139–150 (2008).
11. Field, S. A., Tyre, A. J. & Possingham, H. P. Optimizing allocation of monitoring effort under economic and observational con-
straints. J. Wildl. Manag. 69, 473–482 (2005).
12. Braunisch, V. & Suchant, R. Predicting species distributions based on incomplete survey data: The trade-off between precision
and scale. Ecography 33, 826–840 (2010).
13. Taberlet, P., Coissac, E., Hajibabaei, M. & Rieseberg, L. H. Environmental DNA. Mol. Ecol. 21, 1789–1793 (2012).
14. Deiner, K. et al. Long-range PCR allows sequencing of mitochondrial genomes from environmental DNA. Methods Ecol. Evol. 8,
1888–1898 (2017).
15. Deiner, K., Walser, J.-C., Mächler, E. & Altermatt, F. Choice of capture and extraction methods affect detection of freshwater
biodiversity from environmental DNA. Biol. Conserv. 183, 53–63 (2015).
16. Tsuji, S., Takahara, T., Doi, H., Shibata, N. & Yamanaka, H. The detection of aquatic macroorganisms using environmental DNA
analysis—A review of methods for collection, extraction, and detection. Environ. DNA 1, 99–108 (2019).
17. Sales, N. G. et al. Fishing for mammals: Landscape-level monitoring of terrestrial and semi-aquatic communities using eDNA
from riverine systems. J. Appl. Ecol. 57, 707–716 (2020).
18. Sales, N. G. et al. Assessing the potential of environmental DNA metabarcoding for monitoring Neotropical mammals: a case
study in the Amazon and Atlantic Forest, Brazil. Mammal Rev. 50, 221–225 (2020).
19. Barnes, M. A. & Turner, C. R. The ecology of environmental DNA and implications for conservation genetics. Conserv. Genet. 17,
1–17 (2016).
20. Deiner, K. et al. Environmental DNA metabarcoding: Transforming how we survey animal and plant communities. Mol. Ecol. 26,
5872–5895 (2017).
21. Leempoel, K., Hebert, T. & Hadly, E. A. A comparison of eDNA to camera trapping for assessment of terrestrial mammal diversity.
Proc. R. Soc. B Biol. Sci. 287, 20192353 (2020).
22. Harper, L. R. et al. Environmental DNA (eDNA) metabarcoding of pond water as a tool to survey conservation and management
priority mammals. Biol. Conserv. 238, 108225 (2019).
23. Rodgers, T. W. & Mock, K. E. Drinking water as a source of environmental DNA for the detection of terrestrial wildlife species.
Conserv. Genet. Resour. 7, 693–696 (2015).
24. Ushio, M. et al. Environmental DNA enables detection of terrestrial mammals from forest pond water. Mol. Ecol. Resour. 17,
e63–e75 (2017).
25. Williams, K. E., Huyvaert, K. P., Vercauteren, K. C., Davis, A. J. & Piaggio, A. J. Detection and persistence of environmental DNA
from an invasive, terrestrial mammal. Ecol. Evol. 8, 688–695 (2018).
26. Merkes, C. M., McCalla, S. G., Jensen, N. R., Gaikowski, M. P. & Amberg, J. J. Persistence of DNA in carcasses, slime and avian
feces may affect interpretation of environmental DNA data. PLoS ONE 9, e113346 (2014).
27. Pont, D. et al. Environmental DNA reveals quantitative patterns of fish biodiversity in large rivers despite its downstream trans-
portation. Sci. Rep. 8, 1–13 (2018).
28. Zinger, L. et al. Advances and prospects of environmental DNA in neotropical rainforests. Adv. Ecol. Res. 62, 331–373 (2020).
29. Withers, P. C., Cooper, C. E., Maloney, S. K., Bozinovic, F. & Cruz-Neto, A. P. Ecological and Environmental Physiology of Mammals
Vol. 5 (Oxford University Press, 2016).
30. Bicudo, J. E. P., Buttemer, W. A., Chappell, M. A., Pearson, J. T. & Bech, C. Ecological and Environmental Physiology of Birds Vol. 2
(Oxford University Press, 2010).
Scientific Reports | (2021) 11:11362 | https://doi.org/10.1038/s41598-021-90598-5 12
Vol:.(1234567890)www.nature.com/scientificreports/
31. Naidoo, R. & Burton, A. C. Relative effects of recreational activities on a temperate terrestrial wildlife assemblage. Conserv. Sci.
Pract. 2, e271 (2020).
32. Cantera, I. et al. Optimizing environmental DNA sampling effort for fish inventories in tropical streams and rivers. Sci. Rep. 9,
1–11 (2019).
33. Tarboton, D. G., Bras, R. L. & Rodriguez-Iturbe, I. The fractal nature of river networks. Water Resour. Res. 24, 1317–1322 (1988).
34. Ishige, T. et al. Tropical-forest mammals as detected by environmental DNA at natural saltlicks in Borneo. Biol. Conserv. 210,
281–285 (2017).
35. Joseph, L. N., Field, S. A., Wilcox, C. & Possingham, H. P. Presence–absence versus abundance data for monitoring threatened
species. Conserv. Biol. 20, 1679–1687 (2006).
36. Lacy, R. C. Lessons from 30 years of population viability analysis of wildlife populations. Zoo Biol. 38, 67–77 (2019).
37. Gärdenfors, U., Hilton-Taylor, C., Mace, G. M. & Rodríguez, J. P. The application of IUCN Red List criteria at regional levels.
Conserv. Biol. 15, 1206–1212 (2001).
38. Munro, R., Nielsen, S. E., Price, M., Stenhouse, G. & Boyce, M. S. Seasonal and diel patterns of grizzly bear diet and activity in
west-central Alberta. J. Mammal. 87, 1112–1121 (2006).
39. Deiner, K. & Altermatt, F. Transport distance of invertebrate environmental DNA in a natural river. PLoS ONE 9, e88786 (2014).
40. Hunter, M. E. et al. Detection limits of quantitative and digital PCR assays and their influence in presence–absence surveys of
environmental DNA. Mol. Ecol. Resour. 17, 221–229 (2017).
41. Roussel, J.-M., Paillisson, J.-M., Treguier, A. & Petit, E. The downside of eDNA as a survey tool in water bodies. J. Appl. Ecol. 52,
823–826 (2015).
42. Williams, B. K., Nichols, J. D. & Conroy, M. J. Analysis and Management of Animal Populations (Academic Press, 2002).
43. Burton, A. C. et al. Wildlife camera trapping: A review and recommendations for linking surveys to ecological processes. J. Appl.
Ecol. 52, 675–685 (2015).
44. Morris, W. F. et al. Quantitative Conservation Biology (Sinauer Sunderland, 2002).
45. Parks, B. C. South Chilcotin Mountains Park and Big Creek Park Management Plan (2019).
46. McLellan, M. L. et al. Divergent population trends following the cessation of legal grizzly bear hunting in southwestern British
Columbia, Canada. Biol. Conserv. 233, 247–254 (2019).
47. Kays, R. et al. Camera traps as sensor networks for monitoring animal communities. In 2009 IEEE 34th Conference on Local
Computer Networks 811–818. https://doi.org/10.1109/LCN.2009.5355046 (IEEE, 2009).
48. Hendry, H. & Mann, C. Camelot–intuitive software for camera trap data management. BioRxiv 203216 (2017).
49. Valentini, A. et al. Next-generation monitoring of aquatic biodiversity using environmental DNA metabarcoding. Mol. Ecol. 25,
929–942 (2016).
50. Taberlet, P., Bonin, A., Zinger, L. & Coissac, E. Environmental DNA: For biodiversity research and monitoring (Oxford University
Press, Oxford, 2018).
51. Boyer, F. et al. obitools: A unix-inspired software package for DNA metabarcoding. Mol. Ecol. Resour. 16, 176–182 (2016).
52. De Barba, M. et al. DNA metabarcoding multiplexing and validation of data accuracy for diet assessment: Application to omnivo-
rous diet. Mol. Ecol. Resour. 14, 306–323 (2014).
53. Schnell, I. B., Bohmann, K. & Gilbert, M. T. P. Tag jumps illuminated–reducing sequence-to-sample misidentifications in meta-
barcoding studies. Mol. Ecol. Resour. 15, 1289–1303 (2015).
54. Wearn, O. & Glover-Kapfer, P. Camera-trapping for conservation: A guide to best-practices. WWF Conserv. Technol. Ser. 1,
2019–2104 (2017).
55. R Core Team. R: A language and environment for statistical computing (R Foundation for Statistical Computing, 2020).
56. Plummer, M., et al.. JAGS: A program for analysis of Bayesian graphical models using Gibbs sampling. In Proceedings of the 3rd
International Workshop on Distributed Statistical Computing vol. 124, 1–10 (Vienna, Austria, 2003).
57. Tuomisto, H. A diversity of beta diversities: Straightening up a concept gone awry. Part 1. Defining beta diversity as a function of
alpha and gamma diversity. Ecography 33, 2–22 (2010).
58. Ahumada, J. A. et al. Community structure and diversity of tropical forest mammals: data from a global camera trap network.
Philos. Trans. R. Soc. B Biol. Sci. 366, 2703–2711 (2011).
59. Samejima, H., Ong, R., Lagan, P. & Kitayama, K. Camera-trapping rates of mammals and birds in a Bornean tropical rainforest
under sustainable forest management. For. Ecol. Manag. 270, 248–256 (2012).
60. Parsons, A. W. et al. Do occupancy or detection rates from camera traps reflect deer density?. J. Mammal. 98, 1547–1557 (2017).
61. Sollmann, R., Mohamed, A., Samejima, H. & Wilting, A. Risky business or simple solution–Relative abundance indices from
camera-trapping. Biol. Conserv. 159, 405–412 (2013).
62. Villette, P., Krebs, C. J., Jung, T. S. & Boonstra, R. Can camera trapping provide accurate estimates of small mammal (Myodes rutilus
and Peromyscus maniculatus) density in the boreal forest?. J. Mammal. 97, 32–40 (2016).
63. Feldhamer, G. A., Thompson, B. C. & Chapman, J. A. Wild Mammals of North America: Biology, Management, and Conservation
(The Johns Hopkins University Press, 2003).
64. Burnham, K. P. & Anderson, D. R. A Practical Information-Theoretic Approach. Model Selection Multimodel Inference 2nd edn, Vol.
2 (Springer, Berlin, 2002).
Acknowledgements
We thank Jonathan Grondin for his efficacy in providing the eDNA sampling equipment and SPYGEN staff
for their technical assistance in the eDNA laboratory. We thank Angela Brennan, Cole Burton, Chris Colton,
Sal DeMare, Debbie DeMare, Simon Donner, Dale Douglas, Mitch Fennell, Mike Jensen, Taylor Justason, Jen-
nifer Keene, Troy Knecht, Michelle Nortje, Colby Olsen, Geoff Playfair, Karen Playfair, Mark Simone, and Sean
Smukler for help in deploying and checking camera trap sites. Shauna Mahajan provided valuable comments
and edits on the manuscript. Permission to conduct research in the South Chilcotin Mountains Provincial Park
was granted by Craig Baillie from BC Parks under Letter of Authorization #19‐2018. We thank WWF-US, BC
Parks, Tyax Adventures, Habitat Conservation Trust Foundation, Lillooet Naturalist Society, WWF Tiger Alive
Initiative, and SPYGEN for funding support.
Author contributions
AL, RN, AV and TD conceived the study. AL and AH conducted the eDNA field sampling. AL, AV and LP
analysed the eDNA data. RN conducted the camera trapping field work and identified the species. All authors
wrote, edited and revised the paper. AL and RN acquired funding to support the study.
Scientific Reports | (2021) 11:11362 | https://doi.org/10.1038/s41598-021-90598-5 13
Vol.:(0123456789)You can also read