Olfactory Perception in Relation to the Physicochemical Odor Space - Preprints.org
←
→
Page content transcription
If your browser does not render page correctly, please read the page content below
Preprints (www.preprints.org) | NOT PEER-REVIEWED | Posted: 31 March 2021

 Article

 Olfactory Perception in Relation to the Physicochemical Odor
 Space
 Antonie Louise Bierling 1,2,*, Ilona Croy 2,3, Thomas Hummel 4, Gianaurelio Cuniberti 1 and Alexander Croy 1

 1 Institute for Materials Science, Technische Universität Dresden, Dresden, Germany; gianaurelio.cuniberti@tu-
 dresden.de; alexander.croy@tu-dresden.de
 2 Department of Psychotherapy and Psychosomatics, Technische Universität, Dresden, Germany; antonie.bier-
 ling@tu-dresden.de
 3 Department of Biological and Clinical Psychology, Friedrich‐Schiller‐University of Jena, Jena, Germany;
 ilona.croy@uni-jena.de
 4 Smell and Taste Clinic, Department of Otorhinolaryngology, Technische Universität, Dresden, Germany;
 thomas.hummel@tu-dresden.de

 * Correspondence: antonie.bierling@tu-dresden.de

 Abstract: A growing body of research aims at solving what is often referred to as the stimulus-percept
 problem in olfactory perception. Although computational efforts have made it possible to predict
 perceptual impressions from the physicochemical space of odors, studies with large psychophysical
 data sets from non-experts remain scarce. Following previous approaches, we developed a physi-
 cochemical odor space using 4,094 molecular descriptors of 1,389 odor molecules. For 20 of these
 odors, we examined associations with perceived pleasantness, intensity, odor quality and detection
 threshold, obtained from a dataset of 2,000 naïve participants. Our results show significant differ-
 ences in perceptual ratings, and we were able to replicate previous findings on the association be-
 tween perceptual ratings and the first dimensions of the physicochemical odor space. However, the
 present analyses also revealed striking interindividual variations in perceived pleasantness and in-
 tensity. Additionally, interactions between pleasantness, intensity, and olfactory and trigeminal
 qualitative dimensions were found. Our results support previous findings on the relation between
 structure and perception on the group level in our sample of non-expert raters. Nevertheless, human
 olfactory perception is no analytic process of molecule detection alone. Therefore, to gain an under-
 standing of stimulus-percept relationship in the individual, future studies should shift towards a
 more holistic view that takes into account the influences of context, experience and other interper-
 sonal characteristics.

 Keywords: physicochemical odor space; olfactory perception; molecule structure

 1. Introduction
 Although the sense of smell is the evolutionarily oldest sensory system and is capable
 of discriminating more than a trillion olfactory stimuli ([1], but also see [2] on the dimen-
 sionality of the odor space), many basic rules governing olfaction remain obscure to this
 day. As a chemical sense, olfaction relies on the sensory detection and perceptual inter-
 pretation of odorous molecules in the environment. A lot of research has tried to solve the
 intriguing question of the so-called “stimulus-percept-problem": How does the molecular
 structure of an odor map onto its olfactory perception (for an excellent overview see [3])?
 Despite a steadily growing field of research on this topic, the underlying mechanisms of
 whether and how an odor is perceived based on its structure are still incompletely under-
 stood, in contrast, for example, to the visual or auditory domain.
 There are some well-known relations between structure and odor perception. In or-
 der to be perceived as odorous at all, a molecule must be volatile enough to evaporate and
 have specific solubility characteristics to pass through the (hydrophilic) nasal mucosa and

 © 2021 by the author(s). Distributed under a Creative Commons CC BY license.
Preprints (www.preprints.org) | NOT PEER-REVIEWED | Posted: 31 March 2021

 bind to the (hydrophobic) olfactory receptors in the olfactory epithelium [4]. In addition,
 some functional groups are known to determine characteristics of odor quality. For exam-
 ple, esters typically have a sweet or fruity odor and aldehydes are associated with the
 scent of grass or leaves [3]. The physical and chemical properties of odors presumably also
 influence the perceived intensity and concentration threshold at which an individual can
 detect them. Intensity is positively associated with vapor pressure, i.e. how many mole-
 cules are released into the air to reach olfactory receptors, and negatively relates to water
 solubility (hydrophilicity) [5]. Interestingly, the ability to judge odor intensity remains in-
 tact in humans with brain lesions, who are incapable of characterizing odorant qualities
 [6, 7]. This suggests that intensity encoding may function independently of odor discrim-
 ination. In addition, odor molecules with a high molecular weight were found to have
 higher rates of specific anosmia, not being able to smell a specific odor, than lighter mol-
 ecules [8].
 Probably the most extensively investigated perceptual dimension of olfaction is its
 hedonic valence, or pleasantness. Pleasantness has a special role in olfactory perception.
 Unlike vision, where this dimension plays a rather subordinate role, naïve subjects tend
 to respond to hedonic properties of odors before thinking about their quality or intensity
 [9]. Pleasantness was repeatedly found to be positively associated with molecular weight,
 size or complexity [5, 10-12] and was highlighted as one of the most important dimensions
 of odor description [10, 13-15].
 However, direct relationships between specific physical or chemical characteristics
 with odor perception are rare, and structurally similar odor molecules in some cases lead
 to very different olfactory perceptions [3]. In addition, the understanding is complicated
 by many other processes in the pathway of olfaction. For example, influences due to chem-
 ical reactions during transport through the nasal mucosa or the interaction of odors in
 odor mixtures [3, 4, 16, 17]. Thus, olfactory perception remains a "black box" in many re-
 spects. Ways to bridge this problem emerged with the advance of complex computational
 algorithms and modeling approaches.
 As a first step, many studies have attempted to characterize a "physicochemical odor
 space" [4, 5, 10, 18]. For this purpose, a large number (typically thousands or tens of thou-
 sands) of chemical and physical molecular properties, so-called descriptors, are calculated
 using special software or online databases. To deal with the resulting high-dimensional
 property space, the most important dimensions are usually obtained using statistical de-
 composition methods such as principal component analysis [e.g. 10, 19]. The resulting
 physicochemical odor space can then be used to study odor similarity [19, 20], qualitative
 or hedonic properties of odors [5, 10, 18]. For example, Khan et al. [10] were able to put
 novel molecules into the correct ranking of pleasantness according to their variance in the
 first component of the physicochemical odor space. This way, odorant pleasantness could
 be predicted with r ~ .50 across three cultures [10]. Using sophisticated prediction algo-
 rithms, such machine or deep learning approaches, increasingly high prediction accura-
 cies can be achieved without having to capture the complexity of all underlying interac-
 tions involved [21, 22]. Keller, Gerkin [18] even launched a crowd-sourced competition to
 obtain high prediction accuracies for their dataset with 49 study participants who rated
 perceptual dimensions of 476 odor molecules.
 One striking caveat of most of these experiments is, however, that the perceptual
 dimensions are obtained using ratings by olfaction experts, such as perfumers, wine tast-
 ers etc. (e.g., see [9, 23-26]). This procedure has benefits in a presumed higher objectivity
 and less interindividual variation in odor evaluation of the raters. Especially, when aim-
 ing to unveil the rules of odor sensation at the molecular level, small deviations in the rat-
 ings of the same odor are undoubtedly favorable.
 Many studies, on the other hand, are not aiming at a detailed understanding of pro-
 cesses on an atomic level, but focus on perceptual aspects of olfaction, i.e., finding reliable
 predictions of whether an odor is pleasant, familiar, intense, ... etc. In this context, one
 must ask to what extent expert ratings can be generalized to the population as a whole.
 Measures of olfactory perception, such as hedonic valence, vary between individuals –
Preprints (www.preprints.org) | NOT PEER-REVIEWED | Posted: 31 March 2021

 amongst others - due to influences of context and experience [27-32]. Consequently, they
 cannot be completely determined by structural composition alone. The question therefore
 arises as to how valid expert evaluations are when examining perception. As an analogy
 in the visual domain, one could compare this to asking art experts to judge the beauty of
 visual impressions. Although this might lead to more similar ratings than in a normal
 population sample, it can be asked, if these are representative results. To date, there is a
 lack of studies that systematically address the relation between physicochemical structure
 and olfactory perception of “naïve” subjects. One of the few existing studies is the previ‐
 ously mentioned study by Keller et al. [5, 18], who investigated an impressively wide
 range of chemically different odor molecules but on only 56 individuals.
 The purpose of this study is to investigate the extent to which previous findings
 about the relationship between odor structure and perception hold true in a sample of
 non-expert raters. To this end, we study the role of physicochemical properties for the
 detection threshold as well as for perceived pleasantness, intensity and quality of odors in a
 large naïve sample. We further examine the distribution and variance of the perceptual
 ratings to identify evidence of interindividual differences in olfactory perception. For that
 purpose, we reanalyze a dataset of 2,000 subjects that rated 20 odors in a study by Croy et
 al. [8] and critically examine how perceptual ratings interact and vary between individu-
 als. The findings intend to broaden the understanding of olfactory perception in relation
 to the physicochemical odor space and point out perspectives and challenges in the field.

 2. Materials and Methods
 In order to investigate the relationship between odor properties and their corre-
 sponding perceptual impression in a large non-expert sample, we performed three main
 steps. At first, we followed previous approaches and developed our own physicochemical
 odor space as introduced in Khan, Luk [10] (see section 2.1). As a second step, we retrieved
 perceptual ratings [8] and investigated the distribution and differences in the ratings for
 20 different odors (see 2.2 & 2.3). Thirdly, we correlated the results from the odor space
 with the perceptual ratings from our dataset. The procedure is visualized in a schematic
 overview in Figure 1.

 2.1. Development of a Physicochemical Odor Space
 2.1.1. Descriptor Calculation and Preprocessing
 For the development of a physicochemical property space of odors we calculated
 physical and chemical descriptors for 1,389 odors typically used in experiments and in-
 dustry from a list provided by Khan et al. (2007). For those odors, we first identified the
 corresponding molecule from its registry number or name using webchem package [33] in
 RStudio© (version 1.2.5033, R version 3.6.2). Afterwards, we used the Online chemical da-
 tabase [OCHEM, https://ochem.eu/; 34] to calculate a total of 21,609 physical and chemical
 descriptors. For preprocessing, we removed all descriptors containing infinite or missing
 values for one or more of the molecules as well as descriptors with zero values for more
 than 80% of the molecules. Furthermore, to improve the quality of the principal compo-
 nent analysis, we dropped all descriptors without noteworthy correlations (no correlation
 of > |0.3| with any other descriptor). This resulted in the final odor space with 4,094
 descriptors for each of the 1,389 molecules. A more detailed report on the descriptor cal-
 culation and a list of all odors used can be found in the supplementary material. All cor-
 responding R and Python code and datasets for the analyses in this publication are avail-
 able via https://osf.io/e67dn/.
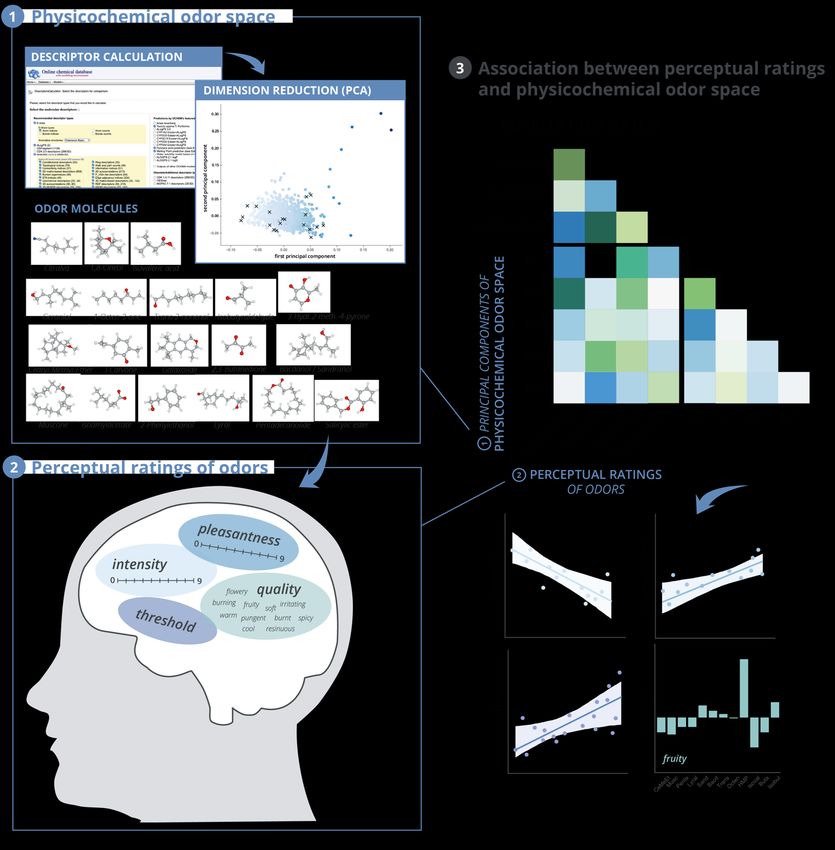
Preprints (www.preprints.org) | NOT PEER-REVIEWED | Posted: 31 March 2021

 Figure 1. Overview of Methodology and Analyses. 1 Development of a physicochemical odor space. For 1,389
 odor molecules, including 20 molecules for which we obtained perceptual ratings (see 3D molecule structure
 images and 2), molecular descriptors were calculated using the Online chemical database (https://ochem.eu/).
 After preprocessing of the dataset, dimension reduction was performed by the means of principal component
 analysis. The resulting components were used for further analyses (see 3). 2 Perceptual ratings of odors. For 20
 of the 1,389 odor molecules perceptual ratings were obtained from a dataset with n = 2,000 subjects that were
 tested with one or more odors in groups of n ~ 200 (Croy et al., 2015, see Table 2). The detection threshold and
 ratings of intensity, pleasantness and qualitative dimension were investigated for differences between the
 odors. 3 Association between perception and odor space. Finally, the values of the first principal components of
 the odor space for each odor were correlated with their corresponding perceptual dimensions of pleasantness,
 intensity and detection threshold. For the qualitative ratings, individual plots were generated showing the fre-
 quency of naming a specific qualitative descriptor for each odor molecule. Note: Plots show schematic visualiza-
 tions.

 2.1.2. Dimension Reduction
 To get rid of redundancies in the variables and reduce the dimensionality of the odor
 space, principal component analysis (PCA) was performed. PCA is a common method to
 reduce the dimensionality of large and complex datasets with high redundancies between
 variables. To achieve this, all data points are projected to new coordinates in a way that
Preprints (www.preprints.org) | NOT PEER-REVIEWED | Posted: 31 March 2021

 each dimension (= principal component) successively explains the largest amount of var-
 iance in the data and all resulting dimensions are orthogonal (i.e. uncorrelated) to each
 other. Usually, PCA requires more observations than variables in the dataset to yield ro-
 bust estimates, which is not the case here since we have 4,094 variables but only 1,389
 observations. A typical approach in cheminformatics, where this is a common problem, is
 the usage of the non-linear iterative partial least squares (NIPALS) algorithm [35]. The
 NIPALS method is based on finding linear combinations for each factor in an iterative
 way, starting with a randomly chosen starting vector. The procedure generates more pre-
 cise results than the normally used singular value decomposition, but may also be slower
 if a large amount of components is calculated [35]. We performed PCA using the NIPALS
 algorithm on the 4,094 molecular descriptors using statsmodels package as implemented
 in Python 3.7 [36]. The statsmodels PCA function first normalizes the data and then per-
 forms PCA on the desired number of components, ranging from one component to the
 number of variables in the dataset. To establish a reasonable calculation time, we chose to
 calculate 100 principal components. As a result, a matrix of factor scores was generated,
 that reflects the position of each odor molecule in the odor space and the corresponding
 factor loadings refer to the importance of each original descriptor for the principal com-
 ponents. In a last step, the factor scores for each odor molecule were stored in a data frame
 to be used for further analyses of associations between odor space and perceptual ratings
 (see 2.2).

 2.2. Materials and Measures
 For the analysis of perceptual ratings of odors, a dataset from Croy et al. [8] with a
 total of 2,000 participants was used. There, each participant had been tested for odor de-
 tection threshold for one to seven out of twenty odorants (see Table 1 and Table 2) in nine
 dilution steps from 0 = 1:100 to 9 = 1:109. Based on the results for the individual detection
 thresholds, the rate of specific anosmia was calculated, i.e. the percentage of participants
 not being able to smell the odor as operationalized by the deviation from mean detection
 threshold. CAS number, trivial name and an abbreviate code for better readability in suc-
 cessive graphs for each molecule are provided in Table 1. For thirteen of the odors, partic-
 ipants had been asked to rate their individual perceptions of the highest odor concentra-
 tion with respect to intensity, pleasantness and for twelve odors for a qualitative impres-
 sion. Pleasantness and intensity had been rated using a scale from 0 through 9 (intensity:
 0 = not perceived, 9 = extremely intense; pleasantness: 0 = extremely unpleasant, 9 = ex-
 tremely pleasant). Qualitative ratings had been collected by asking the participants to
 choose two out of twelve verbal descriptors that, in their opinion, described the odorant
 best. For further details on the procedures see Croy et al. [8].

 2.3. Statistical Methods
 All analyses were carried out in Jupyter notebook (see https://osf.io/e67dn/) using
 different packages in Python 3.7, including Pandas, NumPy, Matplotlib, SciPy, statsmodel
 and Pingouin. In order to detect significant differences between perceptual ratings for dif-
 ferent odors, robust Welch one-way analyses of variance (ANOVA) were performed for
 the factors pleasantness, intensity and detection threshold and Games-Howell post-hoc
 comparisons were calculated. The ANOVAs and post-hoc tests were conducted using the
 Pingouin package (version 0.3.9) as implemented in Python 3.7 [37]. For the investigation
 of interindividual differences in the distributions of pleasantness and intensity ratings, the
 mean, median and standard deviations were calculated and the results visualized in his-
 tograms and boxplots. In addition, Pearson correlation coefficients were calculated for as-
 sociations between the mean and standard deviations for the perceptual ratings. For the
 qualitative ratings, the percentage of naming the different verbal descriptors were calcu-
 lated and visualized. Associations of the qualitative descriptions with mean intensity and
 pleasantness ratings were analyzed in an explorative fashion. Finally, Pearson correlation
 coefficients were calculated to investigate associations between the first five principal
Preprints (www.preprints.org) | NOT PEER-REVIEWED | Posted: 31 March 2021

 components of the odor space (see section 2.1) with the perceptual ratings. For those cor-
 relations, the rate of specific anosmia was added to compare the results to the previous
 findings in Croy, Olgun [8]. The graphs and visualizations of the results were built using
 the packages matplotlib and seaborn (Python 3.7.) in Jupyter notebook and were further
 processed in Adobe Illustrator 2021.

 Table 1. Overview of Odors. Listed are CAS registry number, trivial name and abbreviation used
 in plots and graphs.

 CAS number Trivial name Abbreviation
 1 204-262-9 Salicylic ester Salicyl
 2 99-49-0 l-Carvon Carvon
 3 431-03-8 2,3-Butadione Buta
 4 31906-04-4 Lyral Lyral
 5 5146-66-7 Citralva Citra
 6 106-24-1 Geraniol Gera
 7 78-84-2 Isobutyraldehyde Isobut
 8 503-74-2 Isovaleric acid Isoval
 9 628-46-6 Isoamylacetate Isoamy
 10 118-71-8 3-Hydroxy-2-methyl-4-pyrone HMP
 11 470-82-6 1,8-Cineol Cineol
 12 956-82-1 Muscone Musc
 13 6602-64-8 Galaxolide Gala
 14 28219-61-61 Sandranol Sand
 15 28219-61-61 Bacdanol Bacd
 16 18829-56-6 Trans-2-nonenal Trans
 17 19870-74-7 Cedrylmethylether CeMeEt
 18 106-02-5 Pentadecanolide Penta
 19 60-12-8 Phenylethylalcohol PEA
 20 3391-86-4 1-Octen-3-one Octen
 1Note: Sandranol and Bacdanol are listed with the same CAS registry number and therefore corre-
 spond with the same structural descriptors in further analyses.

 Table 2. Overview over Subject Groupings, Odorants and Perceptual Ratings obtained

 Subjects Odorants used for testing Perceptual Ratings
 thr int pl qual
 1 - 200 Isoval Trans - - - - - X X X X
 201 - 400 HMP Penta CeMeEt - - - - X X X X
 401 - 600 Sand Bacd Buta - - - - X X X X
 601 - 800 Lyral Musc - - - - - X X X X
 801 - 1000 Gera - - - - - - X X X
 1001 - 1200 PEA Gera Cineol - - - - X
 1201 - 1400 Carvon Isoamy Salicyl - - - - X
 1401 - 1600 Citra Gala - - - - - X
 1601 - 1800 Isobut Octen - - - - - X X X X
 1801 - 2000 PEA Citra Cineol Isoamy Salicyl Gala Carvon X
 Abbreviations: thr = threshold, int = intensity, pl = pleasantness, qual = quality

 3. Results
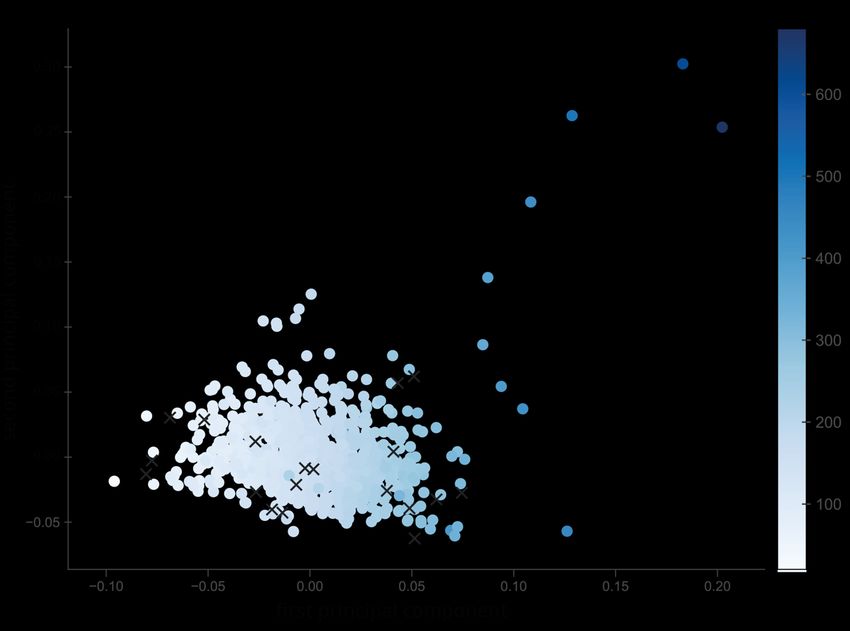
Preprints (www.preprints.org) | NOT PEER-REVIEWED | Posted: 31 March 2021

 3.1. Physicochemical Odor Space
 3.1.1. Factor Scores and Loadings
 For dimension reduction, we calculated 100 principal components from the 4,116
 original molecular descriptors (see Figure 2). Although a systematic analysis of the factor
 loadings is challenging due to the large number of descriptors, some associations and
 trends were explored, especially to check if previous results can be replicated. Similar to
 previous studies (e.g., see [4, 5, 10]), the first component showed a clear association with
 molecular weight (as shown by the shade of blue in Figure 2) and complexity (high loadings
 of graph vertex complexity index and graph distance complexity index; both descriptors from
 alvaDesc). Further exploration showed, that the second principal component shows high
 loadings of descriptors related to descriptors with some relation to polarity or negativity,
 such as the eta average electronegativity measure, mean atomic Sanderson electronegativity or
 topological surface area (alvaDesc descriptors). The third principal component may be re-
 lated to topological characteristics, e.g. there is a high factor loading of the ring complexity
 index and distance or spanning indices from detour or Laplace matrix.

 Figure 2. Physicochemical Odor Space. The graph shows the values for the first two principal com-
 ponents as obtained from dimension reduction of the physicochemical molecule properties for
 1,389 odor molecules. The 20 odor molecules used in the further analyses are highlighted as ‘x’.
 The shade of blue indicates the molecular weight of the molecule (g/mol).

 3.1.2. Explained Variance
 80% of the variance in the physicochemical descriptors could be explained by the first
 ten principal components. 90% were reached when 25 components are included. The first
 principal component already accounted for around 36% of the total variance, together
 with the second principal component, almost 50% of the variance could be explained.

 3.2. Perceptual Ratings of Odors
 In total, the dataset [8] contains perceptual ratings for n=2,000 subjects. All subjects
 had been tested for detection threshold; a subset of participants additionally rated the
 perceived pleasantness and intensity (n=1,176) as well as the qualitative dimension of the
Preprints (www.preprints.org) | NOT PEER-REVIEWED | Posted: 31 March 2021

 odors (n=976). The odors were presented in groups of 178 to 200 subjects (see Tables 2 &
 3). The mean rating of pleasantness ranged from the lowest pleasantness of mean = 2.25
 for Isovaleric acid (std = 1.66) and the highest ratings for Lyral (mean = 5.59, std = 1.65)
 and Muscone (mean = 5.58, std = 1.69). The molecule with the highest rating of intensity
 (mean = 6.26, std = 1.69) was 1-Octen-3-one, followed closely by Trans-2-Nonenal (mean =
 6.22, std = 1.70); the lowest ratings were given for Bacdanol (mean = 3.13, std =1.76) and
 Sandranol (mean = 3.18, std = 1.61). The detection threshold was tested in groups of 276 to
 376 participants. The mean detection threshold ranged from 4.19 for Geraniol (std = 1.70),
 which is equivalent to a dilution of 1:104 and 7.29 for Isobutyraldehyde (dilution of 1:10 7;
 std = 1.04).

 Table 3. Descriptive Statistics for Detection Threshold and Pleasantness and Intensity Ratings

 Pleasantness Intensity Detection threshold
 N mean median std mean median std N mean median std
 Bacd 200 4.76 5 1.88 3.13 3 1.76 300 5.50 6 1.53
 Sand 200 4.61 5 1.88 3.18 3 1.61 300 5.35 6 1.43
 Musc 200 5.58 6 1.69 3.31 3 1.79 300 5.33 6 1.77
 Lyral 200 5.59 6 1.65 3.44 3 1.86 300 5.44 6 1.64
 Penta 200 4.67 4 1.87 4.42 4 1.89 300 6.19 7 1.18
 HMP 200 5.55 6 1.88 4.58 5 1.88 300 5.88 6 1.30
 Isoval 178 2.25 2 1.66 6.07 6 1.86 300 5.02 5 1.20
 Buta 200 2.75 2 1.87 6.03 6 1.89 300 6.78 7 0.55
 Octen 200 3.16 3 1.85 6.26 6 1.69 300 6.82 7 1.13
 Isobut 200 3.57 3 1.97 6.04 6 1.72 300 7.29 7 1.04
 Trans 178 3.69 4 2.07 6.22 6 1.70 300 5.32 5 1.26
 CeMeEt 200 3.93 4 1.79 5.45 6 1.94 300 6.28 7 0.93
 Gera 198 5.49 6 1.75 5.78 6 1.51 376 4.19 4 1.70
 Cineol - - - - - - - 300 5.20 5 1.64
 PEA - - - - - - - 300 3.94 4 1.55
 Carvon - - - - - - - 300 5.17 5 1.37
 Isoamy - - - - - - - 300 4.76 5 1.40
 Salicyl - - - - - - - 300 4.77 5 1.74
 Citra - - - - - - - 300 6.22 7 1.14
 Gala - - - - - - - 300 5.40 6 1.50

 3.2.1. Pleasantness Ratings
 A robust one-way Welch ANOVA showed significant differences of pleasantness rat-
 ings for the odor molecules in the dataset (F(12,983.25)=80.69; p Cedrylmethylether) to d = 2.02 (Lyral >
 Isovaleric acid). No significant differences were found within the group of odors with the
 highest ratings of pleasantness (median = 6): Lyral (5.59), Muscone (5.58), 3-Hydroxy-2-
 Methyl-4-pyrone (5.5) and Geraniol (5.49). Similarly, no differences were found between
 three of the four most unpleasant odors (median = [2; 3]) Isobutyraldehyde (3.57), 1-Octen-
 3-one (3.16) and 2,3-Butadione (2.75). Similarly, no significant differences were found for
 odors in the low to medium range (median = [4; 5]), and some odors neighboring the high
 or low pleasantness group did not differ significantly (see Supplementary Table 4).
Preprints (www.preprints.org) | NOT PEER-REVIEWED | Posted: 31 March 2021

 Figure 3. Pleasantness Ratings. The figure shows boxplots for pleasantness ratings (from 0 = extremely un-
 pleasant to 9 = extremely pleasant) of different odor molecules.

 3.2.2. Intensity Ratings
 A robust one-way Welch ANOVA showed significant differences of intensity ratings
 for the odor molecules in the dataset (F(12,983.40)=106.14; p Cedrylmethylether) to d = 1.86 (1-Octen-3-one > Sandranol). Similar
 to the pleasantness ratings, groups of high and low intensity odors without significant
 differences can be found: The highest intensity ratings (median = 6) were given for Ce-
 drylmethylether (5.45), Geraniol (5.78), 2,3-Butadione (6.03), Isobutyraldehyde (6.04), Iso-
 valeric acid (6.07), Trans-2-Nonenal (6.22) and 1-Octen-3-one (6.26). For the low intensity
 odors (median = 3), Bacdanol (3.13), Sandranol (3.18), Muscone (3.31) and Lyral (3.44)
 showed no significant difference of intensity rating.

 Figure 4. Intensity Ratings. The figure shows boxplots for intensity ratings (from 0 = not perceived to 9 = ex-
 tremely intense) of different odor molecules.

 3.2.3. Detection Threshold
 A robust one-way Welch ANOVA showed significant differences of detection thresh-
 old for the odor molecules in the dataset (F(20,2096.42)=164.55; p Isoamylacetate) and d = 2.54 (Isobutyraldehyde > Phenyl ethyl alcohol). In analogy
 to pleasantness and intensity, some homogenous groups with similar detection thresholds
 can be found, e.g., Bacdanol (5.5), Sandranol (5.35), Muscone (5.33) and Lyral (5.44) again
 form a group with similar values, alongside with 3-Hydroxy-2-Methyl-4-pyrone (5.88),
 Trans-2-Nonenal (5.32), Geraniol (5.08), Galaxolide (5.40), Isovaleric acid (5.02), 1,8-Cineol
 (5.20) and l-Carvon (5.17). For all comparisons see Supplementary Table 4.
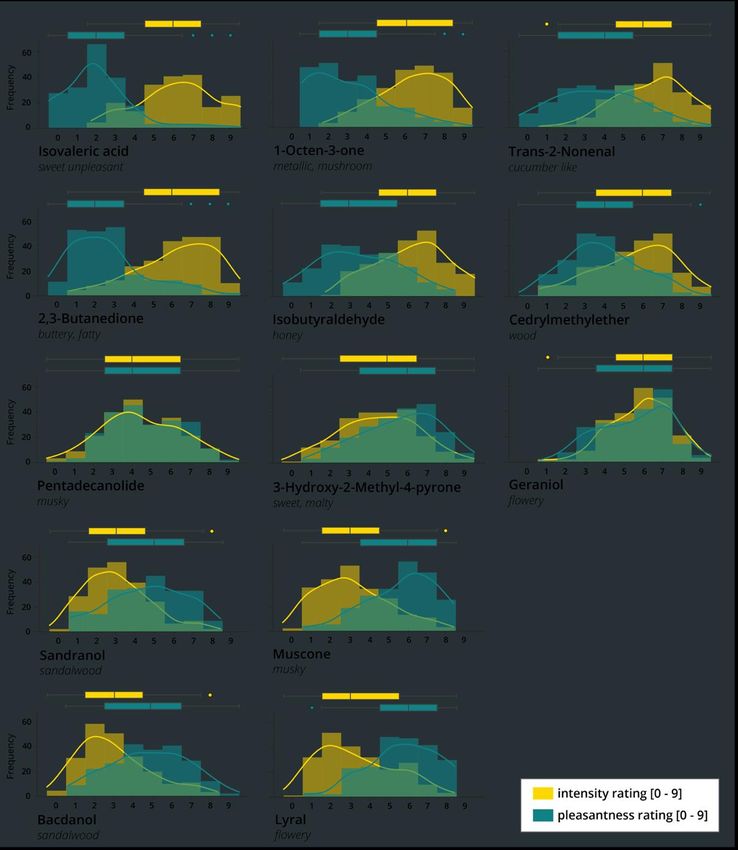
Preprints (www.preprints.org) | NOT PEER-REVIEWED | Posted: 31 March 2021

 Figure 5. Detection Threshold. The figure shows boxplots for detection thresholds (dilutions from 0 = 1:10 0 to
 9 = 1:109) of different odor molecules.

 3.2.4. Distribution of Pleasantness and Intensity Ratings.
 Although large differences between perceptual ratings of pleasantness and intensity
 were found on the group level, a closer look at the distribution of the values reveals inter-
 individual differences between participants’ ratings (see Figure 6 and Tables 4 & 5). For
 example, one of the most pleasant odors, 3-Hydroxy-2-methyl-4-pyrone shows a flat peak
 and broad distribution. While the median value of 6 is above the mean of the scale (4.5)
 for pleasantness, still 25% of the values fall in the range between 1 and 3, which cor-
 responds to a quite unpleasant rating, and another 25% to the range of 4-6, i.e. neutral to
 moderately pleasant. A similarly broad distribution with an IQR spanning at least 4 val-
 ues, can also be seen for most of the low to medium pleasant odors: Trans-2-Nonenal,
 Isobutyraldehyde, Pentadecanolide, Sandranol and Bacdanol. For those odors, the values
 spread almost symmetrically around the median value 4 or 5. E.g., for Trans-2-Nonenal,
 the density curve of pleasantness ratings is very flat, with 50% of the values falling in the
 range of 0-4, the other 50% in the range of 4-9. Interestingly, the intensity ratings for those
 odors generally show a narrower distribution and higher peaks, except for Pentadecan-
 olide, which shows an almost identical (and equally broad) curve to the pleasantness rat-
 ings. In comparison, the steepest curves for pleasantness can be found for the two most
 unpleasant odors Isovaleric acid and 2,3-Butadione and for the three most pleasant odors
 Geraniol, Lyral and Muscone.

 Table 4. Interquartile Ranges for Pleasantness Ratings

 Bacd Sand Musc Lyral Penta HMP Isoval Buta Octen Isobut Trans CeMeEt Gera
 +/-1.5 IQR [1,9] [1,8] [1,8] [2,8] [0,9] [1,9] [0,6] [0,6] [1,7] [0,8] [0,9] [0,8] [1,9]
 IQR 3-6 3-6 4-7 5-7 3-6 4-7 1-3 1-3 2-4 2-5 2-5 3-5 4-7
 median 5 5 6 6 4 6 2 2 3 3 4 4 6

 Table 5. Interquartile Ranges for Intensity Ratings

 Bacd Sand Musc Lyral Penta HMP Isoval Buta Octen Isobut Trans CeMeEt Gera
 +/-1.5 IQR [0,7] [0,7] [0,7] [0,8] [0,9] [0,9] [2,9] [1,9] [2,9] [2,9] [2,9] [1,9] [2,9]
 IQR 2-4 2-4 2-4 2-5 3-6 3-6 5-7 5-8 5-8 5-7 5-7 4-7 5-7
 median 3 3 3 3 4 5 6 6 6 6 6 6 6
Preprints (www.preprints.org) | NOT PEER-REVIEWED | Posted: 31 March 2021

 Figure 6. Distribution of Pleasantness and Intensity Ratings. The histogram plots illustrate the frequency (= to-
 tal number of ratings) for perceptual ratings of pleasantness and intensity for each odor. The plots are ar-
 ranged in subgroups according to low, medium and high values in pleasantness (ranging from 0 = extremely
 unpleasant to 9 = extremely pleasant) and intensity (ranging from 0 = not perceived to 9 = extremely intense).
 In order to give an idea of the qualitative impression of the odors, a semantic description is added for each.

 3.2.5. Interaction of Pleasantness and Intensity Ratings
 Noticeable in the visual inspection of the graphs is that there seems to be a negative
 association between pleasantness and intensity ratings (correlation coefficients are dis-
 cussed in the next paragraph). For the six low to medium pleasant odors Isovaleric acid,
 1-Octen-3-one, Trans-2-Nonenal, 2,3-Butadione, Isobutyraldehyde and Cedryl-
 methylether (first two rows in Figure 6), a low or medium pleasantness is accompanied by
 a high intensity rating. For Sandranol, Bacdanol, Muscone and Lyral a medium to high
 pleasantness is complemented by a low intensity rating. As mentioned above, for Penta-
 decanolide, that has a medium or neutral pleasantness on average, the curves for pleas-
 antness and intensity overlap almost completely. Somewhat inconsistently, two of the
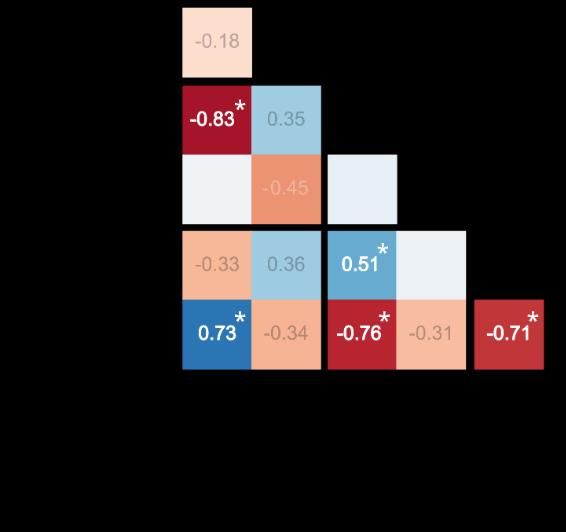
Preprints (www.preprints.org) | NOT PEER-REVIEWED | Posted: 31 March 2021

 pleasant odors, 3-Hydroxy-2-Methyl-4-pyrone and Geraniol, show higher ratings for
 pleasantness, but also for intensity.

 3.2.6. Correlations among Perceptual Ratings
 Pearson correlation coefficients show relations between the perceptual ratings of
 pleasantness, intensity and detection threshold (see Figure 7). The strong negative associ-
 ation (r = -0.83) that can be seen between the mean pleasantness and mean intensity ratings
 substantiates the observation from the distribution plots. Additionally, the mean intensity
 was positively related to the mean detection threshold (r=0.51), i.e. the odors were rated
 as more intense if they were more easily detected (at a higher threshold). Interestingly,
 the standard deviation of the detection threshold also showed a positive correlation with
 the mean pleasantness (r=0.73) and a negative correlation with the mean intensity (r=-0.76)
 and the mean detection threshold (r=-0.71). Or put differently: If there is a high variation
 in the detection threshold, odors are harder to detect (=lower value for detection thresh-
 old, i.e., a lower dilution is needed for detection) and they are rated as more pleasant and
 less intense.

 Figure 7. Correlation Matrix of Perceptual Rat-
 ings. Pearson correlation coefficients for associa-
 tions between pleasantness (n=13 odor mole-
 cules), intensity (n=13) and detection threshold
 (n=20). Highlighted in bold and with asterisk are
 significant correlations to the level of p
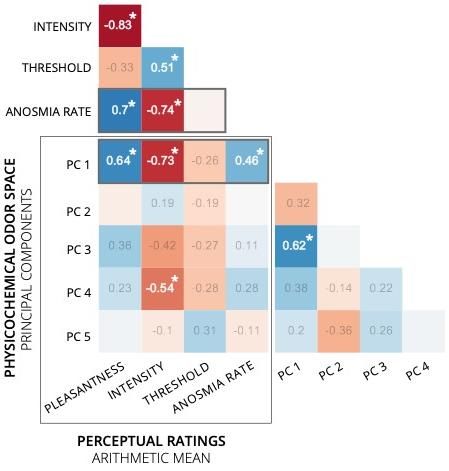
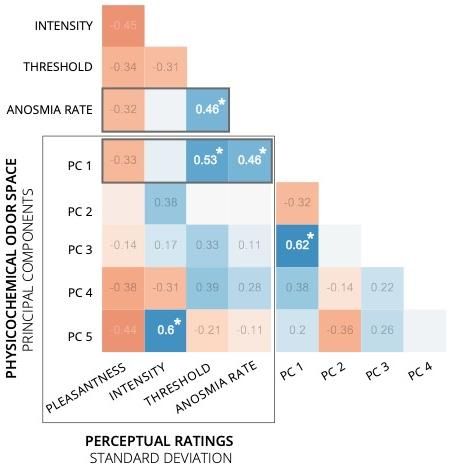
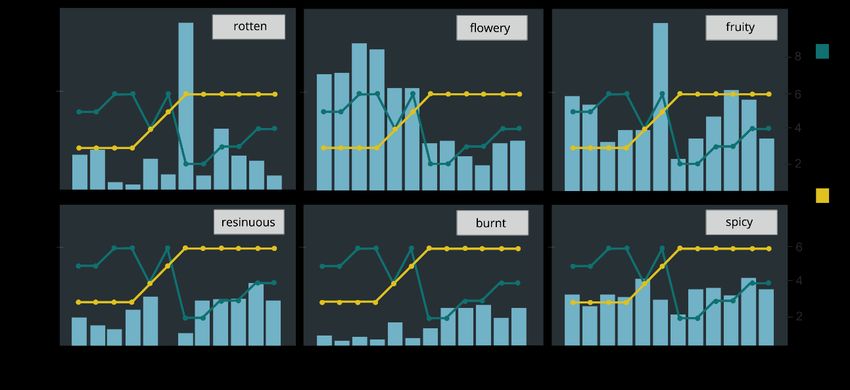
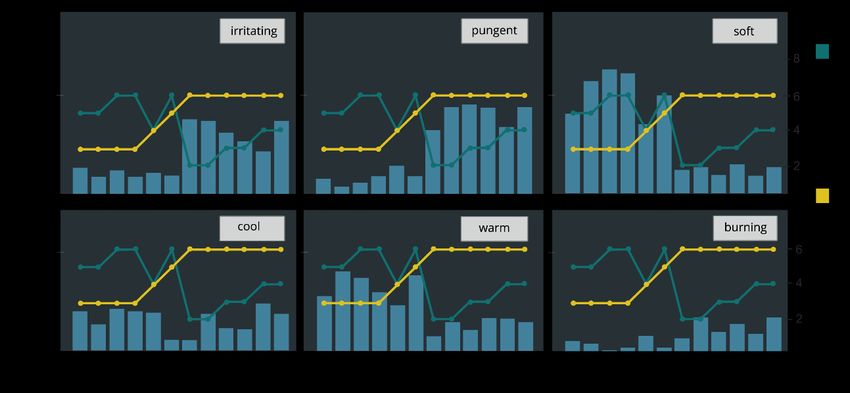
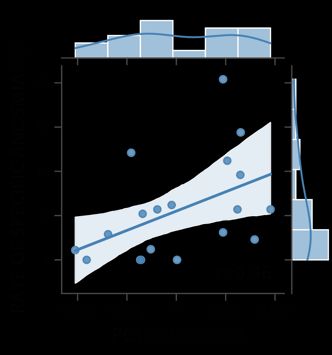
Preprints (www.preprints.org) | NOT PEER-REVIEWED | Posted: 31 March 2021

 a

 b
 Figure 8. Qualitative Ratings. The figure shows the frequency (in %) of naming qualitative descriptors for
 each odor. The participants were asked to name the two descriptors that, in their opinion, fit best to each
 odor from a list of 12 qualitative descriptions (rotten, flowery, fruity, resinous, burnt, spicy, irritating, pun-
 gent, soft, cool, warm, burning; for details see Croy et al., 2015). Each subplot represents one of the qualita-
 tive descriptors, split into olfactory (a) and trigeminal (b) odor descriptions. To facility the discovery of as-
 sociations between pleasantness, intensity and qualitative ratings, the median values for pleasantness and
 intensity are drawn as yellow and green lines in the plots.

 3.3 Associations between Perceptual Ratings and Physicochemical Odor Space
 As a last step in our analysis, we calculated Pearson correlation coefficients for the
 association between the first five principal components from the odor space and the per-
 ceptual ratings of pleasantness, intensity, detection threshold and rate of specific anosmia
 (see Figures 9 and 10). For the first principal component (PC) of the odor space, a positive
 association was found for the mean pleasantness (r = 0.64) and a negative association with
 mean intensity (r=-0.73). Therefore, the variation in PC1 accounts for some variation in
 those variables – although the results must be taken with care due to the very small num-
 ber of odor molecules in the correlation calculation (13 odors for pleasantness and inten-
 sity ratings). The mean detection threshold showed no correlation with PC1. However, a
 positive association was found with the standard deviation of detection threshold (r=0.53)
 and with the rate of specific anosmia (r=0.46). Interestingly, the rate of specific anosmia
 shows the same correlation “pattern” as PC1 with the means and standard deviations of
 the perceptual ratings (compare third and fourth row from top in both correlation matri-
 ces). For example, the rate of specific anosmia correlates positively (r = 0.7) with mean
 pleasantness and negatively with mean intensity ratings (r = -0.73). Further associations
Preprints (www.preprints.org) | NOT PEER-REVIEWED | Posted: 31 March 2021

 were found between PC4 and the mean intensity (r=-0.54) and between PC5 and the stand-
 ard deviation of intensity (r=0.60). Additionally, PC1 and PC3 showed a correlation of r =
 0.62.

 a b
 Figure 9. Correlation Matrices. Pearson correlation coefficients for associations between principal components (PC1
 to PC5) from physicochemical odor space and arithmetic mean (a) and standard deviation (b) of perceptual ratings
 for pleasantness (n = 13 odor molecules), intensity (n=13) and detection threshold (n = 20). Highlighted in bold and
 with asterisk are significant correlations to the level of p
Preprints (www.preprints.org) | NOT PEER-REVIEWED | Posted: 31 March 2021

 space, the highest loadings were found for descriptors that are related to negativity or
 polarity, indicating a dimension that differentiates more the “chemical behavior” than
 topological characteristics. Some relation to length or ring complexity was found for the
 third principal component in our odor space.
 Although these findings help to explore the dimensions of olfaction, they can only
 take us so far. The more descriptors are included in the calculation, the more difficult it
 becomes to interpret the contribution of each descriptor to the different dimensions. In
 our odor space, the 200 descriptors with the highest loadings for PC1 all showed very
 similar values (less than +/- 2.5% from mean). This makes any interpretation of content
 challenging and our conclusions about tentative labels for the dimensions may have to be
 revised if all high factor loadings are taken into account. New hypotheses and further
 analyses are needed to find the common content of these descriptors. Still, the odor space
 is a helpful tool to relate the dimension of physicochemical properties with the perceptual
 dimensions of olfaction.
 With regard to the perceptual ratings, our dataset of 2,000 naïve subjects showed
 significant differences in perceived pleasantness and intensity on the group level with a
 high association between both perceptual dimensions. Odors with a low intensity showed
 higher pleasantness ratings, while a high intensity was perceived for unpleasant odors.
 Although moderate to high effect sizes could be seen for the differences in pleasantness
 and intensity ratings between the odors, these need to be treated more conservatively as
 each group of participants rated several (but not all) odors. Therefore, similarities in rating
 patterns may have occurred within the groups and between group differences may be
 over-interpreted. For example, the musky odor Muscone and the flowery odor Lyral were
 presented to the same participants and showed similar ratings in pleasantness and inten-
 sity. The same may hold true for the two sandalwood odors Sandranol and Bacdanol,
 although similar ratings also seem plausible as both are sandalwood odors.
 The data for this study was originally collected in the context of investigating the
 prevalence of specific anosmia and its role as a peripheral adaptive filtering mechanism
 [8]. There, it has already been shown that odors with a higher molecular weight showed
 higher rates of specific anosmia. In this study, we found that the extent of interindividual
 difference (standard deviation) in detection threshold, is related to the first principal com-
 ponent of the odor space. This shows that the first PC of the physicochemical odor space
 is not indicative of the absolute value of the concentration threshold for detection, but of
 the percentage of participants who deviated from this value, i.e., among others, those who
 were anosmic for this specific odor. Interestingly, there were striking differences for the
 rates of specific anosmia for the two sandalwood odors, Bacdanol (20.4%) and Sandranol
 (3.1%), which have the same CAS registry number and are sometimes treated as syno-
 nyms in databases such as PubChem. In practice, substances with the same CAS number
 can have different distributions of isomers that can lead to different and distinguishable
 olfactory percepts [39]. In our example, Sandranol shows a different distribution of enan-
 tiomers (i.e., a form of isomer that is an exact mirror of the same chemical compound, but
 cannot be brought into congruence) in the odor solution depending on the synthesis
 method and odor concentration1. This makes Sandranol the “stronger” odor compared to
 Bacdanol. However, since our calculation of the physicochemical descriptors does not dis-
 tinguish between isomers, we cannot account for the perception difference in the two
 odors. In summary, the typically unknown composition of odors in a solution provides
 another source of uncertainty which contributes to variance in the perceptual ratings.
 Further insight on why certain odors may have been rated similarly or differently
 were found in the qualitative descriptions. Explorative analyses showed relations be-
 tween odor quality and the perceived pleasantness, e.g. positive descriptions such as
 "flowery" were given more often for those odors that were rated as pleasant and negative
 descriptions (e.g. "rotten") were more likely associated with unpleasant odors. Similarly,
 intensity ratings were also influenced by the trigeminal nature of an odor. Those odors

 1 private communication
Preprints (www.preprints.org) | NOT PEER-REVIEWED | Posted: 31 March 2021

 that were perceived as “pungent” or “irritating” were also rated as more intense than
 other odors. However, each qualitative descriptor was named for each odor, sometimes
 rather evenly distributed and the overall picture remains unclear. This may partly be at-
 tributed to the study design, as each participant had to choose two out of twelve qualita-
 tive descriptors that fit best, but not necessarily ruling out that more than those two de-
 scriptors fit to the odor. This way, it is possible that an odor that is perceived as irritating
 and pungent, could not (additionally) be rated as flowery if this seemed the less relevant
 dimension.
 While we were able to find significant differences on the group level, there were also
 striking interindividual variations in the perceptual ratings of the different odors. Alt-
 hough certain odors tend to be rated as pleasant or unpleasant more often, e.g. the flowery
 odors Lyral and Geraniol, even for those odors there were notable percentages of partici-
 pants who did not like the smell and vice versa for the most unpleasant odor there were
 still pleasant ratings. This does not come as a surprise, considering that especially pleas-
 antness can be seen as a somewhat ambiguous dimension. Olfactory perception is influ-
 enced by (among other things) the familiarity of the odor [5], expectations about the odor
 source [40], interoceptive sensations [41], perceptual or verbal abilities [29] and personal-
 ity traits of the individual [27, 42]. This "noise" in the data must be taken into account,
 when it comes to the association with the physicochemical odor space. A perfectly accu-
 rate prediction of an olfactory percept from the molecular structure is unlikely to be found,
 especially on the individual level. Still, our results support previous findings on the rela-
 tion between odor pleasantness and intensity with molecular properties on the group
 level [5, 10, 12, 18]. Additionally, we showed that the variation in detection threshold is
 related to the first principal component of the odor space, supporting the previous finding
 that the rate of specific anosmia is related to molecular weight [8]. Moreover, the rate of
 specific anosmia was found to be similar to PC1 of the odor space, having a positive rela-
 tion to pleasantness and negative association with intensity.

 4.2 Limitations
 Some limitations shall be discussed. As a first important aspect, the exploratory na-
 ture of this study has to be pointed out. The main goal of this study was to focus on olfac-
 tory perception of non-expert raters and test the validity of structure-percept associations
 in this sample. As previous literature on naïve samples is rare, the investigation of distri-
 butions, as well as differences and interactions in perception of pleasantness, intensity,
 detection threshold and qualitative ratings was carried out in an exploratory and hypoth-
 esis generating manner. The results discussed here will need confirmation in another
 study and with a larger set of chemically different odor molecules.
 The number of odor molecules must be seen as a second limitation of our study. This
 caveat results from the fact that our dataset was originally collected and investigated for
 a different purpose (i.e. studying the prevalence and influencing factors of specific anos-
 mia; see Croy et al., 2015). Although our results point to very similar directions as previous
 associations between pleasantness, intensity and, for example, molecular weight, it has to
 be stressed that with our sample of 13 to 20 molecules the study does not have sufficient
 statistical power to draw reliable conclusions and results need to be taken with caution.
 Additionally, the odors were presented in groups of participants that received the same
 two or three odors. This may lead to an over interpretation of significant differences – or
 missing differences – between perceptual ratings for those odors that were presented to-
 gether in one group.

 5. Conclusions
 The development of a physicochemical odor space from molecular descriptors has
 proven to be a reliable and helpful tool in the investigation of the stimulus-percept problem.
 The odor space not only helps to narrow down the vast and high-dimensional nature of
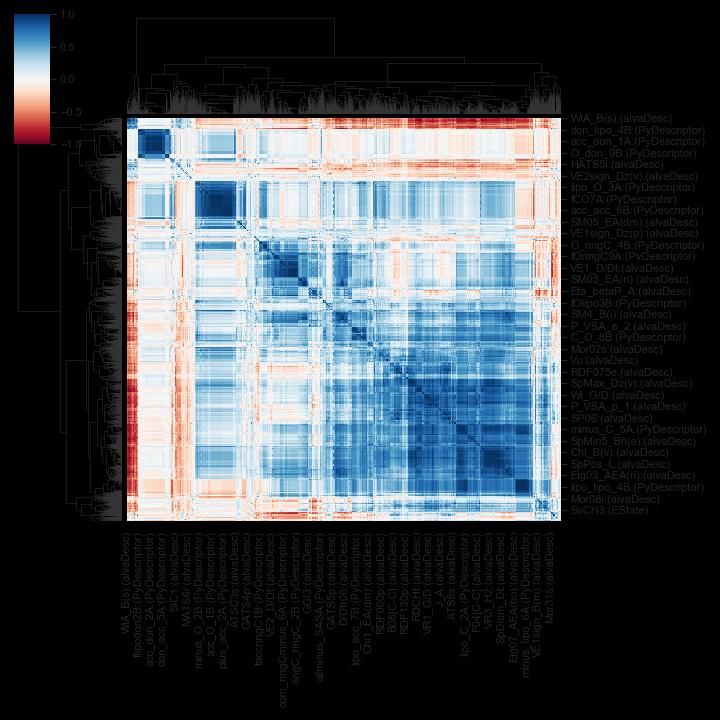
Preprints (www.preprints.org) | NOT PEER-REVIEWED | Posted: 31 March 2021

 olfactory stimuli, but can also serve for choosing chemically diverse molecules for empir-
 ical investigations that aim at relating structure to perception. Our study built heavily on
 previous approaches and validates the method with a different and larger set of molecular
 descriptors. The resulting odor space as well as the psychophysical data will be made
 available on public platforms to push the further investigation of the central dimensions
 of olfaction.
 Regarding the relationship between odor space and perceptual ratings, we showed
 that associations between odor structure and the corresponding perceptual ratings of
 pleasantness and intensity, as well as their perceptibility, i.e., detection threshold, can also
 be found in a sample of non-expert raters. In this respect, our data set contributes to the
 enlargement of the pool of psychophysical data on olfactory perception encompassing a
 large population of non-expert participants. While our study stands out with its large na-
 ïve sample and the results go in line with previous results, it is limited by the small set of
 odor molecules for which we obtained perceptual ratings. Future studies should look at a
 larger number of odor molecules to make profound conclusions about relationships be-
 tween structure and perception. Furthermore, more information about influencing factors
 on the part of the study participants should be taken into account, as implied by the large
 interindividual variations found for perceived pleasantness and intensity of odors.
 While advances in computational methods have made it possible to make increas-
 ingly accurate predictions from physicochemical structure to percept it is noted that hu-
 man olfactory perception is no analytical process of molecule detection, but is part of a
 multisensory integration of visual, auditory, haptic and social information from our envi-
 ronment. Moreover, the interpretation of sensory inputs is heavily influenced by top-
 down processes that are steered by memory, experience, interoception and interpersonal
 characteristics. The prediction of perception from odor stimulus structure can therefore
 only work to a certain degree, and perhaps, physicochemical dimensions of individual
 molecules can be seen as a necessary but not sufficient condition to determine the corre-
 sponding percept of an individual.
 To put it in a nutshell, broad knowledge is currently created by the ongoing research
 on both the more sensoric part of olfaction, i.e., binding patterns on the receptor side, as
 well as the perceptual interpretation of olfactory stimuli in the light of situation and expe-
 rience. Both paths are facilitated by the emergence of more and more sophisticated com-
 putational methods. Integrating the findings on these different levels of examination
 seems a promising path to further demystifying the complex nature of human olfactory
 perception and may have an impact on the development of electronic olfaction devices.

 Supplementary Materials: All analyses, datasets and material for this study are available online via
 https://osf.io/e67dn/).
 Author Contributions: Conceptualization, A.B., I.C., A.C., G.C. and T.H.; methodology, A.B., A.C.,
 I.C.; formal analysis, A.B., A.C. and I.C.; resources, T.H. and G.C.; writing—original draft prepara-
 tion, A.B. and A.C.; writing—review and editing, I.C., G.C. and T.H.; visualization, A.B.; project
 administration G.C. All authors have read and agreed to the published version of the manuscript.
 Funding: This research was funded by VolkswagenStiftung, grant number 96632.
 Conflicts of Interest: The authors declare no conflict of interest.

 Appendix A

 Descriptor calculation. For the development of a physicochemical property space,
 we used a list of 1,565 odorants typically used in experiments and industry as provided
 by Khan et al. (2007) listed by name and CAS registry number (CAS = Chemical Abstracts
 Service) in their supplementary table 8. Additionally, we added 6 odors used in the da-
 taset of perceptual ratings [8] that were not included in the list from Khan et al., resulting
 in 1,571 odors in total. As a first step, we retrieved the Simplified Molecular Input Line
 Entry Specification (SMILES) for each odorant using the webchem package in RStudio©
 (version 1.2.5033, R version 3.6.2). webchem retrieves molecular properties from online
Preprints (www.preprints.org) | NOT PEER-REVIEWED | Posted: 31 March 2021

 chemical databases such as PubChem and ChemSpider via their CAS number, IUPAC or
 trivial name, InChiKey or other ids such as PubChem’s individual identification number
 [33]. For 1,389 odorants, webchem was able to identify SMILES from CAS number or name
 (see supplementary spread 1). For the remaining 182 odors (mostly fragrance oils), no mol-
 ecule could be clearly identified by the package. Therefore, we removed those odors from
 our dataset. We then used the Online chemical database (OCHEM, https://ochem.eu/), which
 allows the calculation of a large number of descriptors for the previously obtained
 SMILES [34]. We chose to calculate the 16,251 PyDescriptor descriptors [43], the 5,305 al-
 vaDesc descriptors [44] and a prediction of melting point and water solubility provided by
 OCHEM (see supplemental table 2). In total, we calculated 21,609 descriptors.
 Preprocessing. For the resulting 21,609 molecular descriptors, we identified and re-
 moved all descriptors containing infinite or missing values for any molecule and de-
 scriptors with zero values for more than 80% of the 1,389 molecules. Furthermore, we
 dropped all descriptors without noteworthy correlations (no correlation r > 0.3 with any
 other descriptor). This resulted in the final physicochemical odor space with 4,094 de-
 scriptors for each of the 1,389 molecules.

 Figure A1: Clustered correlation matrix of all 4,094 molecular descriptors. From visual inspection
 of the correlation matrix can be seen that there are large correlations between the descriptors,
 forming clusters of different sizes. To get rid of redundancies in the large descriptor collection,
 dimension reduction was performed using principal component analysis.

 References
 1. Bushdid, C., et al., Humans can discriminate more than 1 trillion olfactory stimuli. Science, 2014. 343(6177): p. 1370-1372.
 2. Meister, M., Can humans really discriminate 1 trillion odors? arXiv preprint arXiv:1411.0165, 2014.
 3. Genva, M., et al., Is It Possible to Predict the Odor of a Molecule on the Basis of its Structure? International Journal of Molecular
 Sciences, 2019. 20(12): p. 3018.
 4. Mainland, J.D., Olfaction. Stevens' Handbook of Experimental Psychology and Cognitive Neuroscience, 2018. 2: p. 1-46.
 5. Keller, A. and L.B. Vosshall, Olfactory perception of chemically diverse molecules. BMC neuroscience, 2016. 17(1): p. 55.
 6. Eichenbaum, H., et al., Selective Olfactory Deficits in Case Hm. Brain, 1983. 106(Jun): p. 459-472.
Preprints (www.preprints.org) | NOT PEER-REVIEWED | Posted: 31 March 2021

 7. Jones-Gotman, M. and R.J. Zatorre, Olfactory identification deficits in patients with focal cerebral excision. Neuropsychologia, 1988.
 26(3): p. 387-400.
 8. Croy, I., et al., Peripheral adaptive filtering in human olfaction? Three studies on prevalence and effects of olfactory training in specific
 anosmia in more than 1600 participants. Cortex, 2015. 73: p. 180-187.
 9. Moskowitz, H.R., A. Dravnieks, and L.A. Klarman, Odor intensity and pleasantness for a diverse set of odorants. Perception &
 Psychophysics, 1976. 19(2): p. 122-128.
 10. Khan, R.M., et al., Predicting odor pleasantness from odorant structure: pleasantness as a reflection of the physical world. Journal of
 Neuroscience, 2007. 27(37): p. 10015-10023.
 11. Kermen, F., et al., Molecular complexity determines the number of olfactory notes and the pleasantness of smells. Scientific reports, 2011.
 1: p. 206.
 12. Zarzo, M., Hedonic judgments of chemical compounds are correlated with molecular size. Sensors, 2011. 11(4): p. 3667-3686.
 13. Licon, C.C., et al., Pleasantness and trigeminal sensations as salient dimensions in organizing the semantic and physiological spaces of
 odors. Scientific reports, 2018. 8(1): p. 1-12.
 14. Zarzo, M., Psychologic dimensions in the perception of everyday odors: pleasantness and edibility. Journal of Sensory Studies, 2008.
 23(3): p. 354-376.
 15. Köster, E.P., The specific characteristics of the sense of smell. Olfaction, taste and cognition, 2002: p. 27-43.
 16. Boelens, H., Structure—activity relationships in chemoreception by human olfaction. Trends in Pharmacological Sciences, 1983. 4: p.
 421-426.
 17. Xu, L., et al., Widespread receptor-driven modulation in peripheral olfactory coding. Science, 2020. 368(6487).
 18. Keller, A., et al., Predicting human olfactory perception from chemical features of odor molecules. Science, 2017. 355(6327): p. 820-826.
 19. Snitz, K., et al., Predicting odor perceptual similarity from odor structure. PLoS Comput Biol, 2013. 9(9): p. e1003184.
 20. Ravia, A., et al., A measure of smell enables the creation of olfactory metamers. Nature, 2020. 588(7836): p. 118-123.
 21. Sharma, A., et al., SMILES to Smell: Decoding the Structure–Odor Relationship of Chemical Compounds Using the Deep Neural Network
 Approach. Journal of Chemical Information and Modeling, 2021.
 22. Mayhew, E.J., et al., Drawing the Borders of Olfactory Space. bioRxiv, 2020.
 23. Arctander, S., Perfume and Flavor Chemicals (Aroma Chemicals)(Carol Stream, IL. IL: Allured Publishing Company, 1994.
 24. Dravnieks, A., Atlas of odor character profiles. 1985.
 25. Dravnieks, A., T. Masurat, and R.A. Lamm, Hedonics of odors and odor descriptors. Journal of the Air Pollution Control Association,
 1984. 34(7): p. 752-755.
 26. Zarzo, M. and D.T. Stanton, Understanding the underlying dimensions in perfumers’ odor perception space as a basis for developing
 meaningful odor maps. Attention, Perception, & Psychophysics, 2009. 71(2): p. 225-247.
 27. Shepherd, D., M.J. Hautus, and P.W. Urale, Personality and Perceptions of Common Odors. Chemosensory Perception, 2017. 10(1-
 2): p. 23-30.
 28. Wilson, D.A. and R.J. Stevenson, The fundamental role of memory in olfactory perception. Trends in neurosciences, 2003. 26(5): p.
 243-247.
 29. Kaeppler, K. and F. Mueller, Odor classification: a review of factors influencing perception-based odor arrangements. Chemical senses,
 2013. 38(3): p. 189-209.
 30. Stevenson, R.J. and R.A. Boakes, A mnemonic theory of odor perception. Psychological review, 2003. 110(2): p. 340.
 31. Poncelet, J., et al., The effect of early experience on odor perception in humans: psychological and physiological correlates. Behavioural
 brain research, 2010. 208(2): p. 458-465.
 32. Haller, R., et al., The influence of early experience with vanillin on food preference later in life. Chemical senses, 1999. 24(4): p. 465.
 33. Szöcs, E., et al., webchem: An R Package to Retrieve Chemical Information from the Web. Journal of Statistical Software, 2020. 93(1): p.
 1-17.
Preprints (www.preprints.org) | NOT PEER-REVIEWED | Posted: 31 March 2021

 34. Sushko, I., et al., Online chemical modeling environment (OCHEM): web platform for data storage, model development and publishing of
 chemical information. Journal of computer-aided molecular design, 2011. 25(6): p. 533-554.
 35. Garcia, H. and P. Filzmoser, Multivariate Statistical Analysis using the R package chemometrics. 2017, Vienna: Austria.
 36. Seabold, S. and J. Perktold. Statsmodels: Econometric and statistical modeling with python. in Proceedings of the 9th Python in Science
 Conference. 2010. Austin, TX.
 37. Vallat, R., Pingouin: statistics in Python. Journal of Open Source Software, 2018. 3(31): p. 1026.
 38. Mainland, J.D., Olfaction. Stevens' Handbook of Experimental Psychology and Cognitive Neuroscience, 2018. 2(3): p. 1-46.
 39. Bentley, R., The nose as a stereochemist. Enantiomers and odor. Chemical reviews, 2006. 106(9): p. 4099-4112.
 40. Manescu, S., et al., Now you like me, now you don’t: Impact of labels on odor perception. Chemical senses, 2014. 39(2): p. 167-175.
 41. Koeppel, C.J., et al., Interoceptive accuracy and its impact on neuronal responses to olfactory stimulation in the insular cortex. Hum Brain
 Mapp, 2020. 41(11): p. 2898-2908.
 42. Croy, I., et al., Agreeable smellers and sensitive neurotics–correlations among personality traits and sensory thresholds. PLoS One, 2011.
 6(4): p. e18701.
 43. Masand, V.H. and V. Rastija, PyDescriptor: A new PyMOL plugin for calculating thousands of easily understandable molecular
 descriptors. Chemometrics and Intelligent Laboratory Systems, 2017. 169: p. 12-18.
 44. Mauri, A., alvaDesc: A Tool to Calculate and Analyze Molecular Descriptors and Fingerprints, in Ecotoxicological QSARs. 2020, Springer.
 p. 801-820.
You can also read