Public Guarantees for Small Businesses in Italy during Covid-19
←
→
Page content transcription
If your browser does not render page correctly, please read the page content below
Public Guarantees for Small Businesses in
                              Italy during Covid-19

                              Fabrizio Core∗           Filippo De Marco†

                                             July 25, 2021

                                                 Abstract

             This paper investigates whether the private sector can efficiently allocate public funds
         during a crisis. Using loan-level data, we exploit the unique features of the Italian public
         guarantee scheme during Covid-19 to study lenders’ incentives to distribute government
         guaranteed credit. Our results indicate that two key bank characteristics facilitated loan
         disbursement: size and information technology. These factors were important because of
         the high volume of online applications and low interest margins on guaranteed lending.
         Pre-existing relationships mattered for the allocation of guaranteed credit, as banks lent
         more in their core markets and where they have a larger local market share.
         Keywords: public guarantees; covid-19; liquidity constraints; information technology;
         lending relationships
         JEL: G21, G28

We thank the Italian Ministry for Economic Development and Medio Credito Centrale for sharing confidential
data on loan guarantees. Alessandro Archetti and Riccardo Di Cato provided outstanding research assistance.
We are grateful to Paul Calem, Nicola Gennaioli, Nicola Limodio, Fergal McCann, José-Luis Peydró, Andrea
Presbitero, Julien Sauvagnat, Enrico Sette, Philip Strahan and participants at the AFA 2021, Bocconi
University, Central Bank of Ireland Workshop, Columbia SIPA/BPI Conference, EBA, Erasmus University,
FINEST 2020 workshop and the University of Padua for helpful comments and suggestions.

   ∗
       Erasmus University, ERIM, and Tinbergen Institute. email: core@ese.eur.nl
   †
       Bocconi University and CEPR, email: filippo.demarco@unibocconi.it.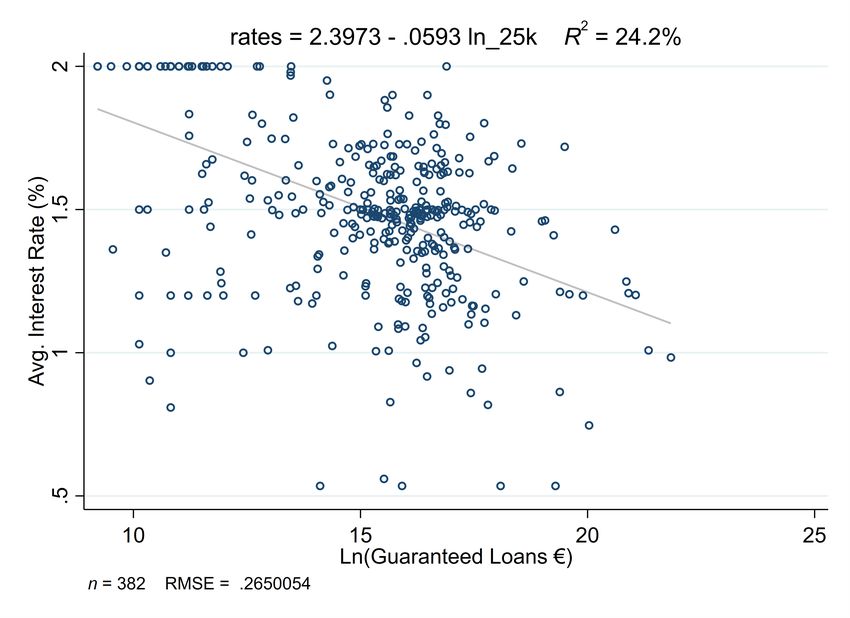
1         Introduction

What is the most effective way to deploy government funds to help the real economy during a
crisis? Policymakers worldwide faced this question when Covid-19 forced a global business
shutdown and caused a severe liquidity crunch, especially among small businesses (SMEs)
that have no access to capital markets. Many countries relied on the private financial sector,
and the banking system in particular, to act as a conduit of government-backed liquidity to
SMEs through the use of credit guarantees. Since credit guarantee programs will play an
increasingly important role in supporting SMEs’ recovery and in future crises, it is of crucial
importance to understand whether the private sector can deliver the liquidity to the firms
who need it or whether existing frictions distort the allocation of public funds.
        Governments can lend to non-financial firms either directly or through public guarantees
on private credit.1 Direct government lending has two main shortcomings: first, transaction
costs and asymmetric information frictions may prevent governments from setting up lending
facilities to small borrowers in a short window of time; second, lending by government-owned
banks is typically characterized by inefficiencies emerging from political connections (Sapienza,
2004; Khwaja and Mian, 2005; Carvalho, 2014). For these reasons, governments often prefer to
issue public guarantees on private bank loans rather than direct government loans. However,
the allocation of public liquidity through banks is not frictionless. For example, if the banking
sector is heterogeneous in its ability to disburse funds or if pre-existing relationships determine
the allocation of credit, funds may not reach the neediest firms.
        We study this question exploiting the unique institutional features of the Covid-19 guar-
antee program in Italy. On April 8th , 2020 the government expanded the existing public
guarantee scheme for SMEs, increasing the guarantee coverage ratio from 80% to 90% for
loans up to €5 million. Moreover, it introduced a 100% guarantee for €25,000 loans (increased
to €30,000 in June) that requires no fee payment from the borrower and no formal credit
    The government can also provide grants instead of loans. While the trade-off between grants and loans is
    1

a very important issue (Elenev et al., 2020), in this paper we focus on lending.

                                                     1
assessment by the bank. Since credit risk is fully absorbed by the government, the Italian
guarantee program is ideal to study lenders’ incentives to distribute public relief funds to small
firms. Moreover loan-level data from the Italian Guarantee Fund (Fondo di Garanzia, FG)
allow us to distinguish credit supply from demand with a granular set of area×4-digit-industry
or firm fixed-effects, exploiting the fact that firms could obtain partially guaranteed loans from
multiple banks at the same time. We also match loan-level data to bank and firm balance
sheet characteristics, studying how lender and borrower heterogeneity affect the terms of
credit on guaranteed loans.
       We first describe the program and its targeting. Between April and August 2020, Italian
banks issued almost one million government guaranteed loans to around 900,000 small
businesses for an aggregate amount of €79 billion. This is a significant amount of credit,
representing about 10% of total lending to the private sector in 2019 and 2% of the average
bank total assets. Most of the individual loans (86%) are fully guaranteed, which are small
and add up to a total of €18 billion. The overall take-up rate is 16% among all eligible firms
in Italy.2 Given the different institutional setting and relative market size, we also analyze
fully guaranteed loans separately from partially guaranteed ones.
       We then analyze the factors affecting credit outcomes such as disbursement times (i.e.
the time between the approval of the guarantee by the FG and the issuance of the loan by
the bank) and interest rates.3 First, we document that the variation in loan conditions is
mostly explained by supply factors (i.e. bank heterogeneity) rather than demand factors.
Because of the strong geographic clustering of the pandemic’s first wave in Italy, as well as
the decision of the government to shut down certain industries because deemed non-essential,
we use fixed-effects for borrower industry and location to capture the most relevant demand
   2
      While data on loan applications are not available, a May 2020 firm survey (ISTAT, 2020) suggests that
most eligible firms did not ask for a loan and that rejection rates on guaranteed loans were virtually zero
(1.4%). The take-up rate on government guaranteed loans has been similarly low in Spain and France too
(The Economist, 2020). Paaso et al. (2020) find that entrepreneurs’ debt aversion may be one of the reasons
for the low take-up of government guaranteed loans among Finnish firms.
    3
      We do not study loan amounts as a separate credit outcome due the limited variation in the data (60% of
guaranteed loans are exactly equal to €25,000).

                                                     2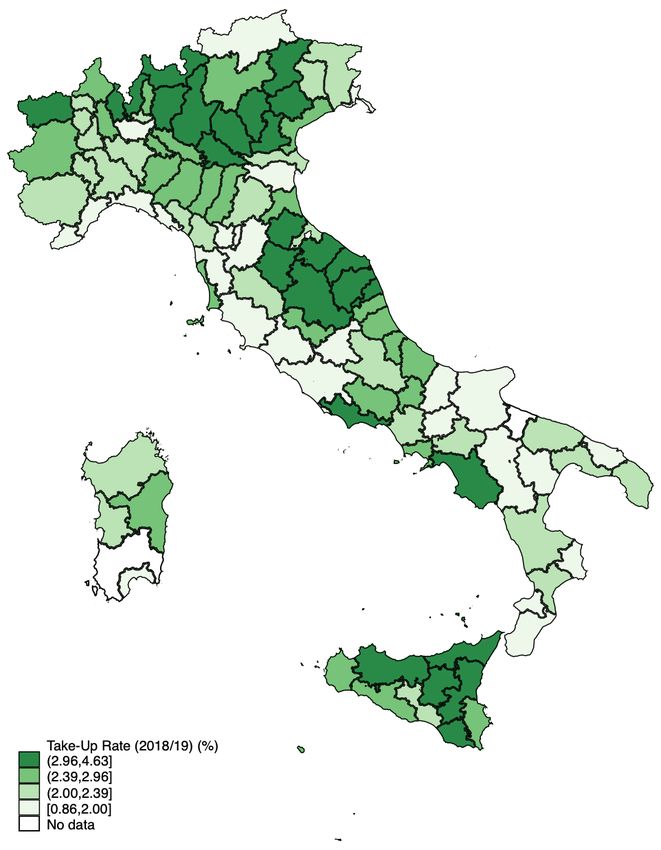
factors in this setting. The R2 of a regression of disbursement times on bank fixed-effects is
40% (41% for loan rates) compared to 12% (16%) with area×4-digit-industry fixed-effects.
Thus, supply-side heterogeneity appears to be the most significant factor to explain the terms
of credit on guaranteed loans.
   Motivated by the results of the variance decomposition, we investigate the type of bank
characteristics that can explain credit outcomes. We find that the bank digital infrastructure
has a crucial effect on loan disbursement times. Banks with better information technology
(IT) systems, as proxied by the Google Playstore review rating on their mobile banking app
or by their expenses on IT, disburse guaranteed loans almost twice as fast as the average
bank. This is the case because digitally capable banks were able to handle the surge in online
loan applications during the pandemic better than banks with a poor digital infrastructure.
Importantly, this is true after controlling for standard bank characteristics, including bank
size, which indicates that the quality of IT systems matters beyond economies of scale. These
effects are not driven by credit demand, as we control for area×4-digit-industry or even firm
fixed-effects in a short window of time between April and August 2020. Investigating the
impact of supply factors on disbursement times allows us not only to focus on a key policy
objective - the speed at which liquidity is distributed to SMEs - but also to contribute to
a relatively unexplored topic in the banking literature - the importance of loan origination
times for lending standards (Bedayo et al., 2020).
   We also find that large banks charge lower rates and disburse guaranteed loans faster
than small banks. This is true for fully guaranteed loans, but not for partially guaranteed
ones. Large banks may have an advantage in issuing 100% guaranteed loans for two reasons.
First, large banks have lower funding costs compared to small institutions, for example due
to preferential access to ECB lending facilities. Second, since interest margins on government
guaranteed credit are low, especially for small loans (1-2% in gross interest), only large banks
that can process a large volume of loans can achieve profitability. Small and cooperative
banks, that are traditionally considered to serve small businesses better than large banks,

                                               3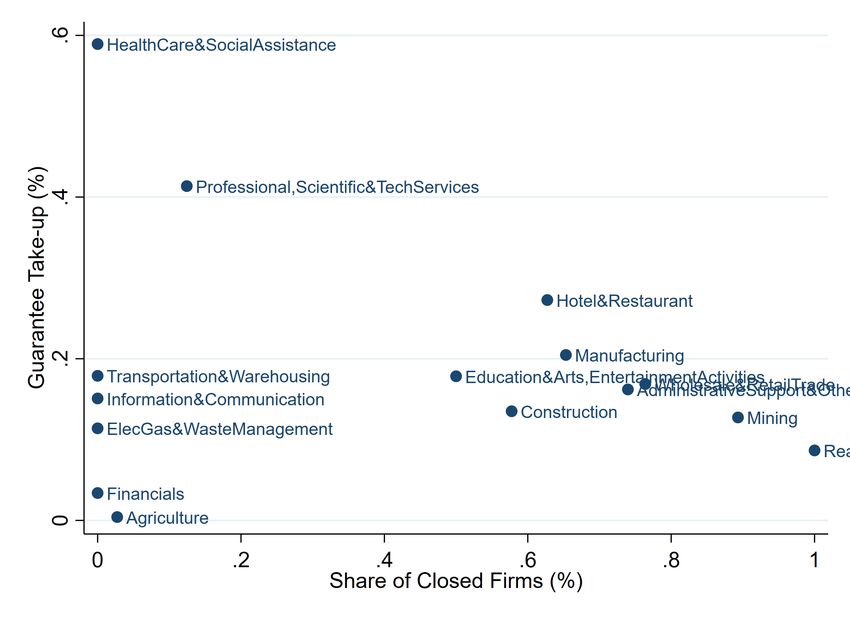
especially in a crisis (Berger et al., 2017), cannot achieve efficient economies of scale on these
loans and are much more reluctant to lend.
   Since most applications for guaranteed loans were filed online, one may question the
relevance of the bank branch network over this period. Indeed, the number of bank branches
has been steadily declining over the last ten years and Covid-19 has accelerated the adoption
of digital technologies in all sectors of the economy, including banking (Fu and Mishra, 2020).
However, since lending relationships are notoriously sticky (Petersen and Rajan, 1994; Degryse
and Ongena, 2005), local lending markets and the bank branch network have remained
important for the allocation of credit (Gilje et al., 2016). We find that this was the case even
during the pandemic: banks lent more in their core markets, i.e. in provinces where they have
a larger share of their branch network, and in markets where they have more market power,
i.e. a larger share of local bank branches. Thus pre-existing lending relationships and the
local branch network still determine the allocation of guaranteed lending, despite the growing
importance of the bank digital infrastructure.
   At the extensive margin, we find that financially fragile firms were more likely to receive
guaranteed loans. Smaller firms, those with less cash on hand, higher leverage and those
classified as zombies (Acharya et al., 2020) have higher take-up rates in both types of
guaranteed loans, with the only natural difference that partially guaranteed loans are obtained
by larger firms. Finally, firm risk is priced in loan rates depending on the guarantee coverage
ratio: rates on fully guaranteed loans do not vary as a function of firm characteristics, while
partially guaranteed loans do. Larger, older, more liquid and less levered firms pay lower
rates on 90% guaranteed loans, but not on fully guaranteed loans.
   Overall our results indicate that relying on the private sector to distribute public funds
may lead to heterogeneous outcomes, depending on the existing bank-firm matches: if a firm
was matched with an efficient bank it would receive guaranteed loans faster and at lower rates.
Crucially, bad quality of the bank IT infrastructure hampered the process of distributing
guaranteed loans, in terms of both pricing and processing times. Notably, local cooperative

                                                4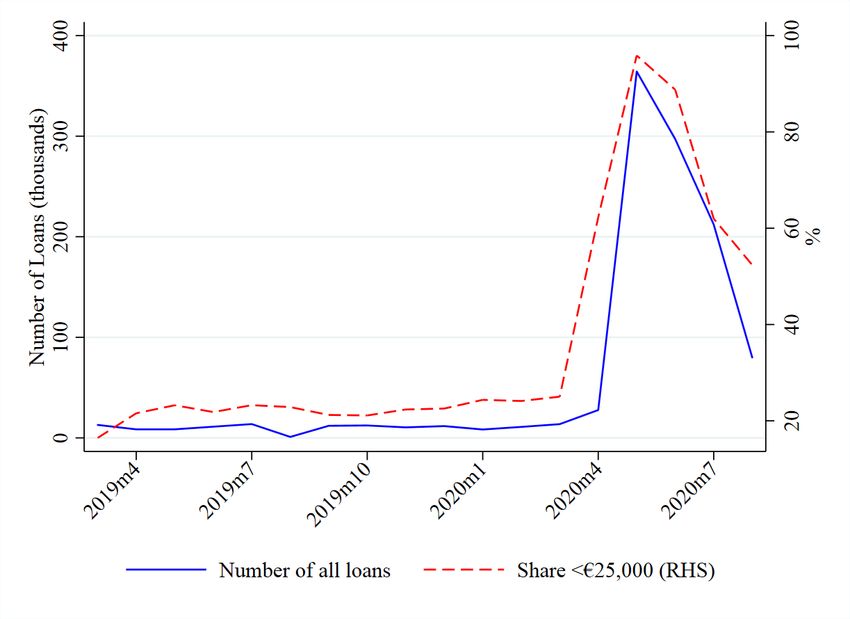
banks, which are supposed to have a comparative advantage in lending to small businesses
(Berger et al., 2017), were conspicuously inefficient in providing 100% government guaranteed
loans which were meant for the very small firms. Cooperative banks charged higher rates
compared to other banks (145 vs 119 bps on average) and took almost a week longer to
disburse them. However, we also find that the bank branch network still matters for the
allocation of guaranteed credit: banks lend more in their core markets and where they have a
larger local presence.
   This paper contributes to the literature on public credit guarantees. Many papers have
focused on the US loan guarantee program from the Small Business Administration (SBA)
(Brown and Earle, 2017; Bachas et al., 2019). Others have studied the effect of loan guarantees
on firm performance in the UK (Gonzalez-Uribe and Wang, 2020), the creation of new bank
relationships in Chile (Mullins and Toro, 2017) or employment and earnings in France (Barrot
et al., 2019). Few however have examined the effects of guarantees on loan outcomes such as
interest rates or loan origination times with matched firm-bank data. We are also the first
to uncover the importance of the bank IT infrastructure in allocating government-backed
liquidity.
   Furthermore, we contribute to the fast growing literature on the role of IT in financial
intermediation. A recent paper by Timmer and Pierri (2020) shows that higher intensity of
IT-adoption is associated with lower levels of non performing loans, while Ahnert et al. (2021)
show that bank IT helps spurring entrepreneurship. Moreover, Kwan et al. (2021) study
the impact of the Covid-19 crisis on banks’ digital technology and find that high IT banks
are more likely to participate in the PPP program. While these papers rely on measures of
intensity of IT adoption, like the number of PCs per employee or the number of communication
technologies used, we construct a novel measure: the app rating as determined by customers’
reviews. As such, our measure is more likely to capture the quality of bank investment in IT.
   This paper also joins the burgeoning literature studying the impact of the Covid-19
pandemic on financial markets and corporate outcomes. Many papers have focused on stock

                                               5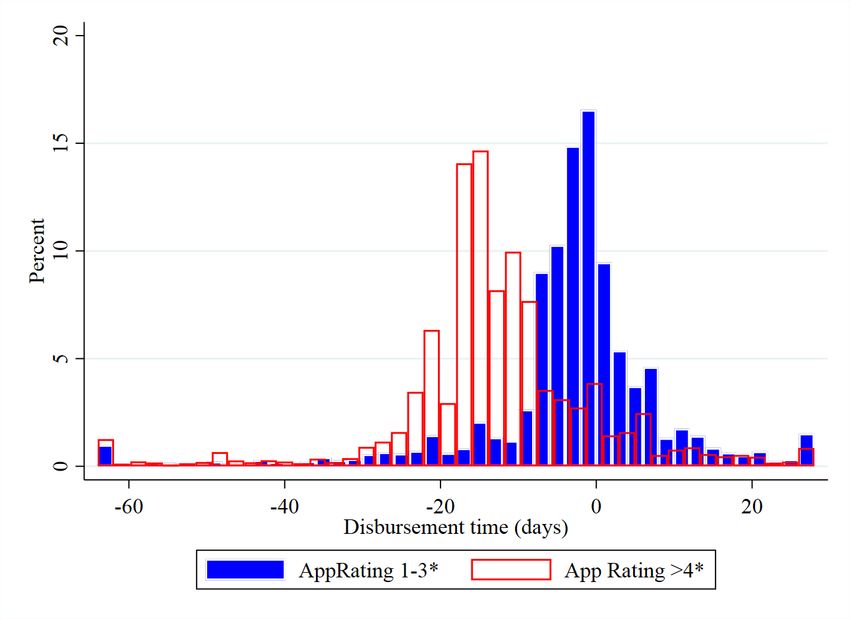
market reactions to Covid-19 (Croce et al., 2020; Gerding et al., 2020; Ramelli and Wagner,
2020). Covid-19 led to the largest increase in demand for credit ever observed by commercial
banks (Li et al., 2020), which improved the stock market performance of firms with access to
such liquidity (Acharya and Steffen, 2020). Draw-downs on existing credit lines from large
firms, that cannot be fully explained by differential demand for liquidity (Chodorow-Reich et
al., 2020), may also have crowded out other forms of credit to smaller firms (Greenwald et al.,
2020). Others have focused on the impact of Covid-19 on SMEs employment and default,
both in the US (Bartik et al., 2020) and in Europe (Gourinchas et al., 2020). Italy is one of
the country most severely affected by the rise in NPLs due to its high share of SMEs (Carletti
et al., 2020). Balduzzi et al. (2020) show that Italian firms in more affected areas and sectors
become more pessimistic about future sales.
   Many contemporary studies have analyzed the impact of the US loan guarantee program
(PPP) on employment and other outcomes (Autor et al., 2020; Chetty et al., 2020). Detailed
balance-sheet information on PPP borrowers is typically restricted to publicly listed firms
(Balyuk et al., 2020; Duchin et al., 2020). Our data instead allow us to trace the firm-level
uptake for a large sample of private small firms. In terms of lender heterogeneity, Granja et
al. (2020) analyze the allocation of PPP loans and find that funds did not flow to areas more
adversely affected by the business shutdowns, partly because of significant heterogeneity across
banks in terms of disbursing PPP funds. Erel and Liebersohn (2020) show that PPP loans
from online banks and non-banks (FinTech) were used in ZIP codes typically under-served
by banks. Finally, Li and Strahan (2020) show that PPP lending reflects traditional credit
supply factors at bank level, such as bank size, lending commitments and the importance of
core deposit markets.
   The strong heterogeneity in lender participation is a prominent feature of our data
too, suggesting that bank supply-side restrictions are relevant for the post-pandemic loan
guarantee programs in different countries. A big picture insight of our results is that if low-cost
government backed liquidity meant to support small businesses is channeled through the

                                                6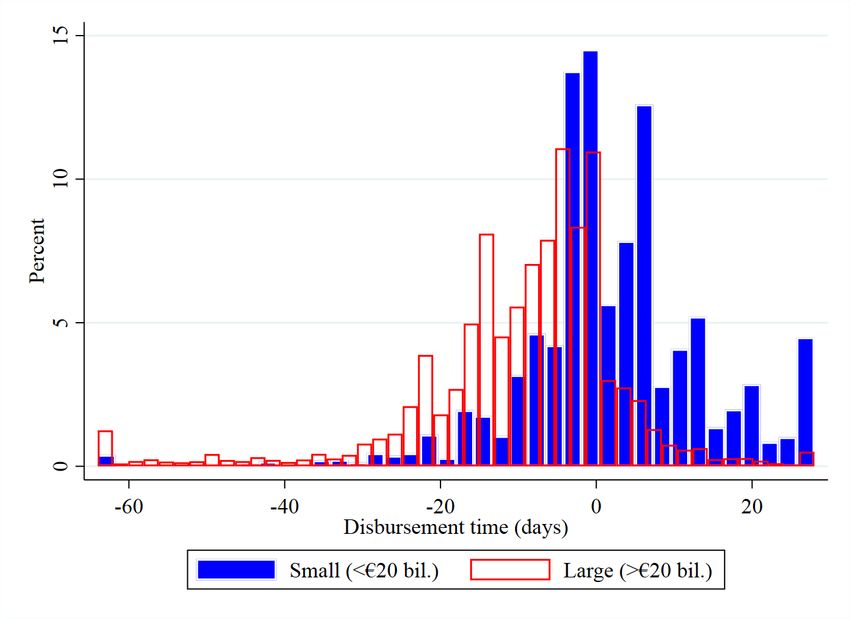
banking system, the existing lending technology and other local banking market characteristics
will determine who gets credit first and at which condition.

2       The Role of Public Credit Guarantees

The goal of public credit guarantees is to improve access to credit for firms, especially SMEs
or start-ups, that do not have adequate collateral to participate in private credit markets
because of asymmetric information (Stiglitz and Weiss, 1981). Loan guarantees issued by
government-backed entities, like the SBA in the US or the FG in Italy, have several supposed
advantages over other types of public interventions in credit markets, such as direct lending
by a public institution (Jimenez et al., 2019). First, by delegating screening and monitoring
to private banks, issuing public guarantees mitigates the risk of politically connected lending
(Khwaja and Mian, 2005). Since guarantees are typically partial, banks retain some skin-in-
the-game, which limits moral hazard on their side. Second, guarantees are a cost-effective
way for the government to support bank lending to SMEs, because they require low initial
outlays compared to direct lending.
    There are several potential downsides to the use of guarantees as well. If firms obtaining
government guaranteed credit are those that would have obtained private funding anyways,
there would be no impact on overall access to credit for firms. Worse, guarantees might lead
to adverse selection, attracting marginally riskier borrowers and worsening the overall pool
of firms receiving credit. Additionally, banks could have lower incentives in screening and
monitoring of the borrowers in the presence of moral hazard. In this case, future defaults will
eventually increase (de Blasio et al., 2018), leading to a high cost of the scheme for public
finances ex-post. Thus, whether public credit guarantees are effective in supporting firms’
access to credit is ultimately an empirical question, an answer to which remains elusive to
date.

                                              7
2.1 The Italian Public Guarantee Scheme
The recourse to credit guarantee schemes to alleviate funding constraints for small businesses
is not new. These types of government interventions became increasingly popular after the
2007-08 financial crisis (Beck et al., 2010). In Italy, the public guarantees scheme, named
Fondo di Garanzia (FG), started its operations in 2000 and has supported SME lending
massively in the aftermath of both the financial crisis and the sovereign debt crisis (de Blasio
et al., 2018). The loan guarantee program in Italy was already quite large compared to other
countries even before Covid-19. For example, in 2017 a total of €17.5 billion in new loans to
SMEs received a public credit guarantee, compared to €4 billion in France and $25 billion in
the US. As required by EU State Aid rules, borrowers pay a fee to benefit from the public
guarantee. The fees vary between 25 and 200 bps, depending on the size of the firm and the
residual maturity of the loan.
In response to the Covid-19 pandemic, on April 8th , 2020 the Italian government approved
a law decree, the so-called DL Liquiditá, that strengthened the FG capacity to issue guarantees
by an additional €400 billion. Of these, €200 billion were dedicated to guarantees for small
firms below 500 employees and represent the key novelty of the Italian guarantee fund. First
of all, the guarantee coverage was increased from 80% to 90% and eligible loan size went
from €1.5 to €5 million.4 The amount of the loan was capped at one quarter of sales in 2019
or twice annual payroll. Second, for loan amounts up to €25,000 (increased to €30,000 in
June), the guarantee is full and free, i.e. no extra-fees are charged to the borrower to obtain
it. Moreover, interest rates on small loans were capped at around 2%, but could also be set
below the ceiling.5 The loans have a maturity of 6 years (increased to 10 years in June) and
no principal payment, only interest, is due in the first two years of the loan. According to the
4
An additional 10% guarantee for loans below €800,000, bringing the total guarantee to 100%, can be
granted by Confidi, a consortium of other guarantee funds. Firms whose loan exposures are classified as
non-performing (unlikely to pay or bad debt) as of January 2020 are excluded.
5
The interest rate cannot exceed the following: a weighted average of Italian sovereign bond yields (tasso
di rendistato), plus the spread between Italian bank and sovereign 5-year CDS spreads, plus 0.2%. In early
April, the interest rate cap was around 2% but it decreased to about 0.6% in August. For loans that are 90%
guaranteed, the interest rate is freely determined by the bank.
8law, guaranteed lending need to be new loans, not a replacement of existing credit facilities
with the borrower.
Crucially, fully guaranteed loans require no application of the credit scoring model typically
used by the FG to issue the guarantee. Normally, in fact, the public guarantee scheme involves
three agents: a bank (i.e. the applicant), a firm (i.e. the beneficiary), and the FG. First, the
firm needs to file a standard loan application with the bank of choice. Then, the bank has
to verify the firm eligibility for the scheme through a scoring system software provided by
the FG (see de Blasio et al. (2018) for further details) and file a separate application to the
FG in order to request the public guarantee on the loan. As of April 2020, all these steps
have been removed for loans below €25,000, so that SMEs can quickly obtain the needed
liquidity. Firms have to complete a self-declaration form, that the bank will forward to the
FG, in which they state that their business has been affected by Covid-19, and that they are
eligible to receive 100% government guaranteed loans.
Other European countries, such as Germany, France, Spain and the UK have introduced
similar measures. The US PPP is different, in that it offers government guaranteed loans
that are forgiven, i.e. they become grants, if they are used to cover payroll costs or other
fixed expenses such as mortgage interest, rent, and utility bills. Thus PPP is a substitute for
short-time work programs which are instead common in European countries. Finally, loan
guarantees are part of a larger menu of government interventions that include debt moratoria
and other grants to support firms during the pandemic.
3 Data
Loan level data on the universe of guaranteed loans are publicly available in Italy.6 This
loan origination data includes basic information on the borrowing firm or the self-employed
individual that accessed the guarantee (name, address, sector and, most importantly, the
The
6
act on data transparency made these data publicly available at
https://www.fondidigaranzia.it/amministrazione-trasparente/
9unique tax code), the amount of the loan and the guarantee, the approval date of the guarantee
and the type of program (e.g. support for start-up, microcredit, SMEs in the South of Italy).7
We also obtained confidential loan-level data from the FG on loan interest rates and, for a
subset of the loans, the date in which the loan was actually disbursed to the firm, matched
with a bank identifier. We calculate the total number and value of guaranteed loans issued by
each intermediary and we match this information with public records from Parliamentary
Committee on the banking system, that contain the names of every intermediary in Italy who
extended guaranteed loans. Doing so allows us to recover the names of about 120 lenders that
extended 95% of total guaranteed credit. We then match the bank names to 2019 balance
sheet characteristics from Bureau Van Dijk (BvD) Orbis BankFocus. We also obtain data on
location of branches of all Italian banks from the Bank of Italy Supervisory Register.
We hand-collect data on bank IT capabilities by retrieving from the Google Playstore
the rating of the mobile banking apps for the top 100 banks that represent more than 90%
of total guaranteed loans. Google’s Android is the operating system used by more than
80% of smartphones in Italy so its reviews capture the majority of bank customers. Google
reviews range from 1 star (very bad) to 5 stars (excellent) and are a customer-based measure
of the quality of the bank digital infrastructure. Although this is a coarse indicator of a
bank investment in IT and its quality, a report from the Italian bank association (ABI, 2020)
states that the development and maintenance of mobile banking apps is the main source of IT
costs for banks. Fu and Mishra (2020) show that both download and usage of finance mobile
applications soared in countries more affected by the pandemic, underlying the importance of
mobile apps as a measure of IT quality during this period. We complement this information
with banks’ actual expenses on IT from Orbis Bank Focus in 2020, that we divide by the
total of non-interest operating expenses in the same year.8
7
Loan applications data on guaranteed credit do not exist (fully guaranteed loans are even below the €30,000
reporting threshold of the Italian Credit Register). However, anecdotal evidence from the Parliamentary
Committee and a survey from ISTAT (2020) suggests that 100% guaranteed loans have rejection rates of
almost zero. Banks, after an initial slow start in the approval process due to the large surge in applications
and logistical bottlenecks, had disbursed at least two thirds of all applications by the end of May.
8
IT expenses are reported by Italian banks under the IFRS9 accounting standard, which was introduced in
10Next, we retrieve firm-level data from BvD Orbis - a database with the financial accounts
for the universe of Italian firms. Most firms in Orbis (72%) are private partnerships and sole
proprietorships, i.e. unlimited liability companies that are common legal structures for very
small firms, for which we only have basic identifying information (name, tax code, address,
sector and date of incorporation). We have instead the full financial accounts of around
600,000 firms, mainly limited liability companies. We then match these firms to the FG data
using the firm unique tax code. Within the sample of 600,000 firm with full financial accounts,
about 120,000 firms obtained a 100% guaranteed loan, 40,000 obtained 80,000 loans with
a partial guarantee, while the remaining did not obtain any guaranteed loan, despite being
eligible.9 We also identify zombie firms in the data in the spirit of Caballero et al. (2008), i.e.
low credit quality firms that obtain cheap credit. Following the definition of Acharya et al.
(2020) for Amadeus-Orbis data, we classify as a zombie a firm that has below the median
interest coverage (EBIT over interest expenses), above the median leverage and below the
median cost of credit (interest expenses over outstanding short and long-term debt).
Furthermore, we gather data from Movimprese, the statistical report about firms in Italy
from the chambers of commerce (Infocamere). From Movimprese we extract the total number
of registered firms of any legal form, i.e. both limited liability companies and unlimited
partnerships, in Italy at the end of 2019. The data is disaggregated at the province and 2-digit
NACE sector and we use it to measure take up of the guarantee program in the cross-section
of provinces and sectors in Italy.
Panel A of Table 1 presents the summary statistics for the sample of guaranteed loans
for which we have full information on interest rate, disbursement time and bank identity
from the FG. Summary statistics are shown separately for firms that obtained a 100% and a
90% guaranteed loan. Partially guaranteed loans are much larger than fully guaranteed loans
(€390,000 vs. €20,000), and carry much higher interest rates (2.9% vs 1.1%). Disbursement
Italy in 2018. As such, data on IT expenses prior to 2020 are partial and incomplete.
9
Overall, we obtain full financial accounts for 66% of the limited liability companies that appear on the
FG data. We also match 43% of unlimited liability companies, but these do not enter our estimation sample
because they have missing balance sheet information.
11times are calculated as the number of days between the approval date of the guarantee by
the FG and the date in which the bank effectively hands out the loan to the borrower.10
Partially guaranteed loans are disbursed on average 11 days after the approval of the guarantee,
whereas fully guaranteed loans are disbursed on average 10 days before. The negative average
disbursement time indicates the confidence of private banks in the willingness of the FG
to approve as many fully guaranteed loans as possible. In both cases there is a significant
cross-sectional variation: the standard deviation of disbursement times is larger than the
mean.
Panel B collects summary statistics for the 114 banks in the sample that extended
guaranteed loans and for which we hand-collected information on the app rating from the
Google Playstore. 36% of the banks in the sample have a rating of 4 stars or more, with
the average rating being 3.4. Banks in the sample classify 10% of their loan portfolio as
non-performing, have 16% Tier 1 capital ratio, and a ROA of 0.11%. Regarding the sample
for which data on IT expenses is available in Orbis Bank Focus, banks spend on average
6.5% of their non-interest operating budget on maintenance and development of their IT
infrastructure.
Panel C shows the summary statistics for the sample of firms with full financial accounts
in Orbis that obtained a guaranteed loan for which we have full information on interest rate,
disbursement time and bank identity from the FG. Most firms are rather small, with median
assets totalling around 5 million euros. They hold 12% of total assets as cash or other liquid
assets, and finance almost 80% of the balance sheet with non-equity-like instruments such as
bank debt or trade credit. Around 8% of the firms in our sample are classified as zombies.
10
We have data on disbursement times only for about half of guaranteed loans because banks have up to
six months to report the data to the FG (the vintage of our FG data is December 2020).
124 Results
4.1 Stylized facts
Before turning to a more formal regression analysis of the factors influencing credit conditions
on guaranteed loans, we describe some general patterns in the data.
First of all, the guarantee program for SMEs in Italy was large even before Covid: from
2013 to 2019, €17 billion of loans per year have received a partial (64%) public guarantee,
steadily increasing every year (Panel A of Figure 1). However, in the first eight months of
2020 alone, the volume of guaranteed lending reached a total of €79 billion, representing 10%
of the stock of bank credit to non-financial firms in 2019 and 2% of bank total assets. Panel B
of Figure 1 further reveals an increase in the number, and not just the volume, of guaranteed
loans which resulted in a reduction in the average size of the loans: after April 2020 the vast
majority (86%) of loans are below €25,000.11 These were extended to 829,053 borrowers, two
thirds of which are private partnerships, sole proprietorships and self-employed individuals.
While numerous, fully guaranteed loans represent only 0.2% of bank total assets.
Second, we document significant heterogeneity in credit conditions for guaranteed loans.
Since the maximum loan amount for guaranteed loans is fixed by law (and it is exactly equal
to €25,000 for most loans), we study two other margins of adjustment: interest rates and
disbursement times. Disbursement times are important because one of the key objective
of loan guarantee programs is to distribute liquidity quickly to small firms. Both interest
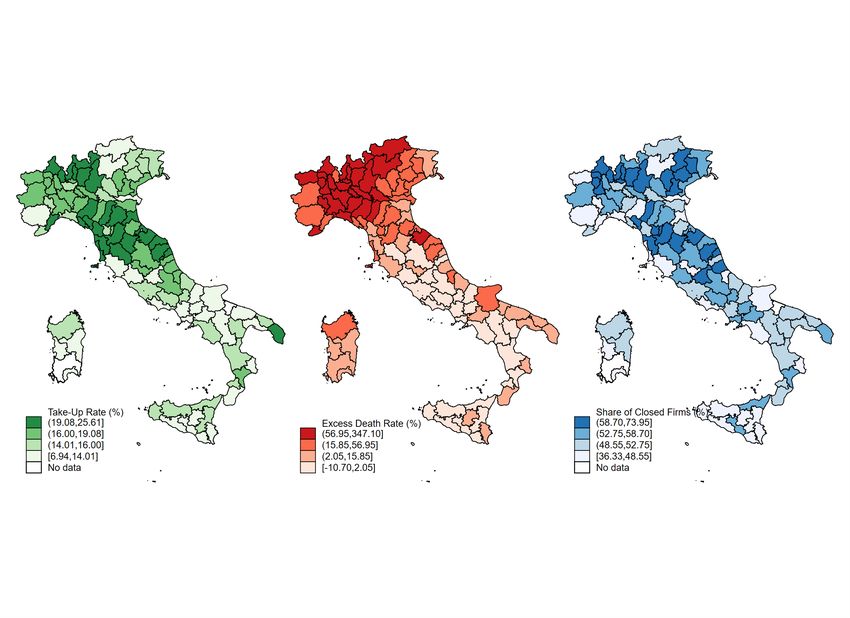
rates and disbursement times vary significantly across lenders. Figure 2 shows that average
interest rates and disbursement times at bank level for 100% guaranteed loans are negatively
associated with bank size. But size is not the only driver of differences in disbursement times
across banks. During the pandemic, most loan applications were made online, through bank
11
There is also evidence of bunching in the loan size distribution after April 2020 (Figure A1 in the Online
Appendix). In particular, among government guaranteed loans below €50,000 issued in April 2020, two thirds
are exactly at the €25,000 threshold compared to 21% before then. As the loan threshold was increased to
€30,000 in late June, a small excess mass appears at that cutoff too. Interestingly however the mode of the
distribution remains at €25,000 even in July, suggesting that the old threshold is more salient to borrowers.
13websites. Presumably, banks with better IT systems were able to cater to the surge in online
loan applications better than banks with a poor digital infrastructure. In Figure 3 we show
that the entire distribution of disbursement times for banks with highly rated apps is shifted
to the left compared to those with low-rated apps.12
To further explore whether the heterogeneity is mostly driven by supply or demand factors
we decompose the cross-sectional variation of credit conditions into two components: fixed
bank characteristics and common borrower variation at the province and (4-digit) sector
level. Variation at the province level is important because the first wave of the pandemic in
Italy had a strong geographic clustering.13 Similarly, variation at the sector level captures
the decision of the government to shut down some of the businesses deemed as non-essential.
As such, variation at the province and sector level is likely to capture a significant part of
demand heterogeneity. Formally, we run the following regression at the loan level:
Yb,ps = λb + µps + b,ps (1)
where Yb,ps is either the interest rate or the disbursement time of a loan made by bank b to a
firm active in the 4-digit sector×province ps. λb and γps are a set of bank and province-sector
fixed-effects that proxy for supply and demand heterogeneity, respectively.
Table 2 reports the R2 statistics of the regression in equation (1) including each set of
fixed-effects at a time or both. Most of the loan cross-sectional variation in credit conditions
is explained by individual bank fixed-effects. Borrower location and industry capture 12%
and 16% of the variation in disbursement times and interest rates, respectively, while bank
fixed-effects capture about 40%. Adding both together only marginally improves the overall
fit of the regression compared to bank fixed-effects only. The high R2 associated to bank fixed-
12
The difference in app rating is correlated with size, since large banks tend to have better rated apps, but
it is not only explained by that: in Panel B of Figure 3 we show that indeed larger banks have a distribution
of disbursement times shifted to the left, but the distributions are much more aligned than for rating on the
mobile banking app. In the regression analysis we will control for the two separately.
13
In the North the province of Bergamo, the hardest hit in the country, saw an increase in excess deaths of
+340%, while other provinces, like Napoli in the South, experienced no increase in excess deaths.
14effects suggests that supply-side heterogeneity is the most important driver of heterogeneity
in credit conditions on guaranteed loans, which we focus on in the next section.
4.2 Individual Bank Characteristics and IT systems
Motivated by the results from the variance decomposition in equation (1), we now explore
which individual bank characteristics affect the pricing and disbursement times of guaranteed
loans. In particular, we run the following specification:
Yf,b,m = β1 BankITb + γ 0 Xb + µf + λm + f,b,m (2)
where Yf,b,m is either the interest rate or the disbursement time of a loan made by bank b to
firm f in month m. We also run the regressions separately for fully and partially guaranteed
loans. BankITb is one of two measures of bank IT: a dummy equal to one if bank b has
a 4-5 star rating on its mobile banking app from the Google Playstore (AppRatingb ≥ 4)
or the share of IT expenses over total operating expenses. Our preferred measure is the
customer-based satisfaction rating on the mobile banking app, which is a better proxy for
the quality of IT than the share of IT expenses. In any case, since the development and
maintenance of mobile banking apps is the main source of IT costs for banks, the two measures
give similar results. Xb is a vector of other bank characteristics such as size, capitalization, the
quality of the loan portfolio (NPL), profitability and interbank funding. We fully absorb credit
demand with an exhaustive set of 4-digit industry×province fixed-effects or firm fixed-effects,
exploiting the fact that some firms obtained multiple partially guaranteed loans from different
banks. We also include a dummy for the month in which the guaranteed loan was obtained.
The calendar date when the loan was issued is relevant because the interest rate cap varies
over time with government bond yields and CDS spreads, so that loans issued in April have a
higher interest rate cap than those issued over the summer, when market interest rates fell.
Processing loans also took longer in the initial phase of the pandemic, as many banks were
15not ready to accommodate a large surge in government guaranteed loan applications. Finally,
standard errors are clustered at the bank level. Results are presented in Tables 3 and 4.
We find that banks with highly rated app (4-5 stars) disburse both partial and fully
guaranteed loans 4-8 days earlier compared to other banks. This is a sizable effect, since
the average fully guaranteed loan is processed 10 days before the approval of the guarantee.
Importantly, the coefficient is stable once we include firm fixed-effects (column 4), suggesting
that province×4-digit industry fixed-effects already capture most of the variation in credit
demand. Moreover, we control for size and other bank characteristics, which means that the
quality of the IT system is not simply explained by traditional balance sheet factors. Bank
IT also has a significant effect on loan interest rates for partially guaranteed loans (columns 3
and 4 of Table 4): banks with highly rated apps charge 40-56 basis points less on guaranteed
loans, even to the same firm (14-20% less compared to the mean).
Another bank characteristic that is significantly correlated with both loan rates and
disbursement times for fully guaranteed loans is bank size. Banks with a one standard
deviation increase in total assets offer 100% guaranteed loans at 20 bps less than other banks,
an effect of about 20% compared to the mean, and disburse these loans 5 days before other
banks. Large banks may have an advantage in issuing 100% guaranteed loans compared to
partially guaranteed loans because of the existence of economies of scale. Interest margins on
government guaranteed credit are low, especially for fully guaranteed loans (1% on average),
and thus only large banks that can process a large volume of loans in an automatized way can
achieve profitability. Small banks cannot achieve efficient economies of scale on these loans
and therefore end up lending at a slower pace and at higher rates. This in stark contrast to
the global financial crisis of 2007-08, where small banks with stable deposit funding could
lend more to their customers (Berger et al., 2017; Cornett et al., 2011) while large banks,
affected by negative funding shocks, cut their credit supply.
Other bank characteristics tend not to be significant. In particular, bank capitalization,
which could potentially play a role because guaranteed loans do not count for RWA, is not
16significant. Banks with a higher share of NPL also process guaranteed loans faster.
Overall, the evidence presented in Tables 3 and 4 is consistent with a story in which
large banks with better IT system are better able to process guaranteed loans, disbursing
them faster and at lower interest rates. The quality of the bank digital infrastructure may
be an especially relevant margin during a pandemic, when most loan applications happen
online. It is also worth mentioning that, given that the maximum interest rate on €25,000
loans is about €500 per year, only processing a large number of loans through an automated
procedure allows banks to maintain a positive profit margin. If a loan officer had to approve
the loans one by one, the fixed cost per loan would probably exceed interest income.14
Table 5 provides a robustness test for the effect of bank IT on disbursement times
and interest rates by replacing the rating on the mobile banking app with the share of IT
expenses over total operating costs. These items are reported under the breakdown of “other
administrative expenses” which is mandatory under the new IFRS9 accounting disclosure.
We use data on IT expenses from 2020 because this field is scarcely populated in 2019 on
Orbis Bank Focus. We find very similar results compared to the app rating: banks with a one
standard deviation increase in the share of IT expenses process fully guaranteed loans almost
one week faster than other banks and charge 20 basis points less on partially guaranteed
loans.
Finally, Table 6 tests whether firm specific heterogeneity matters once bank and province-
industry fixed-effects are included. We can do this for a limited sample of loans (about 100,000
compared to 400,000 of the full sample), where we are able to match the firm tax code in
the FG dataset to full balance sheet characteristics from Orbis. We find limited impact of
firm-specific characteristics on disbursement times: for example, a one standard deviation
increase in firm age decreases disbursement times by only half a day. No other coefficient is
larger than one, whereas bank characteristics such as size and app rating had much larger
14
As a robustness test, we re-estimate the analysis of bank characteristics on interest rates using the full
sample of loans for which interest rate information is available, even with no data on disbursement times.
Results are presented in Table A1 and are comparable in magnitude, sign, and significance to the main
analysis.
17coefficients. This suggests that bank heterogeneity has a much larger impact on disbursement
times than firm heterogeneity. We also find that firm risk is priced in guaranteed loans,
since smaller, younger, more levered firms and those with less cash on hand pay higher rates.
Perhaps not surprisingly, the interest rate varies as a function of firm risk depending on the
guarantee coverage ratio: while the effects are economically negligible for fully guaranteed
loans (less than a basis point), they are large for partially guaranteed loans. For example,
a one standard deviation increase in firm size decreases interest rates by 30 basis points, a
decrease of 11% compared to mean interest rate. Interestingly, zombie firms obtain partially
guaranteed loans with a 10 basis points discount (3.5%) compared to non-zombies. This is
consistent with the idea that zombie firms, despite being of low quality, are able to obtain
cheap credit from their banks.
4.3 Local Banking Markets
Ample evidence shows that the local bank branch network affects the allocation of credit
(Gilje et al., 2016). The literature on relationship lending also argues that banks shield their
existing customers from negative shocks during crisis times (Bolton et al., 2016) and mitigate
the impact of shocks by cutting lending less in their core markets, i.e. in areas where they
own at least one branch (Cortés and Strahan, 2017). The local nature of banking markets and
lending relationships could be relevant for the supply of guaranteed loans as well, especially in
the presence of supply constraints, such as in the first round of PPP funding (Li and Strahan,
2020) and for large corporate clients (Balyuk et al., 2020). Granja et al. (2020) find significant
lender heterogeneity in the allocation of PPP loans, with some banks “underperforming” their
normal share of small business lending in the PPP program. Since small business lending is
local, firms near underperforming banks will be cut out of PPP lending.
However, since most applications for guaranteed loans were filed online, one may wonder
whether the bank branch network matters at all for the allocation of government guaranteed
credit. Since they can easily reach any small business nationwide with online offers, banks
18are not restricted to lend in areas where they have a branch or to their own clients. Put
it differently, guaranteed loans during Covid-19 provide the perfect setting to test whether
lending relationships are sticky (Petersen and Rajan, 1994): if small businesses reach out for
new funding only to the banks they normally do business with and banks keep serving only
their existing customers, it means that indeed lending relationships are sticky and determine
the allocation of guaranteed credit.
We test this hypothesis by using the full map of bank branches available from Bank of
Italy and measure local bank presence with the share of branches. Formally, we estimate the
following:
log(Lending)b,p = β1 LocalM arketShareb,p + β2 CoreM arketShareb,p + λb + µp + b,p (3)
where the dependent variable is the log of the total amount of guaranteed credit by bank b in
province p, including both fully and partially guaranteed loans.15 LocalM arketShareb,p is the
share of the local branches of bank b in province p relative to all bank branches in province p.
This measure captures the local presence of the bank in the province. CoreM arketShareb,p
is the share of local branches of bank b in province p relative to all branches of bank b, i.e.
it captures the importance of the province for the overall branch network of the bank. We
include both province and bank fixed-effects, thus using only within bank and within province
variation in the share of local branches.
The results are presented in Table 7. First of all, we find that banks with higher local
presence supply more guaranteed credit in the province: a one standard deviation increase in
the local market share increases lending by about 7.7% relative to the mean. We emphasize
that this measure is not simply capturing a size effect, i.e. the fact that larger banks both have
a larger share of branches and supply more loans, since we either control for bank size (column
1) or include a bank fixed-effect (column 2), exploiting within bank variation only. The
coefficient on LocalM arketShareb,p is remarkably stable and it suggests that the structure of
15
We ran the specification separately for each type of guaranteed credit and obtained very similar results.
19local banking market is relevant, even if the applications are filed online. Second, we find
that when the local market is important for the bank, i.e. when the province has a large
share of the overall branch network, the bank is willing to supply more credit: a one standard
deviation increases in CoreM arketShareb,p increases local guaranteed credit by 12%. Once
again, the effect is not just driven by large provinces, which are likely to be more important
across all banks, or by large banks, which have larger market shares in larger markets, since
the specification includes a province and a bank fixed-effect. Third, when we include both
market shares together, we find that, while the effect of each diminishes by about 25-30%,
they are both positive and significant, indicating that they have an independent effect on the
supply of guaranteed credit.
Finally, we also confirm that bank size is one of the most important driver of guaranteed
credit, since it matters as much as the local market shares to determine the overall amount
of credit. Thus, differently from the US, where small local banks were able to supply more
PPP loans (Balyuk et al., 2020; Li and Strahan, 2020), large banks in Italy were instrumental
in delivering government guaranteed credit. These results highlight the importance of
understanding both the local banking market and bank-level characteristics for the transmission
and allocation of a policy stimulus to firms through the use of public guarantees.
4.4 Guarantee: Extensive margin
We conclude by analyzing the extensive margin of credit, i.e. investigating the types of firms
that accessed guaranteed loans. We do this by comparing firms that obtained a guaranteed
loan to those that were eligible but did not. Due to differences in targeting of the two
programs, we also separately analyze firms that accessed the full guarantee from those that
accessed the 90% guarantee.
At the aggregate level, firms that accessed the new guarantee program after April 2020
represent about 16% of the universe of registered firms in Italy (Movimprese), including private
partnerships and sole proprietorship. There are however large differences in the take-up rate
20both across geographic areas and sectors. For example, while virtually no firm in agriculture
has accessed the guarantee, 25% of firms in the food and accommodation industry and almost
60% in the healthcare and social assistance sector have. While in some provinces the take-up
rate is as low as 7%, in other areas it increases to 26%.
Figure 4 correlates the participation in the guarantee program in each province to the
number of excess deaths or the share of non-essential (i.e. closed) firms. The take-up rate is
generally higher in the north of the country, where the pandemic hit the hardest (correlation
coefficient equal to 0.27). This is not the case in normal times, as the take-up rate is generally
higher in the south of Italy (see Figure A2 in the Appendix). Moreover, the take-up rate in
2020 is higher in provinces with a higher share of closed businesses (correlation coefficient equal
to 0.40) which, given the industry structure at the local level, also happen to be more prevalent
in the north of Italy. The sectors that have the highest usage intensity of the guarantee are
all services, especially healthcare and social assistance (e.g., nursing homes, dental care and
other medical facilities), professional services (e.g., engineering and architecture) and food and
accommodation (Panel A of Figure 5). A similar ranking by sector is found in the US for PPP
loans (WSJ, 2020). Interestingly, the intensity of the take-up is not necessarily correlated
with the share of closed businesses in the sector: while both agriculture and healthcare were
considered essential and hence were not closed, they have respectively the bottom and top
take-up rate (Figure 5 - Panel B). This reinforces the idea that demand factors are only a
part of the picture and supply of guaranteed loans plays a fundamental role in determining
the allocation of credit.
We now test more formally which firm characteristics matter to explain the uptake of the
new 2020 guarantee program for SME by estimating the following linear probability model:
Guarantee2020f,p,s = γ 0 Xf + µps + f,p,s (4)
where Guarantee2020f,p,s is a dummy equal to one if firm f located in province p and active
in the 4-digit sector s took a guaranteed loan after April 2020. We also analyze fully and
21partially guaranteed loans separately. The control group in this estimation consists of firms
who were eligible (i.e. all SME firms with less than 500 employees), but did not obtain any
guaranteed loan.16 Xf is a vector of firm controls: log of total assets and age; cash and liquid
assets over total assets; leverage, i.e. total liabilities over assets; EBIT over assets; and an
indicator for whether the firm is a zombie following (Acharya et al., 2020). µps is a 4-digit
sector×province fixed-effect. Finally, we cluster standard errors at the province level.
The results are presented in Table 8. We find that smaller and older firms, those with less
cash on hand and more debt have larger uptake rates. Since all firm-level variables have been
normalized to have a mean of 0 and a standard deviation of 1, the coefficients can be directly
compared and interpreted as the effect of a one standard deviation increase. All such firm
characteristics matter over and above province and sector presence.
Firm size is one of the most important drivers in explaining uptake of guaranteed loans.
Naturally, larger firms seek partially guaranteed loans more than smaller ones, since these
loans can be as large €5 million. A one standard deviation decrease in total assets increases
the take-up rate of fully guaranteed loans by 26% compared to the mean (25% average take-up
rate on fully guaranteed loans) and decreases the take-up rate of partially guaranteed loans by
62% (9% average take-up rate on partially guaranteed loans). Moreover, firms with less cash
and saddled with more debt, i.e. those with higher leverage, are more likely to participate
in both types of guaranteed loans. Lastly, zombie firms are 6% and 70% more likely to
participate in fully and partially guaranteed loan programs, respectively. Older and more
profitable firms are more likely to obtain fully guaranteed loans, but the effects are quite
small for partially guaranteed loans. Overall, the results suggest that small, fully guaranteed
loans were obtained by financially weaker firms, while larger loans with a partial guarantee
were obtained by larger, yet risky firms. Moreover, partially but larger guaranteed loans seem
to encourage zombie lending more, as compared to small fully guaranteed ones.
16
We restrict the estimation sample to all eligible Italian SME firms (i.e., < 500 employees or < €50 million
in sales or < €43 million in total assets) that have a full financial account in Orbis. Furthermore, we exclude
firms that obtained a 90% (100%) guarantee loan when studying take-up of 100% (90%) guaranteed loans.
225 Conclusion
Several countries worldwide introduced credit guarantees to support small businesses affected
by the Covid-19 pandemic. Given the long-term consequences of Covid-19 on SMEs’ recovery
and the possibility that such measures may be used again in the future, it is crucial to assess
whether allocating public funds using the banking system is efficient. Studying the Italian
experience has several advantages. First, the credit guarantee program has some unique
institutional features: it covers 100% of the loan up to €25,000 and requires no credit check
by the bank granting the loan. This makes it ideal to study lenders’ incentives to allocate
public funds. Second, loan-level data on public guarantees allow a full bank-firm match of
balance sheet characteristics even for very small firms.
Our results indicate that bank heterogeneity, in terms of both lender size and the quality
of the digital infrastructure, are crucial determinants of the speed and pricing of guaranteed
loans. This suggests that the banking sector plays an important role in directing such policy
stimulus. The structure of local banking markets and bank branch presence is also relevant,
as banks’ pre-existing geographical footprints and lending relationships are an important
determinant of the overall volume of guaranteed credit. Policy makers should keep this in
mind when designing policies that are meant to address firm liquidity shortages during a
crisis.
23References
ABI, “Rilevazione sull’IT nel sistema bancario italiano,” 2020.
Acharya, Viral and Sascha Steffen, “The risk of being a fallen angel and the corporate
dash for cash in the midst of COVID,” COVID Economics, 2020.
Acharya, Viral V, Matteo Crosignani, Tim Eisert, and Christian Eufinger, “Zombie
credit and (dis-) inflation: evidence from Europe,” 2020.
Ahnert, Toni, Sebastian Doerr, Nicola Pierri, and Yannick Timmer, “Does IT help
startups? Information Technology in Banking and Entrepreneurship,” 2021.
Autor, David, David Cho, Leland D. Crane, Mita Goldar, Byron Lutz,
Joshua Montes, William B. Peterman, David Ratner, Daniel Villar, and Ahu
Yildirmaz, “An Evaluation of the Paycheck Protection Program Using Administrative
Payroll Microdata,” Working Paper, 2020.
Bachas, Natalie, Olivia Kim, and Constantine Yannelis, “Loan Guarantees and Credit
Supply,” forthcoming, Journal of Financial Economics, 2019.
Balduzzi, Pierluigi, Emanuele Brancati, Marco Brianti, and Fabio Schiantarelli,
“The Economic Effects of COVID-19 and Credit Constraints: Evidence from Italian Firms’
Expectations and Plans,” Working Paper, 2020.
Balyuk, Tetyana, Nagpurnanand R. Prabhala, and Manju Puri, “Indirect cots of
government aid and intermediary supply effects: Lessons from the Paycheck Protection
Program,” Working Paper, 2020.
Barrot, Jean-Nöel, Thorsten Martin, Julien Sauvagnat, and Boris Vallee, “Em-
ployment Effects of Alleviating Financing Frictions: Worker-level Evidence from a Loan
Guarantee Program,” Working Paper, 2019.
Bartik, Alexander, Marianne Bertrand, Zoe Cullen, Edward Glaeser, Michael
Luca, and Christopher Stanton, “How are small businesses adjusting to Covid-19?
Early evidence from a survey,” NBER Working Paper 26989, 2020.
Beck, Thorsten, Leora F. Klapper, and Juan Carlos Mendoza, “The typology of
partial credit guarantee funds around the world,” Journal of Financial Stability, April 2010,
6 (1), 10–25.
Bedayo, Mikel, Gabriel Jiménez, José-Luis Peydró, and Raquel Vegas, “Screening
and Loan Origination Time: Lending Standards, Loan Defaults and Bank Failures,” 2020.
Berger, Allen, Christa Bouwman, and Dasol Kim, “Small Bank Comparative Advan-
tages in Alleviating Financial Constraints and Providing Liquidity Insurance over Time,”
The Review of Financial Studies, 2017, 30 (10), 3416–3454.
24You can also read