Financial "deglobalization"?: capital flows, banks, and the Beatles
←
→
Page content transcription
If your browser does not render page correctly, please read the page content below
Financial “deglobalization”?: capital flows, banks, and the
  Beatles

  Speech given by
  Kristin Forbes, Member of the Monetary Policy Committee, Bank of England

  At Queen Mary University, London
  Tuesday 18 November 2014

  I would like to thank Ida Hjortsoe, Tsveti Nenova and Dennis Reinhardt for excellent assistance in
  preparing these remarks and the underlying research. Further thanks to Glenn Hoggarth and
  Tomasz Wieladek for helpful input, and to Rob Elder, Don Kohn, Benedict Roth, and Martin Weale for
  comments. The views expressed are my own and do not necessarily reflect those of the Bank of
  England or other members of the Monetary Policy Committee. They also do not represent views of
  the Financial Policy Committee or Prudential Regulation Authority – neither of which am I a member.

                                                                                                        1

All speeches are available online at www.bankofengland.co.uk/publications/Pages/speeches/default.aspx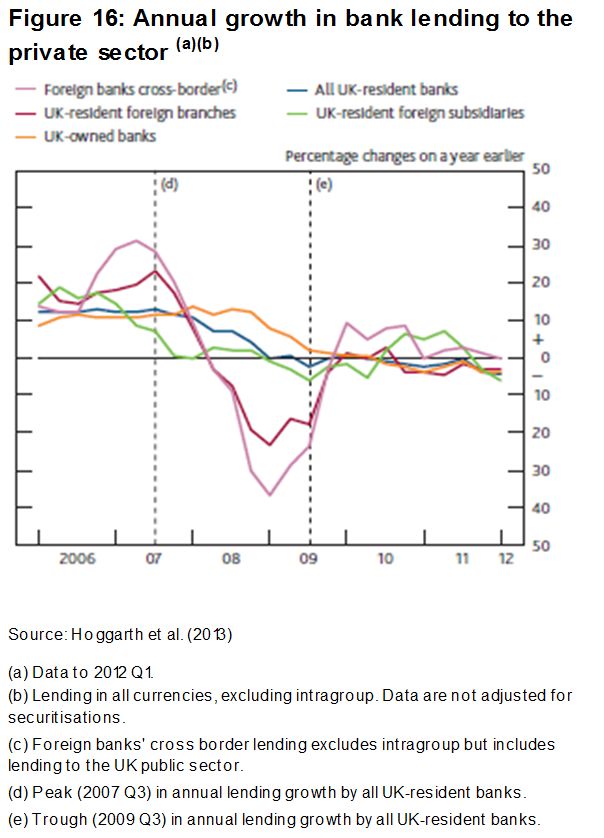
In the 1960s, the United Kingdom was at risk of running out of dollars and being unable to maintain its
  commitment to keep the exchange rate fixed at $2.80/pound. Despite having exchange controls in place that
  limited the ability of companies and individuals to engage in certain international financial transactions, the
  country still faced a steady outflow of sterling – partly due to its large trade deficit. The saviour in this case
  was not the new hero of that decade – James Bond. Or maybe I should say Austin Powers to this crowd
  given your young average age. Instead, the saviour was the Beatles (with whom this crowd is hopefully
  familiar despite your age).

  How could men with unkept hair, bell-bottom trousers, and the tendency to create unruly crowds and traffic
  jams contribute to saving the United Kingdom? By touring abroad. Their ticket sales, appearance fees,
  music royalties, merchandise licensing, and performance rights earned them large sums of foreign currency,
  which they then brought home and converted to sterling.1 From 1964 to 1966 the Beatles toured in the
  United States and other foreign countries, earning world-record dollar concert receipts. Media reported that
  they could earn as much as $650/second in today’s dollars. These foreign receipts are booked as “service
  exports” in international accounting terms and helped reduce the UK’s current account deficit.

  But even the Beatles could not help prop up the UK forever. The band’s last commercial concert was in the
  summer of 1966. The UK faced renewed pressure to earn enough foreign exchange to support its fixed
  exchange rate and finance its current account deficit. Just one year later, it was forced to abandon its peg,
  sterling was devalued by 14% against the dollar, and the UK signed an emergency IMF loan package.

  Today, it is hard to imagine any large, advanced economy being reliant to the same extent on the
  foreign-currency earnings of a single band. Instead, exchange controls have been gradually lifted since the
  era of the Beatles (albeit at different rates in different countries). This has allowed individuals, companies,
  and banks to substantially increase their international borrowing and investment, so that countries have
  become much more financially integrated over time. Figure 1a shows one measure of cross-border financial
  integration – the sum of capital flowing into and out of a country by foreigners and domestic residents each
  year (scaled as a share of global GDP) for a group of advanced economies with data back to 1970.2 These
  capital flows were miniscule in the days of the Beatles when compared to the recent period – which is why
  the actions of one band (albeit a very impressive band) could have a meaningful effect.

  1
    The information on the role played by the Beatles in supporting the pound is from International Monetary Fund (2014a).
  2
    This is gross capital flows into each country, expressed as a percent of the total GDP of all countries in the sample. “Gross” capital
  inflows is asset purchases by foreigners - capital flows from foreigners into the country - net of their sales (outflows). Gross capital
  outflows is defined symmetrically for domestics.
                                                                                                                                             2

All speeches are available online at www.bankofengland.co.uk/publications/Pages/speeches/default.aspx                                            2
Figure 1a: Gross capital inflows and outflows for                     Figure 1b: Gross capital inflows and outflows for
             selected advanced economies(a) 1970-2007                              selected advanced economies(a) 1970-2013
                                                               % of GDP                                                              % of GDP
                                                                           50                                                                   50
                      Gross capital                                        45               Gross capital
                      inflows and outflows                                                  inflows and outflows                                40
                                                                           40
                                                                           35
                                                                                                                                                30
                                                                           30
                                                                           25                                                                   20
                                                                           20
                                                                                                                                                10
                                                                           15
                                                                           10
                                                                                                                                                0
                                                                           5
                                                                           0                                                                    -10
             1970           1980           1990           2000                     1970         1980         1990        2000         2010
             (a) Sample of countries: Australia, Austria, France, Israel, Italy,   (a) Sample of countries: Australia, Austria, France, Israel, Italy,
             Netherlands, Sw eden, United Kingdom, United States.                  Netherlands, Sw eden, United Kingdom, United States.
             Source: IMF International Financial Statistics, OECD                  Source: IMF International Financial Statistics, OECD

  There has been extensive discussion of the risks and benefits of financial globalization, much of which has
  rested on the assumption that global financial integration is an unstoppable trend. But was that just
  “Yesterday” (to cite the Beatles)? Figure 1b extends Figure 1a with the most recent data available.
  International capital flows fell sharply during the crisis and show no signs of recovering to the levels seen
  pre-crisis. Cross-border financial flows for these countries (scaled by the size of their economies) are now as
  “globalized” as they were in the year 1983. Is financial deglobalization a more accurate description of today
  than financial globalization?

  The remainder of my comments will explore four questions. First, is there broader evidence of financial
  deglobalization – especially in the United Kingdom? I will show that the answer is yes. Second, what is
  driving this trend? I will show that a massive contraction in global bank flows is the culprit, and this is
  particularly important for the UK. Third, what is driving these changes in international capital flows –
  especially bank flows? I will show that international bank flows no longer appear to respond to similar drivers
  as before the crisis (namely global risk). Finally, what are the implications of this deglobalization in banking
  flows for the United Kingdom and monetary policy? I will discuss a number of considerations – some of
  which could be substantive – such as affecting how vulnerable the UK is to different types of shocks and
  making monetary policy more effective. Although it will take more than a “Hard Days Night” and “Eight Days
  a Week” – to fully understand these trends and their implications.

  Financial globalization? Or financial deglobalization?

  The previous figures that I showed you with evidence of financial deglobalization focused only on the
  cross-border flows of capital for a small set of countries for which data was available back to 1970. Do these
  findings hold more broadly? The short answer is yes. Figure 2 shows international capital flows since 1980

                                                                                                                                                         3

All speeches are available online at www.bankofengland.co.uk/publications/Pages/speeches/default.aspx                                                        3
for all countries in the world (for which data is available), and for the UK. Global financial flows show the
same pattern of increasing over time (particularly in the 2000s), falling sharply during the crisis, and not
rebounding to anything close to pre-crisis levels. International capital inflows are now only 1.6% of global
GDP, ten times less than the peak of 16% in 2007.
Figure 2: Global gross capital inflows and Figure 3: Sum of foreign assets and liabilities of
outflows for world advanced economies and UK, scaled by GDP (1980-
present)
% of UK % of world
% of UK GDP % of AEs' GDP
GDP GDP
50 20 1600 600
40 15 1400 UK foreign assets +
500
30 liabilities (LHS)
10 1200
20 400
5 1000 AEs' foreign assets +
10 liabilities (RHS)
0 0 800 300
-10 -5 600
200
-20 World gross capital
400
inflows + outflows (RHS) -10
-30 100
UK gross capital inflows 200
-40 -15
+ outflows (LHS)
0 0
-50 -20
1970 1980 1990 2000 2010
1980 1985 1990 1995 2000 2005 2010
Sample includes 21 advanced economies.
Source: IMF International Financial Statistics, ONS
Sources: Lane and Milesi-Ferretti (2007), IMF IFS, IMF WEO, ONS
Figure 3 shows another measure capturing the extent to which financial globalization has changed –
including patterns for the United Kingdom. Instead of focusing on financial flows in any year, it graphs the
stock of cross-border financial exposure (foreign assets plus liabilities as a share of GDP) that has
accumulated over time. According to this measure, financial globalization increased rapidly, especially in the
2000’s, and then this seemingly inexorable trend toward greater financial globalization faltered. According to
this measure, UK cross-border financial exposure has not only stopped increasing, but fallen by 23% (or
almost 440ppts of GDP) since its peak, so that it is currently at its level in late 2007.
To further highlight the dramatic shift that has occurred, Figure 4 replicates the previous Figure 3 since 2000
and includes trend lines based on the average pace of financial integration from 2000 through 2007. The
gaps today between the trend lines and the current values of the international exposures indicate how much
globalization has been “lost” relative to if pre-crisis trends had continued. For example, if cross-border
financial positions had continued to grow at pre-crisis trends, they would be equivalent to about 670% of
GDP in advanced economies today, instead of their current 420% of GDP. In the UK, international financial
exposure would be over 15 times GDP – about 25% higher than today. Granted, this comparison is not
entirely fair as the pre-crisis trend was built on a number of unsustainable factors – but this is the same
4
All speeches are available online at www.bankofengland.co.uk/publications/Pages/speeches/default.aspx 4comparison often used to measure the “lost” output or productivity growth since the crisis.3 The “loss” in
financial globalization has been even greater.
Figure 4: Sum of foreign assets and liabilities of Figure 5: Home bias in advanced economies
advanced economies and UK, scaled by GDP (2000-
1
2013)
% of UK GDP % of AEs' GDP 0.8
1600 800
700 0.6
1400
600 0.4
1200
500 Cross-sectional
1000 correlation 0.2
400 between domestic
800 savings and
300 investment as % of 0
600 GDP
200
-0.2
400 100 1980 1990 2000 2010
200 0
Note: Home bias is greater if the correlation betw een domestic
2000 2004 2008 2012 savings and investment is higher. The correlations from 2014
onw ards are based on latest WEO forecasts for savings and
UK foreign assets + liabilities (LHS)
investment. Sample of advanced countries includes: Australia,
UK 2000-07 trend (LHS) Austria, Belgium, Canada, Cyprus, Denmark, Finland, France,
AEs' foreign assets + liabilities (RHS) Germany, Greece, Hong Kong, Iceland, Ireland, Israel, Italy,
Japan, South Korea, Luxembourg, Netherlands, New Zealand,
AEs 2000-07 trend (RHS)
Norw ay, Portugal, Singapore, Spain, Sw eden, Taiw an, United
Sample includes 21 advanced economies. Kingdom, United States.
Sources: Lane and Milesi-Ferretti (2007), IMF IFS, IMF WEO, ONS Source: IMF World Economic Outlook October 2014
A final approach for assessing the extent of any financial deglobalization is to look at “home bias”. One
measure of home bias is the degree to which investment moves with the level of savings in the country. In
countries that are not financially globalized, investment must be funded through savings by domestic
individuals, companies, or the government. In countries that are more financially globalized, investment can
also be funded through borrowing from abroad, so that domestic investment and domestic savings do not
move as closely. The classic way to measure home bias is to estimate the correlation of domestic
investment and savings in an economy. Appendix A shows these estimates for the 1980s, 1990s, pre-crisis
2000s, and post-crisis period, and Figure 5 shows the cross-sectional correlations by year using this
methodology. Home bias started to fall in the 1990s and reached very low levels in the mid-2000’s, at which
time the world was highly financially globalized. Home bias then increased rapidly during the crisis and is
currently at levels similar to in 1994. According to this measure, financial globalization has sharply reversed
4
and shows little signs of returning even to levels of the late 1990s.
There are a number of reasons why these various measures of global financial integration could have been
interrupted during the crisis, and may not return to their previous peaks. But it is remarkable that they have
3
For example, there has been much debate on the UK productivity gap, which is often cited as a loss of 16% relative to where it would
have been today if productivity growth had continued at its pre-crisis trend. See Barnett et al. (2014).
4
One caveat to using this correlation coefficient as a direct home bias measure is that it might reflect the incidence of common shocks
which affect domestic savings and investment of all countries to different degrees. See Giannone and Lenza (2009) for further detail.
5
All speeches are available online at www.bankofengland.co.uk/publications/Pages/speeches/default.aspx 5remained at such depressed levels for such an extended period and despite the broader recovery in the
global economy.
What has caused this financial deglobalization?
Decomposing deglobalization: banking is the culprit
Before taking a closer look at what is driving this recent deglobalization in financial flows, I would like to
make one important point on exactly what flows we should be examining. Traditionally, most international
economic analysis has focused on net capital flows to a country – basically the flip side of a current account
balance. Countries that run current account deficits – such as the UK today (and in the era of the Beatles) –
need to attract net capital inflows to pay for the country’s excess of imports over exports.5 Countries have
been able to run larger current account imbalances over time, financed by larger net capital flows that are
part of increased financial globalization. These flows were largely driven by foreign investors. But, as capital
flows have increased, the most impressive changes in capital flows have not been in these net capital flows,
but in the gross flows underlying them. More specifically, net capital flows is the “net” of capital flowing into a
country from foreigners and capital flowing out of the country by domestics. Figure 6 shows these different
components for Chile (on the left) and the United Kingdom (on the right): net flows, gross foreign inflows, and
gross domestic outflows.6 It shows that the magnitude of the gross flows driven by foreigners and domestics
has increased by much more than the net flows.
Figure 6: Net capital inflows, gross inflows and gross outflows for Chile (left-hand panel) and
the UK (right-hand panel)
Net Inflows US $ billion Net Inflows
£ billion
Gross Inflows (Foreigners) 15 Gross Inflows (Foreigners)
Gross Outflows (Domestics) 100
Gross Outflows (Domestics)
10 80
60
5 40
20
0
0
-20
-5
-40
-10 -60
-80
-15 -100
1990 1995 2000 2005 2010 1987 1992 1997 2002 2007 2012
Source: IMF International Financial Statistics, ONS
5
Other factors, such as transfer payments and earnings on past investments, also affect the current account deficit.
6
Following standard balance-of-payments accounting, domestic flows are reported using a negative sign, so that −$10 billion signifies a
capital outflow by domestic residents of $10 billion.
6
All speeches are available online at www.bankofengland.co.uk/publications/Pages/speeches/default.aspx 6So why does this matter? This matters for two reasons. First, focusing on net capital flows – as has
traditionally been done – ignores the huge increase in the size of cross-border financial flows and the
corresponding extent of financial globalization that has occurred. The scale of these gross capital flows
relative to net capital flows is particularly striking for the UK, in which changes in net capital flows barely
register on the graph when measured on the same axis as the gross flows. During many periods, and
especially in the UK, movements in gross inflows and outflows broadly mirror each other, partly reflecting the
role of international banks as intermediaries for various types of financial flows.7
Second, breaking flows into those driven by foreigners and domestics can be important to understand
exactly what is driving overall capital flow movements. It is no longer appropriate to assume that most of the
volatility is driven by just foreigners; even for an emerging market such as Chile. For example, consider the
period around 2008 for Chile. If you follow the standard approach of just looking at net capital flows (the
black line), the graph could be interpreted as suggesting that at the peak of the global financial crisis – as
financial markets around the world were freezing up – foreigners decided to send money to Chile. Although I
have the greatest respect for Chile’s economic policies, I find it hard to believe that citizens of the US and UK
suddenly decided that they should move their savings to Chile in 2008. Instead, to understand what actually
happened, it is illuminating to decompose these net capital flows into those driven by foreign and domestic
investors. Foreign capital flows into Chile basically dried up in 2008 – as happened in many countries in the
world. Chileans, however, including those managing Chile’s sizeable pension funds, invested less abroad at
the same time. This “retrenchment” of capital brought home more than balanced the decline in flows from
abroad. Focusing just on net capital flows would have missed these important dynamics.
Figure 7: Global gross capital inflows by asset Figure 8: Global gross capital outflows by asset
Gross Banking inflows (inc. other) % of world Gross Banking outflows (inc. other)
GDP % of world
Gross Portfolio inflows Gross Portfolio outflows
10 GDP 4
Gross FDI inflows Gross FDI outflows
Total gross inflows 8 2
Total gross outflows
6 0
4 -2
2 -4
0 -6
-2 -8
-4 -10
1980 1985 1990 1995 2000 2005 2010 1980 1985 1990 1995 2000 2005 2010
Note: Flows related to bank bond issuance and bank buying of marketable debt are included in portfolio inflows and outflows rather
than in banking flows.
Source: IMF International Financial Statistics
7
For example, international banks can intermediate between foreign investors or depositors and savers. They can also engage in
financial transactions by international companies which are likely to invest abroad using funds raised from foreign investors.
7
All speeches are available online at www.bankofengland.co.uk/publications/Pages/speeches/default.aspx 7In addition to breaking capital flows into where they are coming from (foreign vs. domestic), it is also possible
to disaggregate them by the type of capital. I will focus on three categories: banking flows, portfolio flows
(which include equity and debt), and foreign direct investment (or FDI, which is when the investor has a
larger equity stake in an enterprise). Figures 7 and 8 show total flows by foreigners and domestics,
respectively, for the entire world, broken into these three categories.8 Both figures show that all types of
capital flows declined during the crisis – but especially banking. International banking flows not only fell to
zero, but reversed, indicating that banks not only stopped lending money abroad, but also liquidated foreign
exposures to bring money home. Portfolio flows and FDI have both since stabilized at positive (albeit
somewhat lower) levels since the crisis, while banking flows have continued to contract recently. In other
words, banks around the world appear to currently be reducing their foreign exposures and bringing money
home – driving the recent trend in financial deglobalization.
To better understand this decline in international
banking flows, it is possible to further decompose
these flows into those which are “interbank” and
“intragroup”. Interbank transactions are
arms-length transactions which take place between
unrelated banks resident in different countries.
Intragroup transactions take place between resident
banks and their foreign affiliates (either subsidiaries
or branches) and occur through internal capital
markets.9 Figure 9 decomposes international bank
flows for all BIS reporters into these two
components and shows that the decline in
international bank flows since the crisis is primarily
driven by a decline in interbank funding. In just the
UK, intergroup as well as interbank flows both
contracted sharply from 2009, although with a larger fall in interbank liabilities. Additional analysis suggests
that intragroup flows between parent banks and their foreign subsidiaries have been more stable than
between parents and their foreign branches.10
The result of this contraction in international bank lending – especially between banks resident in different
countries– has been a major contraction in the global banking network. This contraction is captured
8
I will refer to the red as banking flows, although technically it is the IMF’s “other flows” category. This is primarily banking, but also
includes additional categories, such as trade credit and SDR allocations, amongst others.
9
See Reinhardt and Riddiough (2014) for additional information on these different types of transactions and their characteristics.
10
See Hoggarth, Hooley, and Korniyenko (2013) for additional information on the different trends in intragroup lending between foreign
parent banks with their subsidiaries and their branches in the UK. The main differences between these entities are that a foreign branch
is: legally inseparable from its parent, not separately capitalised, and supervised and insured by the home authority. It is easier to move
funds between parent banks and their branches as compared to their subsidiaries.
8
All speeches are available online at www.bankofengland.co.uk/publications/Pages/speeches/default.aspx 8graphically in Figure 10.11 Each dot represents a country, and the lines represent bank flows between the
countries, with the size of the lines and dots representing the magnitude of the corresponding financial
centre or bilateral banking flows. Both figures show the extensive network of banking flows that links
economies around the world. The change in the size of the dots and density of the lines from 2008 Q3 to
2013 Q3 captures how this international banking network has contracted. The contraction in banking flows
related to the UK (denoted by GB at the bottom of the sphere) is particularly striking.
Figure 11 further highlights the magnitude of this contraction in the UK by showing the cumulative decline in
international banking from 2008 Q4 through 2013 Q4 (broken into assets/loans and liabilities/borrowing) for a
set of countries, with the left panel expressed as a share of world GDP and the right as a share of
own-country GDP. The UK clearly stands out. The contraction in UK international lending and borrowing is
larger – on an absolute basis – than for any other country for which data is available. In other words, the
decline in bank flows into and out of the UK has contributed more to the global decline in banking flows than
any other country. When this contraction in bank flows is measured relative to country size, several smaller
countries have had relatively larger contractions, but the UK is still among the five countries most affected.
There was a roughly similar decline in UK resident bank lending to and borrowing from abroad, and this
banking deglobalization even affected some of the most sophisticated global banking institutions. For
example, HSBC withdrew from consumer banking in more than 20 countries (leaving it with operations in
about 40 markets today) and Citi has cut its retail banking presence almost in half to 24 countries.12 It is also
worth noting that although this bank deglobalization was substantial in many advanced economies, other
countries further away from the epicentre of the financial crisis not only avoided this deleveraging, but
increased their international banking flows (most notably in Japan).
11
Thanks to Hoggarth et al. (2010) for inspiring the use of this pictoral framework.
12
Financial Times, “Big Banks Losing Interest in Global Ambitions,” by Martin Arnold and Camilla Hall. Oct. 20, 2014.
9
All speeches are available online at www.bankofengland.co.uk/publications/Pages/speeches/default.aspx 9Figure 11: Cross-Border Banking after the Collapse of Lehman Brothers, 2008 Q4 vs. 2013Q4
Cumulative Change in Cross-Border Banking Assets and Liabilities Cumulative Change in Cross-Border Banking Assets and Liabilities
2008Q4 to 2013Q4 (% of world GDP) 2008Q4 to 2013Q4 (% of own GDP)
50
1
0
0
-50
%
%
-1
-100
-321
-169
-215
-412
-150
-2
Japan
Sweden
Mexico
Spain
Germany
Australia
Korea
India
Austria
France
Switzerland
Taiwan
Turkey
Italy
Luxembourg
Netherlands
Ireland
Brazil
United Kingdom
Canada
United States
Sweden
Japan
Mexico
Spain
Germany
Australia
Korea
India
France
Austria
Taiwan
Turkey
Italy
Netherlands
Ireland
Switzerland
Luxembourg
Brazil
United Kingdom
Canada
United States
Assets Liabilities Assets Liabilities
Note: The figure on the left shows the cumulative change in cross‐border bank assets and liabilities vis‐à‐vis foreign bank and non‐bank sectors
following the collapse of Lehman Brothers in 2008Q3. The change is measured as the sum of exchange‐rate‐adjusted changes in assets or
liabilities between 2008Q4 and 2013Q4 relative to world GDP at 2008Q3. In the figure on the right, the change is measured relative to own country
GDP at 2008Q3.
The contraction in UK international bank flows is therefore a critically important part of the global contraction
in bank flows and the corresponding financial deglobalization. This should not, however, be surprising given
the important role that the UK plays in the global banking system. Figure 12 shows the volume of
10
All speeches are available online at www.bankofengland.co.uk/publications/Pages/speeches/default.aspx 10international bank loans (between banks) by country at the end of 2013 – after the sharp contraction – with
darker colours signifying greater global exposure. The UK stands out as providing more international loans
(bank-to-bank assets) than any other country in the world. At the end of 2013, UK resident banks provided
over $2.6 trillion in international loans, followed by US banks with about $2.1 trillion. About 15% of
international interbank activity is booked in the UK, down only slightly from about 17% in 2007. Any
reduction in global bank loans from the United Kingdom (or United States) will have global repercussions.13
Figure 12: Map of cross-border bank assets in absolute levels
Source: BIS International Banking Statistics and IMF WEO
Figure 13: Map of cross-border bank liabilities in % of own GDP
Source: BIS International Banking Statistics and IMF WEO
But not only do changes in UK international bank flows have repercussions for the world, any changes in
global bank flows can have meaningful consequences for the UK economy. Figure 13 shows international
bank borrowing by country, scaled by each country’s GDP. The United Kingdom continues to stand out (now
along with Finland) as having the highest exposure to international banks. UK interbank lending is
13
Liabilities for China and other non-BIS reporters are proxied using assets of BIS reporters. Van Rijckeghem and Weder di Mauro
(2014) show that countries with the largest foreign international banking exposure had the largest decline in exposure since the crisis.
11
All speeches are available online at www.bankofengland.co.uk/publications/Pages/speeches/default.aspx 11equivalent to 104% of GDP – even after the massive contraction documented above.14 Foreign banks also
play a major role in the UK banking system; for example, there are currently 145 branches of international
banks operating in the UK, accounting for 31% of the total assets (loans) in the UK banking system and
equivalent to about 160% of annual UK GDP.15 When the UK subsidiaries of foreign banks are included in
these calculations, their role is even greater.
Any changes in UK international banking flows and exposures clearly have global implications. Changes in
global banking flows and exposures clearly have important implications for the UK. Therefore understanding
what has driven recent changes is important for the UK as well as the global economy.
What is driving banking deglobalization?
What has caused this striking reduction in international bank flows? And why have other types of capital
flows rebounded (as shown in Figures 7 and 8) – but not bank flows? Many logical explanations for why
international banking contracted during the crisis should be less binding today – such as uncertainty about
counterparty risk, limited dollar funding, maturity mismatch between assets and liabilities, and impaired
balance sheets that forced banks to reduce lending to rebuild capital.16
To better assess exactly what is driving these trends, it is useful to take a step back and consider what drives
capital flows more broadly. Are bank flows traditionally more volatile? If so, what drives this? Are bank
flows influenced by different factors than other types of capital flows? And have any of these relationships
changed since the crisis?
Figure 14 shows the volatility in total capital inflows (from foreigners) and outflows (by domestics), as well as
for its three main components: banking flows, portfolio flows, and FDI. The left panel reports volatilities for all
advanced economies and the right focuses on just the United Kingdom. Volatility is measured by the
coefficient of variation, which captures the volatility of each unit of the relevant flow relative to GDP.17
Banking flows are substantially more volatile than portfolio flows and FDI. Banking flows from foreigners also
appear to be slightly less volatile than banking flows driven by domestics. These patterns apply to the set of
advanced economies as a whole as well as for the UK. Total capital inflows and outflows are somewhat
more volatile for the UK than the average for advanced economies, despite each type of flow being
somewhat less volatile individually. This reflects the larger share of banking flows in UK international flows
than the average, combined with the higher volatility in international banking flows.
14
Figures 12 and 13 include only international bank-to-bank lending and borrowing. Due to data limitations, they do not include bank
lending and borrowing to non-bank institutions. Figures constructed based on the IMF’s IFS data on “other” borrowing and lending,
which includes all international bank lending (plus some other cross-border flows) shows very similar patterns to those discussed above.
15
Source: Bank of England (2014).
16
See Hill and Hoggarth (2013) and Hoggarth et al. (2010) for more details on these explanations.
17
This scales the standard deviation by the absolute value of the mean of each flow category in order to adjust for the size of each flow.
It uses detrended flows as a share of GDP based on 10-year rolling windows, as suggested by Bluedorn et al. (2013).
12
All speeches are available online at www.bankofengland.co.uk/publications/Pages/speeches/default.aspx 12What drives this volatility in the different types of capital flows – and especially banking flows? There is a
long history of academic research trying to answer this question. This literature often classifies the forces
driving capital flows into “push” factors and “pull” factors. Push factors are external to the country and
generally outside of its control (such as changes in global risk aversion, interest rates in major economies,
global growth, global liquidity, oil prices, and contagion effects). Pull factors are domestic macroeconomic
and institutional factors that can be more directly influenced by the country (such as domestic growth,
inflation, debt sustainability, corporate governance, and capital controls). Recent academic work has
highlighted the “global financial cycle” that drives capital flows to advanced as well as emerging markets and
emphasizes the critical role of changes in global risk aversion, US interest rates, and global banking
conditions (especially leverage).18
Figure 14: Average coefficients of variance for gross capital flows by asset class for advanced economies
(left chart) and for UK (right chart) over 1980-2013
Coefficient of variance Coefficient of variance
5 5
4 4
3 3
2 2
1 1
0 0
Source: IMF International Financial Statistics
Can these research insights, including recent work on the “global financial cycle”, explain recent patterns in
capital flows and especially in banking? To test this, we extend the framework in Reinhardt and Riddiough
(2014) and Bruno and Shin (2013) and estimate how different variables affect banking flows, portfolio flows,
and FDI by foreigners and domestics.19 Appendix Table 1 shows the key regression results. For the period
from 2000 through 2009, the results agree with previous research. Lower levels of global risk and decreases
in global risk are correlated with significantly greater international portfolio flows and especially banking
flows. (FDI is less sensitive to global risk – but strongly correlated with host country GDP growth). This
important role of risk is supported by a number of studies; when risk aversion and/or economic uncertainty is
18
For further discussion and examples of this literature, see Forbes and Warnock (2012), Rey (2013), and Bruno and Shin (2013).
19
We regress capital flows as a percent of GDP using quarterly data. The historic window is 2000q1−2009q4 and the post-crisis window
is 2010q1−2013q4. The sample is the 20 advanced economies that are BIS reporters. We focus on results measuring risk using the VIX
– the implied volatility of S&P 500 equity index options. Key results are unchanged if we instead measure risk using the volatility risk
premia (or VRP), which is intended to isolate changes in risk aversion (and exclude economic uncertainty). Key results are also
unchanged if we follow Bruno and Shin (2013) and control for broker dealer leverage, instead of risk. The table reports results for gross
capital inflows from foreigners (liabilities), but results are the same for gross capital outflows by domestics (assets). For the analysis of
banking flows, the key results are unchanged if we use IFS data on other capital flows – which is largely banking flows – instead of the
BIS data on flows in bank assets or liabilities to all sectors. All variables are winsorized at the 5% level and offshore financial centers
(Luxembourg and Cyprus) are excluded.
13
All speeches are available online at www.bankofengland.co.uk/publications/Pages/speeches/default.aspx 13low or falling, it is easier for banks to borrow internationally (such as from money market funds in financial
centres) and the value of their equity increases. This allows them to increase leverage and increase lending
abroad.
When this analysis is repeated for the post-crisis period, however, there are noteworthy changes in the
results – but only for bank flows. Banking flows are no longer significantly affected by the level of or changes
in global risk. In contrast, portfolio flows continue to be negatively and significantly correlated with changes
in global risk, and FDI continues to show no relationship – both as found before the crisis. Global bank flows
– unlike the other types of flows – no longer appear to be driven by the same forces that affected them
before the crisis. These results are confirmed in the Appendix Table 1b which repeats the same analysis for
percent changes in bank assets and liabilities (ie, for changes in international banking positions scaled by
initial banking stocks instead of flows scaled by GDP as before).
Why do international banking flows and stocks no longer seem as sensitive to changes in global risk? Why
have these relationships changed for bank flows since the crisis – but not for portfolio flows and FDI? Are
there other factors to consider? The list of possible explanations is long, and evaluating each of them is
beyond the reach of these comments. But let me suggest some factors that may be contributing to the
recent deglobalization in banking, but have less effect on other types of capital flows.
1. Higher costs for banks to go abroad: Domestic banks tend to be better informed about local conditions
than international banks (a type of asymmetric information), especially during crises and periods of
economic change. This makes it more difficult for foreign banks to compete during these periods. The
costs of negotiating and monitoring abroad may also have increased, especially as many economies
have adopted different responses to the crisis. The large penalties applied for misconduct and
insufficient oversight may have aggravated all of these risks, making bank managers more reticent to
have large overseas operations or lend directly cross-border.
2. Reduced access to wholesale funding: Before the crisis, many banks financed lending partly through
deposits and partly through wholesale funding, i.e. loans from international investors such as
money-market mutual funds. This source of funding was particularly important for foreign banks, but
dried up during the crisis. Hoggarth, Hooley, and Korniyenko (2013) show that this form of “fickle”
funding was particularly important for foreign branches in the UK (relative to UK-owned banks and
foreign subsidiaries in the UK), and that these branches have contracted lending more than domestic
banks and foreign subsidiaries.
3. Weakness in individual bank balance sheets: Many banks’ balance sheets were negatively affected by
the crisis, due to factors such as investment losses and higher default rates. Vulnerable banks had to
rebuild their balance sheets by bringing home money from abroad, reducing lending (both domestically
and internationally), and/or raising capital through other sources. According to some measures, UK
14
All speeches are available online at www.bankofengland.co.uk/publications/Pages/speeches/default.aspx 14banks looked weaker on average in 2007 than in many other developed countries, contributing to their
greater need to strengthen balance sheets, deleverage, and reduce lending more in subsequent years.20
4. Weakness in the demand for loans: Even if banks were healthy and willing to lend internationally,
companies and individuals may have been more reluctant to borrow after the crisis, including from banks
based abroad, due to the increase in economic uncertainty. In some cases, companies and individuals
may also have been less willing to increase borrowing as they needed to pay down debt to strengthen
their own financial positions.
5. Repercussions of crisis-resolution packages: During the crisis, a number of banks received large
financial support packages from their governments. It has been suggested that in some of these cases,
as part of this financial support, banks may have been encouraged to hold domestic assets (such as
domestic government bonds), increase domestic lending (possibly at the expense of foreign lending),
and reduce foreign exposures.21
6. Regulatory changes: Banking regulation has changed dramatically since the crisis – both at the global
level as well as through individual country reforms. Changes were clearly needed to address many of the
vulnerabilities in the global banking system that became apparent during the recent crisis. These
regulatory changes should increase the resilience of banks in the future, as well as make economies
less vulnerable to problems in the banking system. They could also have important effects on
cross-country bank flows. For example, increased restrictions, regulations, or capital requirements on
foreign currency exposure or any type of international exposure could make international transactions
more costly. Increased requirements for foreign banks– such as no longer allowing foreign branches and
instead requiring foreign banks to establish any presence through subsidiaries (which require more
capital and reporting requirements than branches) – could reduce risks to domestic economies but also
make international banking more costly.
20
Van Rijckeghem and di Mauro (2014) and Cerutti and Claessens (2014) both provide empirical evidence that weaker banks
deleveraged more during the crisis.
21
Cerutti and Claessens (2014) note that banks were often asked to focus on domestic lending when receiving government support and
find that banks reduced direct cross-border and affiliates lending equally in countries where governments intervened during the crisis,
possibly reflecting the larger induced home bias. Van Rijckeghem and Weder di Mauro (2014) conjecture that financial protectionism,
taking different forms, might have induced home bias as countries with more damaging banking crises reduced their international
lending most. Using a panel dataset of UK-resident banks, Rose and Wieladek (2014) find that, after nationalization, foreign banks
reduced British lending as a share of their total lending and increased interest rates on new loans to UK residents. However, they find
no significant effect of the nationalisation of British-owned banks on their lending activity or interest rates.
15
All speeches are available online at www.bankofengland.co.uk/publications/Pages/speeches/default.aspx 15Figure 15: Average minimum capital requirement Even increases in minimum capital requirements
ratio for UK banks that did not differentiate between international and
% of RWA domestic lending could contribute to reduced
Unweighted 15 leverage in banks and the decline in global (as well
Weighted by bank RWA 14 as domestic) lending. Any such reduction in
international lending could be proportionally larger
13
than for domestic lending if the risk-weightings on
12 international lending were greater. Figure 15 shows
11 the average minimum capital requirements for UK
banks since 2000, and the sharp tightening that has
10
occurred since the crisis. This tightening is typical in
9 many economies as they seek to strengthen their
8 banking systems and prepare for the implementation
2000 2003 2006 2009 2012 of the global Basel III requirements. Research
Note: RWA stands for risk-w eighted assets.
shows that increases in these types of capital
Source: Bank of England
requirements lead to a decline in bank lending, at
least in the short run, and some (but not all) work
suggests that the resulting decline in international
lending is greater than for domestic lending.22
Increased regulations that reduce bank
flows today but ensure a more robust financial system, however, could better support higher levels of
financial globalization in the future.23
Some – or all – of these factors have undoubtedly contributed to the recent deglobalization in banking.
There may also be other influences that are not on the list. But one key question remains. What are the
implications of this deglobalization in banking for the United Kingdom and monetary policy?
Implications for the United Kingdom and monetary policy
There has been an extensive debate on the benefits and costs of financial globalization. During the 1990’s
and 2000’s, much of this discussion focused on its potential benefits – especially for these advanced
economies with stronger institutions and financial systems. For example, financial globalization could make
it easier for firms and countries to access financing for productive investment. It would allow capital to flow
22
For example, see Aiyar et al. (2014a,b) and Cerutti, Claessens, and Ratnovski (2014). Aiyar, Calomiris, and Wieladek (2014b)
examine data from 1998-2007 and find that bank lending growth falls by about 5.7% within a year following a 100 basis point rise in
bank-specific capital requirements; while Bridges et al. (2014) find a decline in lending of about 2.7%. In a separate contribution,
Aiyar, Calomiris, Hooley, Korniyenko and Wieladek (2014a) find that cross-border bank lending declines by about 5.4% following a
100 bps rise in capital requirements over the same time period. Preliminary work by Wiedelak (2014) finds a significant reduction in
bank lending after increased capital requirements in the UK, but no significant difference in the effects on international relative to
domestic lending.
23
Consistent with this view, Governor Mark Carney noted in a speech yesterday that “where banking systems have raised capital and
restored trust in their creditworthiness, access to credit has returned”. See speech, “The Future of Financial Reform”, given on
17 November 2014.
16
All speeches are available online at www.bankofengland.co.uk/publications/Pages/speeches/default.aspx 16freely to its most productive uses and improve risk diversification, therefore generating higher returns. It
could improve “market discipline”, as investors rewarded countries for sound policies and pressured those
without.
More recent discussion, however, has shifted to more vocal concerns about “Globalization and its
Discontents” (to cite a popular book by Joseph Stiglitz). For example, financial globalization can make
countries more vulnerable to contagion and events that occur outside their borders. The “surges” of financial
inflows can feed inefficient credit booms, asset price bubbles, and overvalued exchanges rates, while the
“stops” of financial flows can feed currency collapses and banking crises. Most recently, increased attention
has been paid to whether financial globalization can foster inequality or complicate the ability of a country to
run an independent monetary policy to support its domestic economy.24
Given the scope and complexity of this debate on the costs and benefits of financial globalization, I will not
make any attempt to address all of these issues. Instead, in the remainder of my comments, I will focus on
one specific angle of this debate: what are the implications for the United Kingdom and the Monetary Policy
Committee of a less globalized banking system? The implications are wide-ranging, and I will focus on nine
– although there are certainly more.
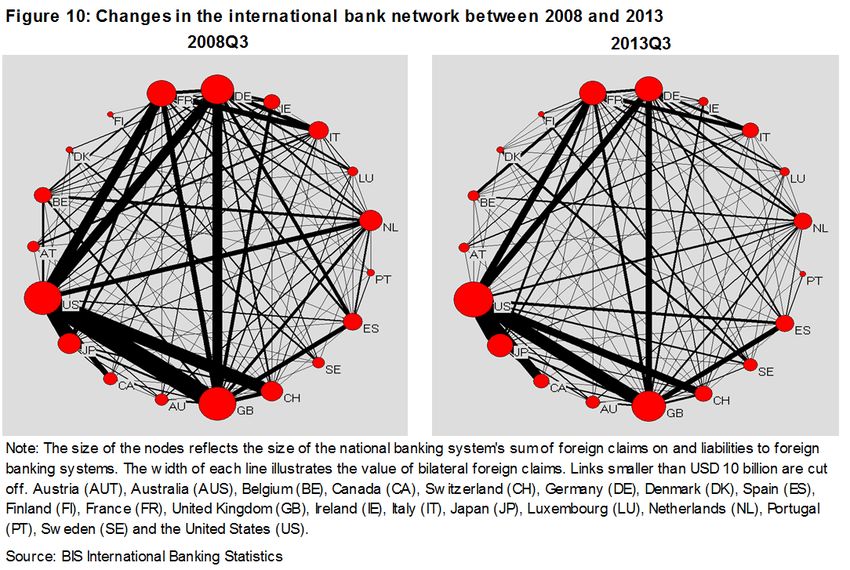
First, if certain sectors of the economy (such as
businesses or SMEs) were more reliant on foreign
banks for funding, these groups may have more
difficulty obtaining access to credit in the future.25
Figure 16 shows that bank lending to the UK private
sector by foreign banks made cross border and from
their local branches fell sharply during the financial
crisis. Hoggarth, et al. (2013) show that foreign
branches can be important sources of credit for UK
companies. Small- and medium-sized enterprises
are also more reliant on banks for funding than
larger companies, so they could be most vulnerable
to a decline in aggregate bank lending. It is difficult
to know if they would have greater difficulty
accessing credit in the future, however, if UK banks
simultaneously reduce lending abroad, thereby
increasing their pool of funds available for domestic
24
For example, see Rey (2013), which argues that monetary policy is less effective in more financially integrated economies.
25
Ongena, Peydro, and van Horen (2013) show that when foreign banks reduced their local lending during the crisis, this affected local
firms and especially small ones and those with limited tangible assets. This study draws on a diverse set of countries, however, many of
which have less developed domestic financial systems, so it is unclear if this result applies to the UK.
17
All speeches are available online at www.bankofengland.co.uk/publications/Pages/speeches/default.aspx 17lending and counteracting the reduction in lending by foreign banks within the UK. Closely related, an
inefficient allocation of credit has been proposed as one possible factor behind low productivity growth in the
UK since the crisis,26 and reduced banking flows may have played some role. Recent reforms to strengthen
the overall banking system, plus specific programs designed to improve the access to credit for groups that
could be most vulnerable (such as the Funding for Lending Scheme) could help ameliorate any of these
risks.
Second, a reduction in cross-border flows and transactions should lead to simpler and more transparent
global banking institutions. Figure 6 documented that the rapid growth in international banking corresponded
to a largely simultaneous increase in flows into and out of banking systems. Many of these flows did not
represent bank’s traditional role of lending to non-financial corporations financed by deposits. Instead, a
portion of this increase in international bank activity corresponded largely to banks acting as intermediaries in
a range of complex transactions that involved taking on liquidity, duration, and currency risk, as well as
counterparty risk. This led to an extremely complex, leveraged, and untransparent financial system, making it
difficult to assess the underlying risks and understand how problems in one institution could affect others and
the broader economy. The recent deleveraging and simplification of international banking should make it
easier to understand inherent risks and exposures in the future, supporting efforts to avoid “too big to fail”
situations in major financial institutions in the future.27
Third, and closely related, reduced activity by global banks, and especially this simplification in their
international transactions, could reduce liquidity in different markets and therefore increase volatilities and
the risk of sharp and disorderly price swings. International banks traditionally played an important role as
counterparties and market-makers for a range of transactions. As they play a less active role matching
buyers and sellers today, some risks from market illiquidity may have increased (despite the large amounts
of liquidity provided by central banks as part of their asset-purchase programs).28 This decreased role of
banks in stabilizing markets may have played a role in the market turbulence in October, and is frequently
raised in discussions of the stability of funding for emerging markets. On the other hand, much of banks’
cross-border intermediation of funds before the crisis may have been related to high levels of leverage, and
reducing this leverage may reduce volatility and the risk of sharp price swings.
Fourth, a less globalized banking system could increase the cyclicality of domestic credit to domestic shocks.
As UK banks lend less abroad, and foreign banks lend less in the UK, the total UK credit supply will be more
tightly linked to the domestic supply of credit and business cycle. This stronger home bias will increase the
sensitivity of credit and lending to domestic shocks and changes in domestic banks. In other words, in a less
globalized banking system, international banks will be less likely to access external funding sources to
26
See Barnett et al. (2014) for a discussion of the UK productivity puzzle.
27
For further discussion, see Governor Carney’s speech, “The Future of Financial Reform”, given on 17 November 2014.
28
For further discussion, see Gillian Tett, Financial Times, “Markets are Parched for Liquidity Despite a Flood of Cash”, Oct 17, 2014.
18
All speeches are available online at www.bankofengland.co.uk/publications/Pages/speeches/default.aspx 18smooth any fluctuations in UK credit.29 Since banks are simultaneously reducing their leverage and
strengthening balance sheets in other ways, however, this increased resilience of banks overall could
mitigate their vulnerability to domestic cyclical effects – especially if combined with measures such as
counter-cyclical capital buffers.
Fifth, and closely related, although a deglobalized banking system may increase the correlation between
domestic lending and domestic shocks, it could simultaneously reduce the correlation with foreign shocks.30
There is a long literature showing how negative events in one country can cause banks in that country to
withdraw lending to other countries, possibly causing a contraction in credit in the country that was not
directly affected by the initial event.31 Research shows that more leveraged banking systems are particularly
vulnerable to “contagion” and any negative shocks that originate abroad.32 If two countries had highly
synchronized business cycles or similar vulnerabilities to common shocks, then this benefit of reducing the
amplification of foreign shocks could be even greater. The reduction in cross-border exposure, especially
when combined with the lower levels of leverage and stronger balance sheets, should substantially increase
the resilience of UK banks to foreign shocks.
Sixth, as international banks in advanced economies such as the UK reduce their foreign exposure, this
could facilitate the expansion of international banking in less represented countries. Before the crisis,
advanced economies were responsible for the bulk of international bank flows – far more than would be
expected based purely on the size of their economies. Figure 11 shows that even though most advanced
economies have seen a significant reduction in their international banking assets and liabilities, banks in
other countries have been partially filling this gap – especially in Japan, but also in several emerging
markets.33 In some cases, emerging-market banks have even been buying assets from advanced-economy
banks as they reduce their foreign exposures. Figure 17 shows that this increase in cross-border banking
exposure for emerging markets and other advanced economies that did not have banking crises has been
fairly small to date, in comparison to the overall contraction in the global banking network. (Data for China is
not available, however, and anecdotal reports indicate that Chinese banking institutions have been
increasing their international exposure over this period). If these trends continue, however, this could be the
start of a larger shift in which the UK plays a less important role, and emerging markets and other advanced
economies a more important role, in the international banking network.
29
See Reinhardt and Riddiough (2014) and Cetorelli and Goldberg (2012b) for a discussion of how these internal fund transfers in
international bank groups functioned during the crisis. See Hoggarth et al. (2013) for evidence that foreign banks tend to be less
pro-cyclical in their lending.
30
Cesa-Bianchi, Imbs, Saleheen (2014) show that increased banking integration may lead to higher business cycle synchronization.
31
Peek and Rosengreen (1997) showed the earliest evidence of these effects, using the experience of Japanese banks. Cetorelli and
Goldberg (2012a) and Giannetti and Laeven (2012) provide more recent evidence on the strength of these effects.
32
For evidence, see Forbes (2013).
33
For additional evidence, see see Claessens and Van Horen (2014).
19
All speeches are available online at www.bankofengland.co.uk/publications/Pages/speeches/default.aspx 19Figure 17: Cross-Border Banking after the Collapse of Lehman Figure 18: UK banking and shadow bank(a) assets
Brothers, 2008 Q4 vs. 2013Q4 as % of GDP
% of UK GDP
2
Bank assets
1200
0
Shadow bank assets
1000
-2
%
800
-4
600
-6
400
-8
_
AEs with systemic banking crisis - Assets Liabilities 200
AEs without systemic banking crisis - Assets Liabilities
EMEs - Assets Liabilities
0
Note: The figure shows the cumulative change in cross-border bank assets and 2002 2004 2006 2008 2010 2012
liabilities of BIS reporting countries vis-à-vis foreign bank and non-bank sectors Source: Bank of England, ONS.
following the collapse of Lehman Brothers in 2008Q3. The change is measured as
(a) This chart show s a broad measure of shadow banking
the sum of exchange-rate-adjusted changes in assets or liabilities between
w hich includes all assets of other financial intermediaries and is
2008Q4 and 2013Q4 relative to world GDP at 2008Q3. We classify countries as
likely to significantly overestimate the true size of the UK shadow
having suffered a systemic banking crisis or not, using the database compiled by
banking sector.
Laeven and Valencia (2013).
Seventh, another response to any funding shortfall created by reduced banking flows could be to encourage
the development of alternative financing sources – such as through what has been called the “shadow
banking system” (i.e. asset-backed securities, money-market funds, hedge funds, amongst others). The IMF
has recently discussed how increased banking regulations which reduce global bank flows could support the
growth of shadow banking.34 The FSB recently reported that shadow banking assets rose to a record
$75 trillion last year, equivalent to about half of the global banking system. There is also some evidence,
such as shown in Figure 18, that lending by shadow banks in the UK has increased moderately as lending
by traditional banks has declined. Shadow banking can play a beneficial role as a complement to traditional
banking by improving access to credit, market liquidity, and risk sharing. But shadow banking can also
involve risks – especially if the corresponding institutions are not regulated and present systemic
vulnerabilities. Central banks and international institutions are aware of these potential benefits and risks.35
Eighth, a reduction in international bank flows could make it more difficult, and possibly even more
expensive, for the UK to fund its current account deficit. Figure 19 shows that the UK current account deficit
(the black line) has recently been increasing. The latest data indicate that it was 5.2% of GDP in 2014 Q2
(on an annualized basis) – only slightly lower than the record of 5.6% it reached in 2013 Q3. It is also
unlikely that this deficit will fall in the near future given the strength of demand in the UK relative to that in its
major trading partners. This deficit must be funded through some type of capital flows from abroad. The
coloured bars in Figure 19 show how the current account deficit has been funded in the past – broken into
banking (and other) flows, portfolio flows, and FDI – with a negative value indicating a net positive
contribution to this funding gap. Net international bank flows have been an important source of funding since
34
International Monetary Fund (2014b).
35
For example, the BoE and ECB have recently launched an initiative to make securitisation markets in the EU safer and more
integrated. See Bank of England and European Central Bank (2014) for further detail.
20
All speeches are available online at www.bankofengland.co.uk/publications/Pages/speeches/default.aspx 20You can also read