A catchment balance assessment of an abrupt shift in evapotranspiration at the Hubbard Brook Experimental Forest, New Hampshire, USA - USDA Forest ...
←
→
Page content transcription
If your browser does not render page correctly, please read the page content below
Received: 1 October 2020       Revised: 2 June 2021      Accepted: 24 June 2021
DOI: 10.1002/hyp.14300

RESEARCH AND OBSERVATORY CATCHMENTS: THE
LEGACY AND THE FUTURE

A catchment balance assessment of an abrupt shift in
evapotranspiration at the Hubbard Brook Experimental Forest,
New Hampshire, USA

Mark B. Green1,2                       | Scott W. Bailey2                  | John L. Campbell2                           |
Kevin J. McGuire3                  |    Amey S. Bailey2              |   Timothy J. Fahey4 |                      Nina Lany2               |
David Zietlow2

1
  Department of Earth, Environmental, and
Planetary Sciences, Case Western Reserve              Abstract
University, Cleveland, Ohio                           Small catchments have served as sentinels of forest ecosystem responses to changes in
2
 Northern Research Station, US Department
                                                      air quality and climate. The Hubbard Brook Experimental Forest in New Hampshire has
of Agriculture Forest Service, North
Woodstock, New Hampshire                              been tracking catchment water budgets and their controls – meteorology and vegeta-
3
 Department of Forest Resources and                   tion – since 1956. Water budgets in four reference catchments indicated an approxi-
Environmental Conservation and Virginia
Water Resources Research Center, Virginia             mately 30% increase in the evapotranspiration (ET) as estimated by the difference
Polytechnic Institute and State University,           between precipitation (P) and runoff (RO) starting in 2010 and continuing through
Blacksburg, Virginia
4
                                                      2019. We analyzed the annual water budgets, cumulative deviations of the daily P, RO
 Department of Natural Resources & the
Environment, Cornell University, Ithaca,              and water budget residual (WBR = P  RO), potential ET (PET) and indicators of sub-
New York
                                                      surface storage to gain greater insight into this shift in the water budgets. The PET and
Correspondence                                        the subsurface storage indicators suggest that this change in WBR was primarily due
Mark B. Green, Department of Earth,
                                                      to increasing ET. While multiple long-term hydrological and micrometeorological data
Environmental, and Planetary Sciences, Case
Western Reserve University, Cleveland, OH,            sets were used to detect and investigate this change in ET, additional measurements of
USA.
                                                      groundwater storage and soil moisture would enable better estimation of ET within the
Email: mbg78@case.edu
                                                      catchment water balance. Increasing the breadth of long-term measurements across
Funding information
                                                      small gauged catchments allows them to serve as more effective sentinels of substan-
USDA Forest Service, Northern Research
Station, Madison, WI, Grant/Award Numbers:            tial hydrologic changes like the ET increase that we observed.
1114804, 1014507

1    |    I N T RO DU CT I O N                                                    hydrologic       cycle   intensifies       due   to   climate   change   (Creed
                                                                                  et al., 2014).
Small, gauged catchments are useful for evaluating impacts of                          Climate change is altering precipitation patterns (O'Gorman &
changing environmental conditions on ecosystem functioning. Their                 Schneider, 2009; Trenberth, 2011; Huang et al., 2017), snowpacks
size (typically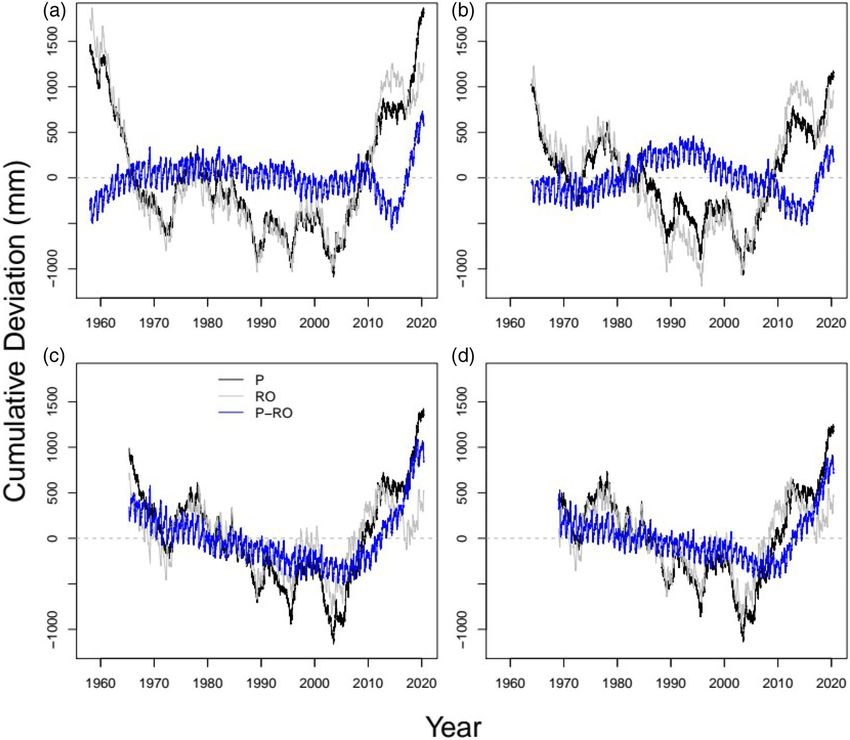
2 of 15                                                                                                                               GREEN ET AL.

hydrological processes and their drivers as they change is important      environmental changes, not those due to experimental manipulation.
to improving hydrologic models used to forecast the implications of       These catchments drain forested mountainsides, ranging in elevation
climate change on water resources.                                        from 530 to 905 m. Their areas range from 13.2 at W6 to 77.4 ha at
      At the Hubbard Brook Experimental Forest (HBEF) in New Hamp-        W7 while average slopes range from 16 to 17 degrees. Bedrock is a
shire, USA, the hydrology and meteorology of small, forested catch-       slowly weathering high-grade crystalline schist, quartzite and calc-
ments have been monitored since 1955. Early catchment studies at          silicate granulite of the Silurian Rangeley Formation (Burton et al.,
the HBEF utilized a paired catchment approach to evaluate experi-         2002). Soils at the HBEF are mostly Spodosols, developed in glacial till
mental manipulations designed to identify how forests and their man-      and reworked till and glaciofluvial deposits of sandy loam to loamy
agement regulates the quantity and quality of water supplies              sand textures. Glacial drift is thin and interspersed with exposed bed-
(Hornbeck et al., 1997). Continuous, long-term monitoring of the          rock along ridgelines and portions of the stream network; thickness
hydrologic cycle has produced insights into how climate change has        ranges up to 10 m. Spatial variation in soil development reflects the
altered snow hydrology (Campbell et al., 2010), evapotranspiration        subsurface hydrology (Bailey et al., 2014). Generally, the less weath-
(Vadeboncoeur et al., 2018) and stream flow (Campbell et al., 2011).      ered C horizon starts at about 0.7 m, with few roots penetrating the
Shorter-term studies addressing stream source water tracing               upper portion of the C horizon. The climate at the HBEF is humid
(Benettin et al., 2015; Fuss et al., 2016; Hogan & Blum, 2003;            temperate with a mean annual temperature of 5.5 C and monthly
Hooper & Shoemaker, 1986), groundwater controls on streamflow             averages ranging from 9 to 19 C (Bailey et al., 2003; Campbell
generation (Detty & McGuire, 2010; Gannon et al., 2014), soil hydrol-     et al., 2021).
ogy (Gannon et al., 2017; Germann et al., 1986), water vapour dynam-          The forest biomass is dominated by the northern hardwood spe-
ics (Green et al., 2015), evapotranspiration impact on streamflow         cies sugar maple (Acer saccharum Marshall), yellow birch (Betua
recession (Federer, 1973) and stream network expansion/contraction        alleghaniensis Britton) and American beech (Fagus grandifolia Ehrh.) on
(Jensen et al., 2017) have led to a rich understanding of the hydrology   deeper and better drained soils, with red spruce (Picea rubens Sarg.),
of the HBEF catchments, making them effective sentinels of a chang-       balsam fir (Abies balsamea Mill.) and eastern hemlock (Tsuga canadensis
ing environment.                                                          (L.) Carrière) on shallow and wetter soils (Siccama et al., 2007). The
      This study documents recent changes in the water balance at the     HBEF was selectively harvested from the 1880s to 1910s, primarily
HBEF. Analysis of associated datasets suggest that an increase in         for spruce by loggers using axes and horses. In 1920, the land was
evapotranspiration (ET) caused this response.                             transferred to the White Mountain National Forest, with designation
                                                                          of the experimental forest in 1955. The reference catchments have
                                                                          not been actively managed, but have been affected by atmospheric
2     |       METHODS                                                     deposition and periodic natural disturbances (e.g., wind, ice and snow
                                                                          storms, insect defoliations). A complete forest inventory performed in
2.1       |    Site                                                       1965, 1977 and every 5 years thereafter, shows that forest biomass
                                                                          accumulated at W6 until about 1983, and has remained at near steady
The HBEF is located in the White Mountain National Forest in central      state since then (Battles et al., 2014). The other reference catchments
New Hampshire, USA (43 560 N, 71 450 W; Figure 1). Four HBEF ref-       have limited vegetation monitoring, but are part of a larger valley-
erence catchments with at least 40 years of hydrometeorological data      wide forest monitoring programme sampled decadally. Sampling from
are the focus of this analysis; two south-facing (W3 and W6) and two      1995–2005 showed that overall biomass was at steady state at the
north-facing (W7 and W8). We focused on the reference catchments          valley-wide scale while there was a small increase in red spruce, and a
because our interest was in how water budgets responded to ambient        decrease in birch species (van Doorn et al., 2011).

                                                                                                      F I G U R E 1 Map of the Hubbard
                                                                                                      Brook Experimental Forest
GREEN ET AL.                                                                                                                                  3 of 15

2.2     |      Data                                                        every 10 min. The network was established in 2006 with 31 wells and
                                                                           there are currently over 100 wells; however, only a small portion of
Precipitation and stream discharge have been measured at the HBEF          the network collected data at any given time (McGuire et al., 2019).
reference catchments considered in the present study starting in the
mid-1950s to late-1960s (Campbell et al., 2021). Precipitation (P) was
estimated at the catchment-scale by spatial interpolation of measure-      2.3     |       Data analysis
ments from multiple rain gauges (Green et al., 2018; USDA Forest Ser-
vice, 2020a). Gauge sites were initially instrumented with standard        2.3.1       |    Annual water budgets
cumulative rain gauges that were shielded (Alter type), located in
maintained forest openings and measured weekly (Leonard &                  We calculated catchment water budgets on a daily and June 1 water-
Reinhart, 1963). A subset of sites also included a Belfort weighing rain   year basis. The water budget was formulated as:
gauge used to distribute weekly precipitation into individual days
(Federer, 1990; Green et al., 2018; Leonard & Reinhart, 1963). Since                         P  RO ¼ WBR ¼ ET þ ΔSWE þ ΔSS þ L,                 ð1Þ
June 2016, 15-minute precipitation has been measured with a
shielded (Alter type) ETI NOAH IV digital weighing rain gauge,             where P is precipitation, RO is runoff, WBR is the water budget resid-
summed for each day. Stream stage was measured continuously at a           ual, ET is evapotranspiration, ΔSWE is change in snowpack, ΔSS is
v-notch weir, and W6, W7 and W8 have an additional flume installed         change in subsurface storage (soil water and groundwater) and L
for measuring high flows. Stage was converted to discharge (Q) using       is loss to deep seepage, all terms in the units of mm of water per time.
theoretical    stage-discharge relationships   (Bailey et al., 2003;       By choosing a water year that starts in the spring (i.e., June 1), typical
Reinhart & Pierce, 1964; See et al., 2020) and the daily runoff            for eastern US catchment studies (Kelly et al., 2016; Likens, 2013;
(RO) was estimated by summing the Q measurements and dividing by           Lynch & Corbett, 1990; Patric & Reinhart, 1971), ΔSWE = 0 between
the catchment area (USDA Forest Service, 2020a, 2020b).                    years. Water loss to deep seepage or leakage is negligible, which is
      Micrometeorological measurements from a long-term weather            supported by a comparison of 32 small research catchments which
station at the HBEF headquarters were used to estimate potential ET        showed that the HBEF had amongst the lowest estimates of deep
(PET) from 1989 to 2020. Mean daily values were calculated from            seepage (Verry, 2003). The water budget was estimated for each
hourly measurements. Air temperature (Ta) and relative humidity            catchment individually and a combined water budget for all four
(RH) were measured with a Campbell Scientific Inc. 201 Ta and RH           catchments was calculated by area-weighting P, RO and WBR. We
sensor housed in a Gill radiation shield. Wind speed was measured          also estimated the water balance using a 7-year moving window to
with a Met One 3-cup anemometer from 1981 to 2003, and then with           minimize any interannual ΔSS. The 7-year period was chosen based
an RM Young model 05103 anemometer from 2003 to 2020. Solar                on the climate and vegetation characteristics at the HBEF compared
radiation (Rs) was measured with a LiCor pyranometer from 1981 to          to the suggested optimal integration window suggested by Han
2018, and with an Apogee pyranometer from 2018 to 2020. Solar              et al. (2020). Since ET and ΔSS are not directly measured in our catch-
radiation was converted to total available energy as net radiation (Rn)    ments, we analyzed other variables to gain insight into the contribu-
minus ground heat flux (G) by establishing a linear relationship           tion of each to changes in the WBR.
between Rs and Rn  G measured at a flux tower located within the
HBEF (AmeriFlux site HBK; Kelsey et al., 2019). The Rn was measured
with a Kipp and Zonen net radiometer from 2016 to 2020. Ground             2.3.2       |    Cumulative water budgets
heat flux was measured with four Huske Flux soil heat flux plates
which were averaged to provide daily values. The relationship              We explored the dynamics of the sub-annual water balance and
between Rs and Rn  G was established on a monthly basis and               longer-term variation using a cumulative deviation analysis. The tech-
applied to the entire Rs record (Supplemental methods).                    nique provided a continuous picture of the water budget and its devi-
      We used two recent data sets that measured aspects of subsur-        ations from its typical status. Cumulative sum analyzes are effective at
face water storage. Soil water volumetric content was measured from        identifying abrupt changes in time series (Hawkins & Olwell, 2012;
2011 to 2017 with Decagon 5TM combination temperature and volu-            Hinkley, 1971) and have been used in the classical mass curve
metric water content probes, logged hourly at 14 sites along elevation     approach to assess the quality of hydrological monitoring (Searcy &
gradients on the south- and north-facing slopes (Groffman, 2019; Wil-      Hardison, 1960) and water resources analysis such as reservoir opera-
son et al., 2020). The probes were installed in the top 5–10 cm of soil    tions (Klemeš, 1979). Cumulative sum techniques have been useful in
and thus mostly indicated moisture in the organic and uppermost min-       identifying inflection points in water quality time series (Briceño
eral horizons. Shallow groundwater levels were measured with a net-        et al., 2014; Cluis, 1983; Regier et al., 2019) and analyzing hydrologic
work of wells that were installed across W3 and screened near the          system responses to land cover and climate change (Nijzink
soil C horizon or at bedrock in shallow soils if no C horizon was pre-     et al., 2016; Smail et al., 2019).
sent (Detty & McGuire, 2010; Gannon et al., 2014). Data were                     The water budget variables analyzed were P, RO and WBR. For
recorded with Odyssey Water Level Loggers or Hobo Level Loggers            each variable, the cumulative sum was calculated over the full time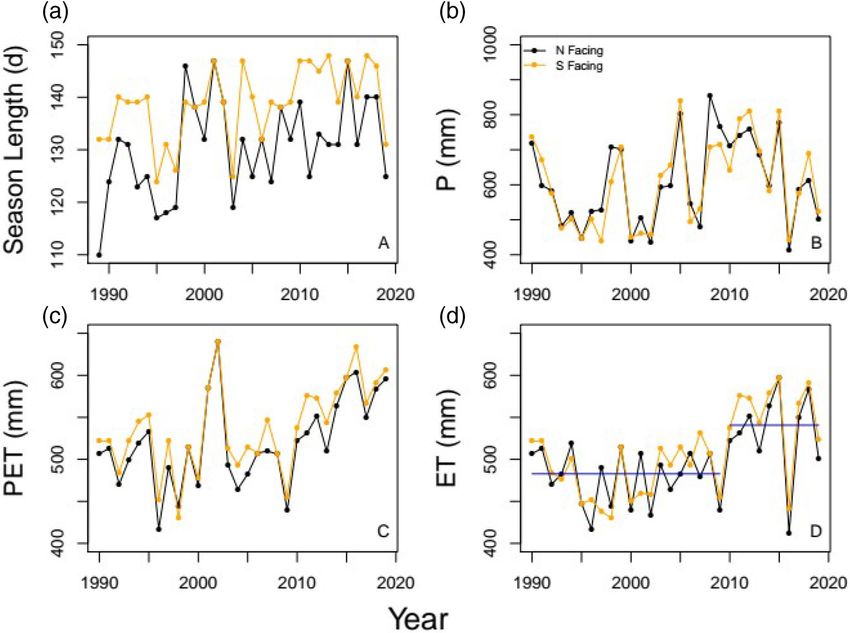
4 of 15                                                                                                                                GREEN ET AL.

series on a daily time step. An ordinary least squares regression line     2.3.4         |    Subsurface storage
was fit to the time series; the slope of the model was taken as the
long-term central tendency. The residuals, then, were visualized and       The difference in year-to-year subsurface storage contributes to the
analyzed to assess inflection points and multi-year deviations from        WBR, but is difficult to assess at the catchment scale. We used mea-
the long-term central tendency.                                            surements of low stream flows, soil moisture and shallow groundwa-
                                                                           ter as indices to suggest possible ΔSS. Annual low stream flows were
                                                                           used as an indicator of the catchment water storage trend
2.3.3      |     Potential evapotranspiration                              (e.g., Brutsaert, 2008; McNamara et al., 2011). We calculated the 5th
                                                                           percentile specific discharge from the 5-minute discharge data to pro-
PET was calculated to assess a major driver of the ET at the HBEF          vide an indicator of catchment storage per water year. This simple
since it is considered an energy limited ecosystem (Creed et al., 2014).   approach was chosen over the storage-discharge relationship which
Daily PET was estimated with the Penman-Monteith method (Allen             relies on specific conditions to assess stream recession characteristics
et al., 1998):                                                             (Brutsaert, 2008). Year-to-year difference in shallow soil moisture for
                                                                           the Hubbard Brook basin was estimated by normalizing the moisture
                             ΔðRn  GÞ þ ρa cp ðes e aÞ
                                                                           at each of the 14 sites by its post-snowmelt value, which is assumed
                      ET ¼                     ra
                                                           ,        ð2Þ
                                λ Δ þ γ 1 þ rrac                           to be approximately the field capacity (Wilson et al., 2020). The mean
                                                                           normalized soil moisture per water year was calculated from the
where ET is in mm/day, Δ is the slope of the saturated vapour pres-        hourly data from all sites.
                                                                     2
sure versus temperature curve (kPa/C), Rn is net radiation (MJ/m /               We calculated the year-to-year difference in water table height in
day), G is ground heat flux (MJ/m2/day), ρa is the density of air          shallow wells by isolating the May and June water table measure-
(kg/m3), cp is the heat capacity of air (MJ/kg C), es is the saturated     ments per year and describing the central tendency and spread of the
vapour pressure (kPa), ea is the actual vapour pressure (kPa), ra is the   water table during that period each year. We further estimated
aerodynamic resistance (d/m), rc is the canopy resistance (d/m), γ is      the amount of ΔSS that could arise from the interannual water table
the psychrometric constant (kPa/C) and λ is the latent heat of             change in the shallow groundwater zone by multiplying the change in
vapourization (MJ/kg). The es, Δ, γ and ra were estimated using stan-      median water table height by an assumed specific yield of
dard methods (Allen et al., 1998). We assumed air pressure to be con-      0.35 mm/mm.
stantly 95 kPa since we do not have long-term air pressure                       Total storage deviation for the area covering the HBEF was also
measurements. The rc was estimated on a monthly basis by rear-             evaluated using remotely sensed data from the Gravity Recovery and
ranging Equation 2 for rc and calculating it with measurements from        Climate Experiment (GRACE) mission (Landerer et al., 2020). We used
the flux tower (Xu et al., 2020, Figure S1). The monthly rc was scaled     the Mass Concentration blocks produced by the NASA Jet Propulsion
by the annual leaf area index (LAI) by multiplying annual normalized       Laboratory to visualize monthly storage deviations from the 2004 to
LAI by the rc values within that year. Annual LAI of the forest immedi-    2009 mean.
ately west of W6 was measured by collecting leaf litter with a net-
work of 51 collectors positioned randomly in four plots along the
elevation gradient (Fahey & Cleavitt, 2021). Leaf litter was sorted and    3     |       RE SU LT S
tallied by species and leaf numbers multiplied by average area per leaf
to estimate LAI. The LAI was normalized by dividing the annual values      3.1       |       Annual water budgets
by the long-term median. The LAI data were collected from 1993 to
2017; thus, the long-term median was used for the years 1989–1992          The annual water budgets showed consistently higher P from water
and 2018–2019 in order to match the length of the micrometeorology         year 2003 to 2019 (Figure 2). For the area-weighted average P of all
record. The presence of a trend in LAI was assessed using the Ken-         four catchments (1970–2019), only four of the sixteen years in the
dall (1938) correlation and the linear slope of the trend was quantified   2003–2019 period had lower annual P than the long-term mean of
with the Sen (1968) estimator.                                             1488 mm/year: 1432 mm/year in 2004, 1481 mm/year in 2012,
    Growing season ET was modelled by comparing the summed PET             1450 mm/year in 2013 and 1392 mm/year in 2014. The mean annual
and P during the period when the forest canopy was fully intact. If        P prior to 2003 was 1428 mm/year and after 2003 it was 1606 mm/
growing season P was greater than PET, the ET estimate was equal to        year. Annual RO followed a similar pattern as P, except a step increase
P. Otherwise, the growing season ET estimate was equal to the PET.         was not apparent (Figure 2(b),(e)). The water years 2003–2011 were a
This simple model was consistent with the suggestion from Kirchner         contiguous period of higher than normal RO, but the years after 2011
and Allen (2020) that most of the P during the growing season at the       were closer to the long-term mean. The WBR deviated starting in the
HBEF becomes ET. The canopy was considered leafed-out when the             late 2000s (Figure 2(c),(f)). Catchments on the north-facing slope
phenological state, which was assessed weekly and interpolated to          (W7 and W8) showed increases starting in approximately 2010. The
daily values, was at 3 or higher on a 0–4 scale where 4 is the peak        WBR trends on the south facing catchments were more complicated,
growing season canopy (Richardson et al., 2006). Generally, the can-       with notable drops from 2009 to 2013 in W3 and a 2009 drop in W6.
opy leafed-out from June to September.                                     After these drops, the WBR increased in recent years (2015–2019).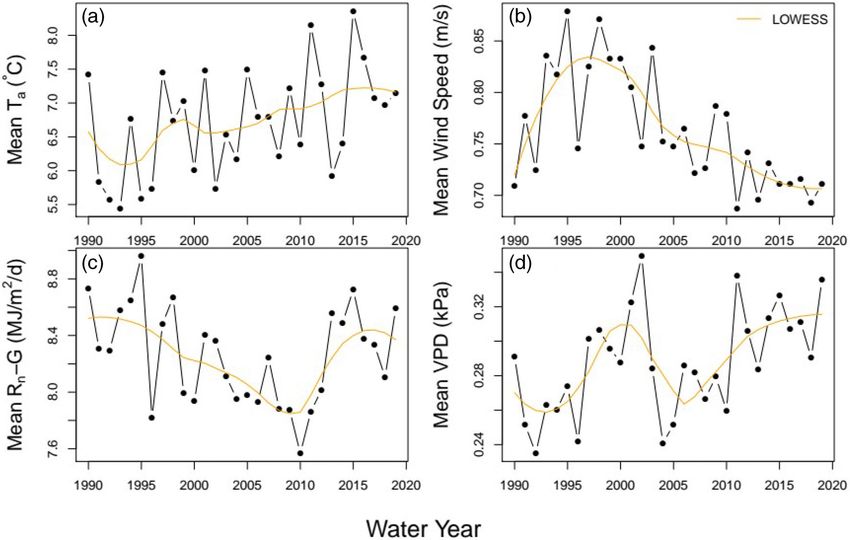
GREEN ET AL. 5 of 15
F I G U R E 2 Annual precipitation (a), runoff (b), and water balance residual (c) in W3, W6, W7, and W8 over their measured record, including
the area-weighted flux. Also shown is the seven-year average annual precipitation (d), runoff (e), and water balance residual (f)
T A B L E 1 Slopes of the single mass curve for precipitation (P), runoff (RO), and the water balance residual (WBR) across the reference
catchments at Hubbard Brook
Catchment Period of record Slope P (mm/year) Slope RO (mm/year) Slope WBR (mm/year)
W3 1958–2019 1367 880 487
W6 1964–2019 1449 947 512
W7 1965–2019 1493 977 517
W8 1969–2019 1494 954 540
Note: The slopes are for the entire record for each catchment, which varies across catchments. Thus, differences between catchments are due to site
differences and the time period that their record covers.
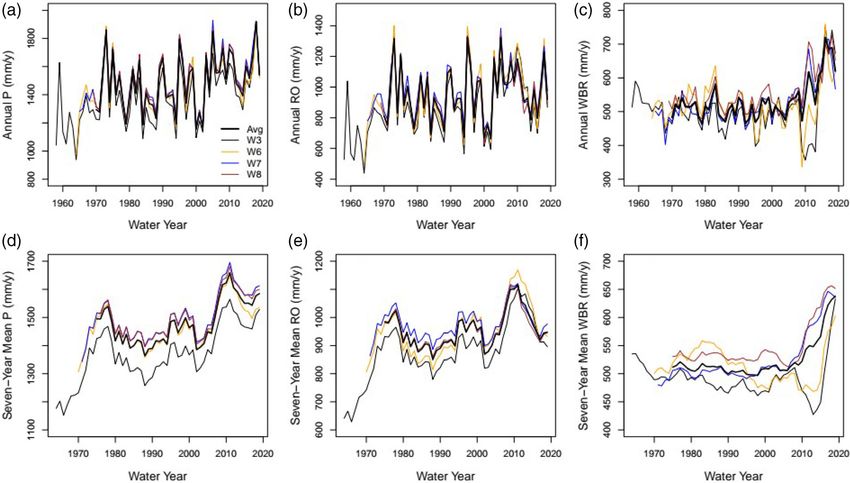
Across all four catchments, the mean annual WBR prior to 2000 was Cumulative deviations in the four catchments showed clearer
509 mm/year and increased to 667 mm/year from 2015 to 2019. The hydrologic changes than the annual sums. Precipitation and RO gener-
seven-year moving window water budgets showed a pattern that was ally followed similar patterns across the four catchments, with appar-
similar to the annual water budgets. The WBR dip in the 2008–2013 ent drying from the beginning of the record until February 1972,
period in the south-facing catchments was more visible with the inter- followed by transitions from drying to wetting occurring in March
annual variation smoothed out (Figure 2(f)). 1989, July 1995 and July 2003 (Figure 3). All four catchments
received 2000–2700 mm of additional P between July 2003 and June
2020 with a pause in wetting between November 2012 and October
3.2 | Cumulative water budget deviations 2016. Runoff deviations tracked P for most of the record in all four
catchments, except since November 2012, when RO increased rela-
The slopes of the cumulative summed P, RO and WBR approximated tive to P in W3 and W6, and decreased relative to P in W7 and W8.
the long-term central tendency for each and are shown in Table 1. The cumulative deviation of the WBR varied more across catch-
Amongst the four catchments, precipitation ranged from 1367 to ments than P and RO, except the 2015–2020 period showed an
1494 mm/year, RO ranged from 880 to 977 mm/year and the WBR abrupt increase in all four. The W3 cumulative WBR deviation was
ranged from 487 to 540 mm/year. relatively stable until an approximately 500 mm decrease between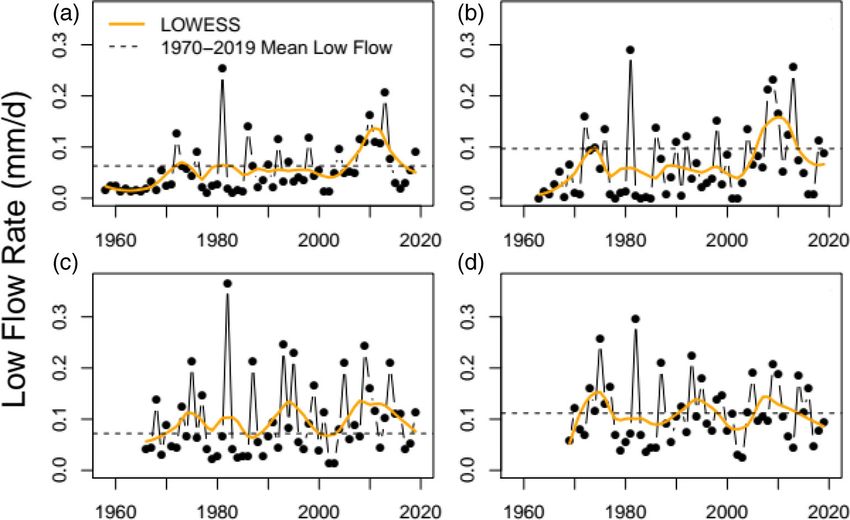
6 of 15                                                                                                                                GREEN ET AL.

F I G U R E 3 Cumulative deviations of precipitation (P), runoff (RO), and the water budget residual (P-RO) across the measured record at
(a) W3, (b) W6, (c) W7, and (d) W8. The dashed reference line at 0 indicates the long-term central tendency, reported in Table 1

2009 and 2014 which reversed direction as a 1000 mm increase that         2019 with a notable low period from 2003 to 2010. Leaf area index
continued through May 2020 (Figure 3(a)). The W6 cumulative WBR           showed the disturbance and recovery from the 1998 ice storm
deviation was stable from 1963 before increasing from 1975 to 1992        (Rhoads et al., 2002), followed by a subtle increase from 2000 to
followed by a long-term decrease until 2015 when it reversed              2017 (Kendall τ = 0.31, p = 0.08, Sen slope = 0.044 per year),
upwards by about 800 mm (Figure 3(b)). Both W7 and W8 showed              although the LAI at the end of the time series was similar to the pre-
around 600–800 mm decreases in the cumulative WBR deviation               ice storm LAI (Figure 5). The result of this trend was a 0.74 increase in
from the beginning of their record until around 2008–2010 and then        LAI from 2000 to 2017. Mean annual PET was 771 mm/year, varying
reversed for a 1200–1500 mm increase from 2010 to 2020.                   interannually around the mean from 1990 to 2010 (with a notable
                                                                          peak in the 2001 drought year) and then showed a step increase from
                                                                          water year 2011 to 2019 (Figure 6(a)). The PET cumulative deviation
3.3       |   Potential ET and subsurface storage                         showed less systematic change from 1990 to 2010 followed by a
                                                                          cumulative increase of about 500 mm from 2011 to 2019
Meteorological variables that drive PET all showed systematic             (Figure 6(b)).
changes from water years 1990 to 2019. Air T generally increased               The growing season length ranged from 110 to 148 days, show-
during this time period with an annual low in 1993 and high in 2015.      ing substantial swings from year to year (Figure 7(a)). The south-facing
(Figure 4(a)). Wind speed increased from 1990 to 2000 and then            site had a longer growing season than the north face (median of
decreased through 2019 (Figure 4(b)). Net radiation minus ground          139 days on the south face compared to 131 days on the north face).
heat flux decreased from 1990 to 2010 and then increased through          The growing season precipitation was similar on the two aspects,
2019 (Figure 4(c)). Vapour pressure deficit increased from 1990 to        varying interannually with a series of high years from 2008 to 2015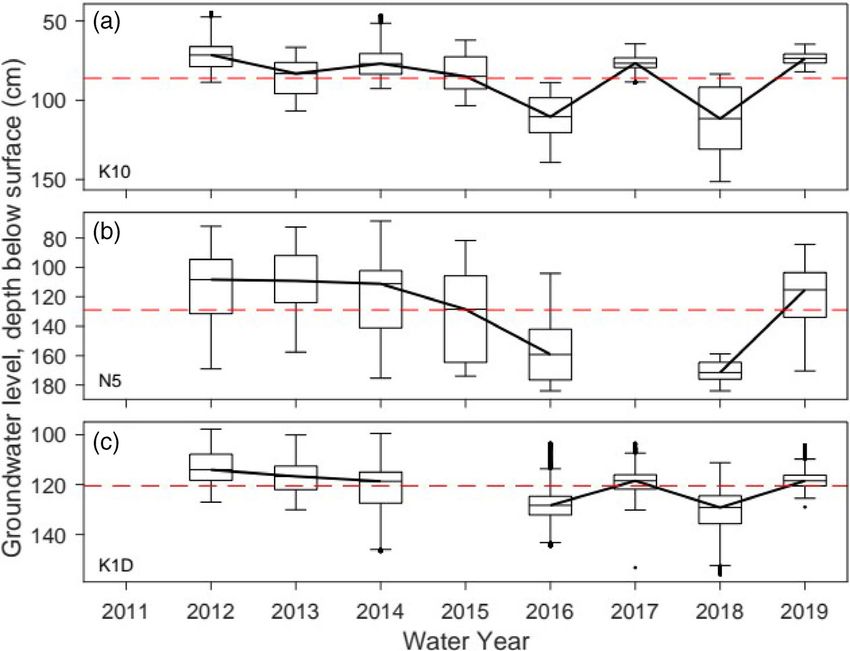
GREEN ET AL.                                                                                                                                 7 of 15

F I G U R E 4 Time series of four meteorological variables used to calculate potential evapotranspiration: (a) air temperature, (b) wind speed,
(c) net radiation minus soil heat flux, and (d) vapour pressure deficit

                                                                                Subsurface storage indicators increased from early in the records
                                                                            to 2010 followed by a decrease to the present (Figure 8). Low flows
                                                                            across the catchments increased in the south-facing catchments
                                                                            (W3 and W6) during the 2005–2015 period, but the north-facing
                                                                            catchments (W7 and W8) showed less evidence of this increase
                                                                            because the entire record had generally higher low flows. Soil mois-
                                                                            ture showed a clear downward trend from water year 2011 to 2017
                                                                            with the lowest value occurring in 2016 (Figure 9). A similar decrease
                                                                            was apparent in the May and June groundwater table data with 2016
                                                                            and 2018 being low years (Figure 10). These interannual changes in
                                                                            water table height were equivalent to a mean ΔSS from groundwater
                                                                            of 5.6 mm from 2013 to 2019 (range from 98 mm decrease from
                                                                            water year 2015 to 2016 to a 123 mm increase from water year 2018
                                                                            to 2019). The total water storage deviation estimated by GRACE
                                                                            showed an intra-annual range of about 200 mm with little visible evi-
F I G U R E 5 Mean annual leaf area index measured in from four             dence of monotonic changes during the 2010–2019 period of catch-
broadleaf forest stands located west of W6. An ice storm that               ment WBR increases (Figure S3).
damaged the canopy in 1998 is noted. The blue line shows a best-fit
line (Sen regression) for the 2000–2017 period following the ice
storm
                                                                            4    |   DI SCU SSION

(Figure 7(b)). Growing season PET was stable and under 500 mm from          The increase in the WBR since 2010 across all four catchments is
1990 to 2005 with a two-year peak in the drought years of 2000 and          unprecedented in the 64-year HBEF record. Here, we demonstrate
2001, and then increased during the 2005–2019 period from near              that this hydrologic change is real and not a measurement artefact.
500 to 600 mm (Figure 7(c)). The estimated growing season ET was            Then, we interpret the results and suggest that this change is mostly
consistently below 500 mm from 1990 to 2009, and then increased in          due to increasing ET rather than change in catchment storage. Finally,
stepwise fashion to about 540 mm with a notable low year of 2016            we discuss potential drivers that could cause increasing ET and
(Figure 7(d)).                                                              account for the WBR change.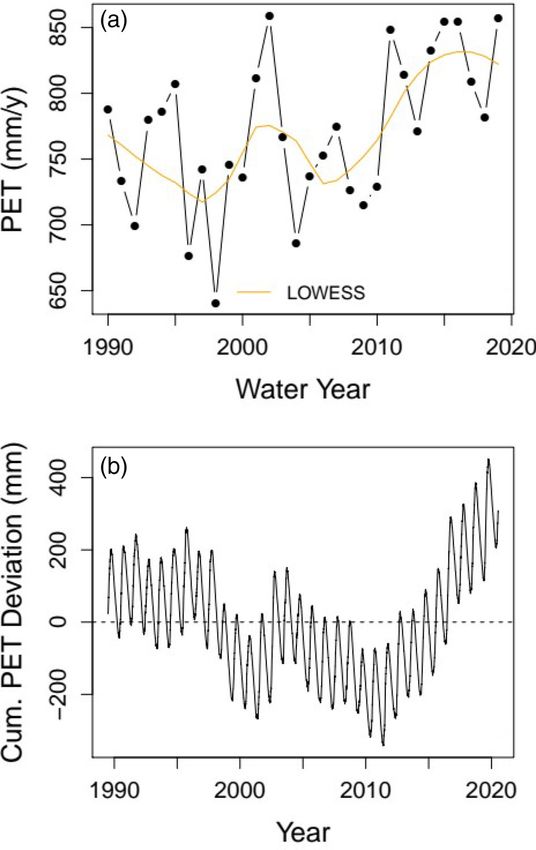
8 of 15                                                                                                                           GREEN ET AL.

                                                                        Service, 2020a, 2020b). This transition caused a subtle decrease in P
                                                                        estimates for W6 and no systematic change in P estimates for W3,
                                                                        W7 and W8 (Supplemental results). The impact of the changed P esti-
                                                                        mate for W6 was a persistent 23 mm/year decrease in WBR, which
                                                                        would cause lower WBR estimates in W6. Thus, the impact would be
                                                                        the opposite of the increases in WBR that we observed and counter-
                                                                        act the increase in WBR caused by the P gauge change. The net
                                                                        impact of P monitoring changes on W3, W7 and W8 would be
                                                                        increases in WBR after June 2016, but this increase was only about
                                                                        12% of the increase in WRB (see the Supplemental results for addi-
                                                                        tional details).
                                                                             Discharge measurements over the entire record have involved
                                                                        measuring the height of water passing over a V-notch weir with a
                                                                        float and pulley placed in a stilling well. The data loggers used to
                                                                        record the water stage changed from analog to digital in 2012. Our
                                                                        independent hook-gauge and a second visual float/pulley stage mea-
                                                                        surements remained the same (e.g., Yanai et al., 2015), and used to
                                                                        adjust any minor biases in the recorded stage. We also note that the
                                                                        increase in WBR is not a step increase, as might be expected if this
                                                                        signal were due to a change in measurement methods, but rather a
                                                                        gradual increase over time. Thus, we conclude that the WBR increase
                                                                        was not due to any changes in discharge measurement techniques.

                                                                        6 | EV I D E N C E O F C H A N GI N G S TO R A G E
                                                                        O R I NC R E A S I N G E V A P O T R A N S P I R A T I O N

                                                                        According to our water balance equation (Equation 1) and beyond any
                                                                        changes associated with P measurements, the additional increase in
F I G U R E 6 Annual potential evapotranspiration (PET) at the          WBR was due to either an increase in ET or ΔSS or some combination
Hubbard Brook Experimental Forest long-term comprehensive met
                                                                        of these two. Here, we examine whether ET or ΔSS was responsible
station, as estimated by the Penman-Monteith method. Panel A
shows the sum per water year with a LOWESS smoother to illustrate       for the WBR change by breaking the WBR change into three distinct
the trend, and panel B shows the cumulative sum of the deviation        periods of this hydrologic change: (1) a 2003–2009 wetting period,
from typical PET (766 mm/year indicated by the dashed line)             (2) a 2010–2014 pause in the wetting with differing catchment
                                                                        responses on the north and south aspects and (3) a 2015–2020
                                                                        increase in WBR across all catchments (Table 2).
5 | H Y DR O LO GI C M EA SUR E M E NT S                                     The catchments rewetted from 2003 to 2009 after the 2001 to
D U R I N G T H E WB R I N C R E A S E                                  2002 dry period, resulting in favourable conditions for net accumula-
                                                                        tion of subsurface storage. Precipitation from 2003 to 2009 was high
Discharge and P measurements at the HBEF were modernized                (mean area-weighted P = 1615 mm/year) and PET was relatively low
starting in 2012, and changes in P monitoring may have contributed      (mean PET = 812 mm/year); thus, there was excess precipitation
to increases in the annual WBR. Analog P instruments were               available to recharge groundwater or generate runoff. The Rn-G and
decommissioned in 2016 and replaced with digital weighing P gauges.     VPD were particularly low during this period, driving the low PET
Those gauges catch 2%–7% more P on average, based on a compari-         (Figure 5). In response, the annual RO was the highest on record and
son of daily P estimates from co-located instruments between 2011       the cumulative RO deviation went from being 1000 mm cumulatively
and 2013. This amount could increase the annual WBR by about 12%        lower than normal to 500–1000 mm higher than normal (Figures 2
per year starting in June 2016 or cumulatively 252 mm from June         and 3). The low flows in W3, W6 and W7 during this period also
2016 to May 2020. This increase was substantially less than the         increased, reaching the highest on record in W3 and W6 in 2010
observed WBR increase, which averaged 667 mm/year over that time,       (Figure 8).
and therefore cannot explain the difference. In June 2016, the P net-        The 2010–2014 period was a transitional period with lower pre-
work was also reduced from 23 to 9 P gauges and the spatial interpo-    cipitation and a turning point from lower to higher PET. The mean P
lation method was changed from the Thiessen polygon to the inverse      during this period was 1545 mm/year and mean PET was 874 mm/
distance weighting method (Green et al., 2018; USDA Forest              year; thus, there was less excess precipitation and RO was driven by a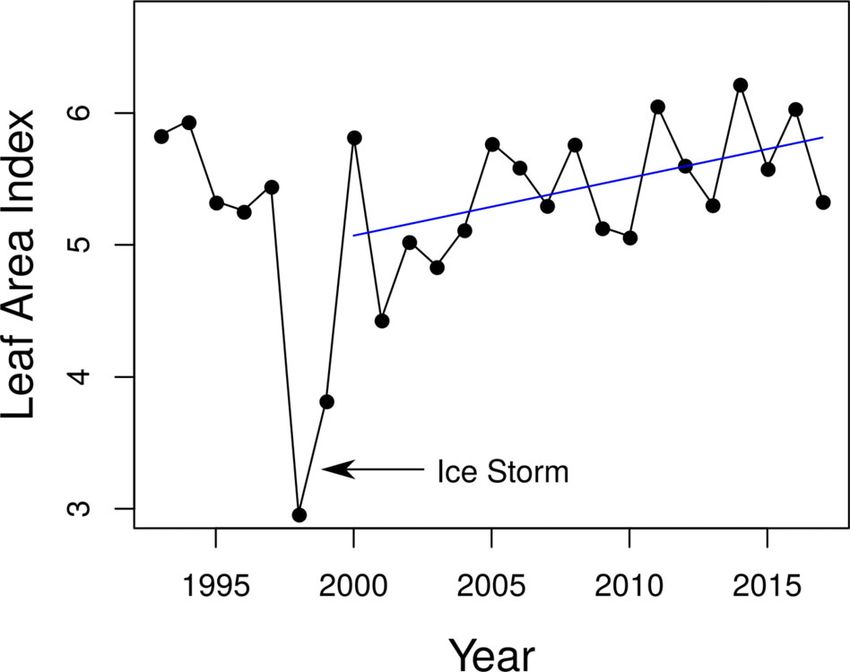
GREEN ET AL.                                                                                                                              9 of 15

F I G U R E 7 Growing season
(a) length based on canopy
phenology measurements,
(b) precipitation (P) during the
growing season, (c) potential
evapotranspiration (PET) during
the growing season, and (d) a
simple estimate of growing
season evapotranspiration
(ET) assuming a balance between
PET and P. North and south
facing sites are compared; only
phenology and precipitation data
are collected on the two aspects.
The median ET from 1990 to
2009 (median = 483 mm/year)
and from 2010 to 2019
(median = 541 mm/year) are
shown as solid blue lines in
panel D

F I G U R E 8 Time series of 5th
percentile flow rates for
(a) Watershed 3, (b) Watershed
6, (c) Watershed 7, and
(d) Watershed 8. A LOWESS
curve is shown to clarify multiple-
year patterns

combination of ET and residual storage from the previous period.        relatively narrow band of bedrock outcrops along their upper divides,
These conditions seem to have caused differential responses in the      whereas bedrock outcrops are more prevalent over a broader area in
catchments on the two topographic aspects. In the case of W3 (and       the upper portions of the north-facing catchments. The deepest gla-
somewhat in W6), this resulted in a transition from high to low flows   cial drift deposits that have been found in the south-facing catch-
in 2010 to below-average low flows by 2014 (Figure 8) and low WBR       ments are in the upper portion of the catchments, in positions that
from 2010 to 2014. In the case of W7 and W8, this period marked         are dominated by shallow bedrock in the north-facing catchments.
the beginning of increases in WBR (Figures 2 and 3). We hypothesize     This contrast suggests a difference in ‘fill-and-spill’ storage behaviour
that the south-facing catchments were able to store more of the         (cf. Tromp-van Meerveld & McDonnell, 2006) by topographic aspect
excess P from 2003 to 2009 and release it more slowly than the          with potentially greater storage in deeper deposits on the south facing
north-facing catchments. The south-facing catchments have a             compared to the north facing aspects of the Hubbard Brook valley.
10 of 15                                                                                                                               GREEN ET AL.

Using a water isotope-calibrated hydrologic model for W3, Benettin        warm Ta, high VPD and Rn relative to the beginning of the wetting in
et al. (2015) estimated deep groundwater storage of 760 mm, which         2003 (Figure 4), resulting in an inflection point upwards in PET begin-
suggests groundwater contributions to streamflow from glacial drift       ning in 2011 (Figure 6(b)). During this period, low flows were average
that is at least 3 m in depth. Additionally, we expect that ET may have   or below average (Figure 8), and subsurface storage indicators were
started to increase in 2010 as evidenced by the increasing WBR in         low (Figures 9 and 10), suggesting stable or decreasing catchment
W7 and W8. However, we do not have sufficient data on the north-          storage. The WBR of 667 mm/year during this period was 31% higher
facing aspect to know the presence or magnitude of PET or LAI             than the 1970–2002 area-weighted mean of 509 mm/year, which
changes that might explain the slightly different WBR response.           was likely due to high ET.
    After this 2010–2014 transitional period, all four catchments             The overall picture for the 2003–2020 period is multiple years of
demonstrated drastic increases in WBR from water years 2015 to            increasing catchment storage as precipitation increased (Figures 3 and
2019, which we hypothesize was due to increased ET. This period had       Figure S3), followed by years of high PET (Figure 6(b)), particularly
relatively high P (mean P = 1650 mm/year) and high PET (mean              during the growing season (Figure 7(c)), resulting in higher ET.
PET = 902 mm/year). The high PET during this period was due to

                                                                          7 | POTENTIAL DRIVERS OF INCREASING
                                                                          EVAPOTRANSPIRATION

                                                                          We propose that the increase in ET from 2010 to 2020 above any
                                                                          change associated with precipitation measurements was caused by
                                                                          both increased PET and reduced forest canopy resistance (rc). The
                                                                          HBEF is generally considered energy limited because annual P > PET
                                                                          (Creed et al., 2014; Jones et al., 2012; Vadeboncoeur et al., 2018), so
                                                                          we might expect ET to track PET closely. The increase in growing sea-
                                                                          son PET from about 500 mm/year to near 600 mm/year between
                                                                          2007 and 2019 (Figure 7(c)) has similar timing and but slightly lower
                                                                          magnitude than the increase in WBR (Figure 2(f)). Also, we observed a
                                                                          positive cumulative PET deviation of about 500 mm from 2011 to
                                                                          2020 (Figure 6(b)), compared to the approximately 800–1300 of
F I G U R E 9 Mean annual scaled soil moisture across 14 locations        cumulative WBR that occurred (Figure 3). If we recalculate PET with-
within the HBEF valley                                                    out the LAI data, and instead use the long-term mean, the positive

                                                                                                          F I G U R E 1 0 Boxplots of water
                                                                                                          table heights in May and June from
                                                                                                          2012 to 2019 at sites (a) K10, (b) N5,
                                                                                                          and (c) K1D within the W3 catchment.
                                                                                                          The horizontal dashed line represents
                                                                                                          the multi-year mean of the median
                                                                                                          water table
GREEN ET AL. 11 of 15
T A B L E 2 Annual precipitation (P), runoff (RO), and water budget residuals (WBR) for the four reference catchments and the area-weighted
average of the four catchments during the 2003–2019 period of abrupt hydrologic change
Precipitation (mm/year) Runoff (mm/year) WBR (mm/year)
Water year W3 W6 W7 W8 Avg W3 W6 W7 W8 Avg W3 W6 W7 W8 Avg
2003 1610 1691 1697 1702 1679 1127 1239 1196 1198 1184 484 451 501 504 495
2004 1383 1435 1446 1447 1432 929 984 957 970 957 455 451 489 477 475
2005 1695 1791 1928 1871 1849 1185 1267 1383 1352 1322 509 524 544 518 527
2006 1464 1555 1585 1577 1554 940 1050 1049 1025 1018 523 505 537 552 536
2007 1542 1610 1558 1560 1559 1020 1077 991 1032 1016 521 533 567 527 542
2008 1576 1654 1797 1760 1727 1035 1151 1226 1190 1168 540 502 571 570 559
2009 1474 1527 1522 1520 1511 1089 1191 1012 1004 1039 385 336 510 516 472
2010 1625 1726 1761 1755 1727 1268 1285 1144 1150 1183 357 441 616 605 544
2011 1579 1680 1720 1721 1687 1178 1159 1035 1014 1069 400 521 685 707 618
2012 1397 1473 1506 1512 1481 991 989 897 827 902 406 484 609 684 579
2013 1383 1436 1463 1483 1450 1002 975 907 894 929 381 462 556 588 521
2014 1294 1326 1427 1432 1392 711 778 823 790 785 582 548 604 642 607
2015 1513 1512 1651 1620 1602 883 895 1005 1036 980 630 617 646 585 622
2016 1451 1487 1541 1535 1515 700 728 830 836 796 751 759 711 699 719
2017 1595 1563 1743 1662 1673 924 933 1029 992 988 671 630 714 670 685
2018 1923 1903 1918 1924 1920 1182 1314 1267 1199 1230 741 589 651 725 689
2019 1541 1522 1543 1539 1540 868 906 976 887 920 673 616 567 652 620
cumulative deviation between 2011 and 2020 is about 250 mm (not
shown), indicating that the 500 mm of PET that we can explain is
approximately half from atmospheric demand (available energy and
VPD) and half from LAI increasing. The remaining 300–800 mm of
unexplained WBR, may be due to other factors related to rc, such as
forest community composition, structure or tree physiology change.
Previous work has demonstrated how ET modeled with the Penman-
Monteith equation (Equation 2) in cool temperate forests is highly
sensitive to rc (Beven, 1979). Specific physiological controls would be
those that control photosynthetic rates (e.g., foliar nitrogen;
Niinemets, 1997) or other processes that impact stomatal function
(e.g., xylem embolism; Domec et al., 2004). The WBR at the HBEF has
shown sensitivity to vegetation changes in the past. Green
et al. (2013) showed a multi-year WBR increase after a soil amend- F I G U R E 1 1 Time series of the area weighted water budget
ment with calcium silicate that altered canopy albedo, which is related residual (WBR') to potential evapotranspiration (PET) ratio from water
to the maximum photosynthetic rate (Ollinger et al., 2008). Transpira- year 1990 to 2019
tion rates could be increasing as forest soils in the northeastern
United States experience increases in soil pH and Ca, and associated
decreases in Al, as atmospheric acid deposition rates have declined decreased rc will require further synthesis of existing vegetation data
(Hazlett et al., 2020; Lawrence et al., 2015). Interception rates may from HBEF as well as more characterization of physiological changes
also be increasing as red spruce increases its presence in our region that might have occurred in the forest.
over recent decades (Foster & D'Amato, 2015; Kosiba et al., 2018) Beyond the increase in ET, some of the WBR increase is likely
and the number of days per year that deciduous trees have leaves has due to ΔSS. Previous studies in the northeastern United States have
increased (Groffman et al., 2012). The area weighted WBR (WBR') documented increases in storage (along the order of 100 mm) based
compared to annual PET suggests that the WBR':PET was high in on GRACE and discharge analyzes (Thomas et al., 2016; Thomas &
water years 2016, 2017 and 2018 (Figure 11), indicating a possible Famiglietti, 2019). More comprehensive observations of ΔSS are
reduction in rc over these years. We hypothesize that a reduction in rc needed to be more confident as we attribute changes in WBR to dif-
in the 2010–2020 period has led to increases in ET. The cause of ferent processes. The HBEF had previously documented minimal loss12 of 15 GREEN ET AL.
to deep seepage (L) on annual water budgets (Verry, 2003). Our study DATA AVAILABILITY STAT EMEN T
suggests that ΔSS was a small part of the annual water budgets, based Precipitation and discharge data that support the findings of this study
on dynamics in soil moisture from the uppermost part of the soil pro- are openly available in the Environmental Data Initiative at https://doi.
file and variation in shallow water table position. However, prelimi- org/10.6073/pasta/87584eda806dd5a480423b6bfefec577 and
nary ground penetrating radar surveys, confirmed by soil pits and https://doi.org/10.6073/pasta/c64ad38eef4f56d9e34749f166f64caa.
monitoring well installations, show that portions of these study catch- Meteorological, leaf area index, canopy phenology, soil moisture, and
ments have much deeper and more permeable glacial deposits than water table data that support the findings of this study are openly avail-
previously recognized. The extent of T perching of the shallow able in the Environmental Data Initiative at https://doi.org/10.6073/
groundwater system in the soil zone, and dynamics in its recharge to pasta/7486a33ab8549c262233ad3e4a8b42a3, https://doi.org/10.
deeper groundwater storage in areas of thicker glacial deposits, are 6073/pasta/3958640a5f5ed3af7b5e40a5cc710b40, https://doi.org/
poorly known. Better understanding of the groundwater system, with 10.6073/pasta/3511ed3f4a50ee86fddb3fbf8b42ccd5, https://doi.org/
improved estimates of ΔSS, would allow us to more accurately esti- 10.6073/pasta/f2c18a955c24eadaec1fa0d915a7b527, https://doi.
mate the magnitude of changes in ET. Recent studies have highlighted org/10.6073/pasta/e7c793b98b895de2bb5e505f9ff5e0cb, https://
the importance in estimating ΔSS across many catchments and con- doi.org/10.6073/pasta/e7c793b98b895de2bb5e505f9ff5e0cb, https://
cluded that while ΔSS may be small in some contexts, it is not negligi- doi.org/10.6073/pasta/e6ca833db8b6a4931ab9fafb91191d38, and
ble and is related to catchment characteristics (Han et al., 2020; https://doi.org/10.6073/pasta/a7b6b61df98b65244eba64d8bc391582.
Rice & Emanuel, 2019). As ET is changing with increasing atmospheric
CO2 and Ta, small catchment studies will benefit from more compre- OR CID
hensive measurements, including greater attention to ΔSS and subsur- Mark B. Green https://orcid.org/0000-0002-7415-7209
face characterization, to help isolate hydrologic changes and their Scott W. Bailey https://orcid.org/0000-0002-9160-156X
likely causes. While we have a wealth of hydrological, meteorological, John L. Campbell https://orcid.org/0000-0003-4956-1696
geological and vegetation measurements at the HBEF, we still lack
enough information to explain differences in PET and hydrogeology RE FE RE NCE S
across topographic aspects. Better measurements of ΔSS at the Allen, R. G., Pereira, L. S., Raes, D., & Smith, M. (1998). Crop
evapotranspiration-guidelines for computing crop water requirements-
HBEF, particularly of the deeper groundwater storage, will help refine
FAO irrigation and drainage paper 56, Fao, Rome, 300(9), D05109.
our understanding of ΔSS and improve our estimation of catchment- Bailey, A. S., Hornbeck, J. W., Campbell, J. L., & Eagar, C. (2003). Hydrome-
scale ET. teorological database for Hubbard Brook Experimental Forest:
While we strive for more comprehensive monitoring of the catch- 1955-2000. U.S. Forest Service General Technical Report-305, 36.
Bailey, S. W., Brousseau, P. A., McGuire, K. J., & Ross, D. S. (2014). Influ-
ments at the HBEF, the existing long-term data enabled documenta-
ence of landscape position and transient water table on soil develop-
tion of this hydrologic change, highlighting the importance of long- ment and carbon distribution in a steep, headwater catchment.
term catchment studies. It is only in the context of long-term observa- Geoderma, 226–227, 279–289.
tions that we can see how the WBR values from 2015 to 2019 are Bailey, S. W., Hornbeck, J. W., Driscoll, C. T., & Gaudette, H. E. (1996).
highly unusual and warrant attention. If this is an approximately 30% Calcium inputs and transport in a base-poor forest ecosystem as
interpreted by Sr isotopes. Water Resources Research, 32(3),
increase in ET as we hypothesize, we need to understand its cause
707–719.
more definitively and determine the spatial extent of its occurrence. Battles, J. J., Fahey, T. J., Driscoll, C. T., Blum, J. D., & Johnson, C. E.
Increases in ET have been documented and are expected with climate (2014). Restoring soil calcium reverses forest decline. Environmental
change (Brutsaert, 2017; Gaertner et al., 2019; Pascolini-Campbell Science & Technology Letters, 1, 15–19.
Benettin, P., Bailey, S. W., Campbell, J. L., Green, M. B., Rinaldo, A.,
et al., 2021; Tsuruta et al., 2020; Younger et al., 2020). However,
Likens, G. E., McGuire, K. J., & Botter, G. (2015). Linking water age
observed changes have been inconsistent and show both increases and solute dynamics in streamflow at the Hubbard Brook Experi-
and decreases within the northeastern US forest region mental Forest, NH, USA. Water Resources Research, 51(11), 9256–
(Vadeboncoeur et al., 2018) even though at continental scales mostly 9272.
Beven, K. (1979). A sensitivity analysis of the Penman-Monteith actual
increases have been observed (Szilagyi et al., 2001; Walter
evapotranspiration estimates. Journal of Hydrology, 44(3–4), 169–190.
et al., 2004). Small catchments with comprehensive hydrological Briceño, H., Miller, G., & Davis, S. E. (2014). Relating Freshwater Flow with
records are vital for documenting changes in ET and accurately attrib- Estuarine Water Quality in the Southern Everglades Mangrove Eco-
uting those changes to specific drivers. tone. Wetlands, 34, 101–111.
Brutsaert, W. (2008). Long-term groundwater storage trends estimated
from streamflow records: Climatic perspective. Water Resources
ACKNOWLEDGEMEN TS Research, 44(2), W02409.
We thank two anonymous reviewers who helped improve this manu- Brutsaert, W. (2017). Global land surface evaporation trend during the
script. We also thank Cindy Wood and Natalie Cleavitt for help produc- past half century: Corroboration by Clausius-Clapeyron scaling.
Advances in Water Resources, 106, 3–5.
ing the leaf area index data, and Ian Halm, Hannah Vollmer and Gabe
Burton, W. C., Walsh, G. J., & Armstrong, T. R. (2002). Bedrock geologic
Winant for help producing the hydrologic data. The Hubbard Brook
map of the Hubbard Brook Experimental Forest, Grafton County, New
Experimental Forest is operated and maintained by the USDA Forest Hampshire, U.S. Geological Survey Open-File Report 00-045, Reston,
Service, Northern Research Station, Madison, WI (1014507, 1114804). VA: U.S. Department of the Interior.GREEN ET AL. 13 of 15
Byrne, M. P., & O'Gorman, P. A. (2018). Trends in continental temperature amended with calcium silicate. Proceedings of the National Academy of
and humidity directly linked to ocean warming. Proceedings of the Sciences of the United States of America, 110(15), 5999–6003.
National Academy of Sciences of the United States of America, 115(19), Green, M. B., Campbell, J. L., Yanai, R. D., Bailey, S. W., Bailey, A. S.,
4863–4868. Grant, N., Halm, I., Kelsey, E. P., & Rustad, L. E. (2018). Downsizing a
Campbell, J. L., Driscoll, C. T., Pourmokhtarian, A., & Hayhoe, K. (2011). long-term precipitation network: Using a quantitative approach to
Streamflow responses to past and projected future changes in climate inform difficult decisions. PLoS One, 13(5), e0195966.
at the Hubbard Brook Experimental Forest, New Hampshire, United Green, M. B., Laursen, B. K., Campbell, J. L., McGuire, K. J., & Kelsey, E. P.
States. Water Resources Research, 47(2), W02514. (2015). Stable water isotopes suggest sub-canopy water recycling in a
Campbell, J. L., Ollinger, S. V., Flerchinger, G. N., Wicklein, H., northern forested catchment. Hydrological Processes, 29(25), 5193–
Hayhoe, K., & Bailey, A. S. (2010). Past and projected future changes 5202.
in snowpack and soil frost at the Hubbard Brook Experimental Forest, Groffman, P. (2019). Snow depth, soil frost depth and snow water content
New Hampshire, USA. Hydrological Processes, 24(17), 2465–2480. along an elevation gradient at the Hubbard Brook Experimental Forest
Campbell, J. L., Rustad, L. E., Bailey, S. W., Bernhardt, E. S., Driscoll, C. T., vers 5. Environmental Data Initiative. https://doi.org/10.6073/pasta/
Green, M. B., et al. (2021). Watershed studies at the Hubbard Brook 3958640a5f5ed3af7b5e40a5cc710b40
Experimental Forest: Building on a long legacy of research with new Groffman, P. M., Rustad, L. E., Templer, P. H., Campbell, J. L.,
approaches and sources of data. Hydrological Processes, 35(1), e14016. Christenson, L. M., Lany, N. K., … Driscoll, C. T. (2012). Long-term inte-
Cluis, D. A. (1983). Visual techniques for the detection of water quality grated studies show complex and surprising effects of climate change
trends: Double-mass curves and cusum functions. Environmental Moni- in the northern hardwood forest. Bioscience, 62(12), 1056–1066.
toring and Assessment, 3, 173–184. Han, J., Yang, Y., Roderick, M. L., McVicar, T. R., Yang, D., Zhang, S., &
Creed, I. F., Spargo, A. T., Jones, J. A., Buttle, J. M., Adams, M. B., Beck, H. E. (2020). Assessing the steady-state assumption in water bal-
Beall, F. D., … Green, M. B. (2014). Changing forest water yields in ance calculation across global catchments. Water Resources Research,
response to climate warming: Results from long-term experimental 56, e2020WR027392. https://doi.org/10.1029/2020WR027392
watershed sites across North America. Global Change Biology, 20(10), Hawkins, D. M., & Olwell, D. H. (2012). Cumulative sum charts and charting
3191–3208. for quality improvement. Springer Science & Business Media.
Detty, J. M., & McGuire, K. J. (2010). Threshold changes in storm runoff Hazlett, P., Emilson, C., Lawrence, G., Fernandez, I., Ouimet, R., & Bailey, S.
generation at a till-mantled headwater catchment. Water Resources (2020). Reversal of forest soil acidification in the northeastern United
Research, 46(7), W07525. States and Eastern Canada: Site and soil factors contributing to recov-
Domec, J. C., Warren, J. M., Meinzer, F. C., Brooks, J. R., & Coulombe, R. ery. Soil Systems, 4(3), 54.
(2004). Native root xylem embolism and stomatal closure in stands of Hinkley, D. V. (1971). Inference about the change-point from cumulative
Douglas-fir and ponderosa pine: Mitigation by hydraulic redistribution. sum tests. Biometrika, 58, 509–523.
Oecologia, 141(1), 7–16. Hogan, J. F., & Blum, J. D. (2003). Tracing hydrologic flow paths in a small
Fahey, T., & Cleavitt, N. (2021). Hubbard Brook Experimental Forest: Leaf forested watershed using variations in 87Sr/86Sr,[Ca]/[Sr],
Area Index (LAI) Bear Brook Watershed (West of Watershed 6) ver 1. [Ba]/[Sr] and δ18O. Water Resources Research, 39(10), 1282.
Environmental Data Initiative. https://doi.org/10.6073/pasta/ Hooper, R. P., & Shoemaker, C. A. (1986). A comparison of chemical and
e6ca833db8b6a4931ab9fafb91191d38 . isotopic hydrograph separation. Water Resources Research, 22(10),
Federer, C. A. (1973). Forest transpiration greatly speeds streamflow 1444–1454.
recession. Water Resources Research, 9(6), 1599–1604. Hornbeck, J. W., Martin, C. W., & Eagar, C. (1997). Summary of water yield
Federer, C. A. (1990). Change, persistence and error in thirty years of experiments at Hubbard Brook Experimental Forest, New Hampshire.
hydrometeorological data at Hubbard Brook. Climate variability and Canadian Journal of Forest Research, 27, 2043–2052.
ecosystem response. USDA For. Serv. Gen. Tech. Rep. SE-65, 3–12. Huang, H., Winter, J. M., Osterberg, E. C., Horton, R. M., & Beckage, B.
Foster, J. R., & D'Amato, A. W. (2015). Montane forest ecotones moved (2017). Total and extreme precipitation changes over the northeastern
downslope in northeastern USA in spite of warming between 1984 United States. Journal of Hydrometeorology, 18(6), 1783–1798.
and 2011. Global Change Biology, 21(12), 4497–4507. Jensen, C. K., McGuire, K. J., & Prince, P. S. (2017). Headwater stream
Fuss, C. B., Driscoll, C. T., Green, M. B., & Groffman, P. M. (2016). Hydro- length dynamics across four physiographic provinces of the Appala-
logic flowpaths during snowmelt in forested headwater catchments chian Highlands. Hydrological Processes, 31(19), 3350–3363.
under differing winter climatic and soil frost regimes. Hydrological Pro- Jones, J. A., Creed, I. F., Hatcher, K. L., Warren, R. J., Adams, M. B.,
cesses, 30(24), 4617–4632. Benson, M. H., … Clow, D. W. (2012). Ecosystem processes and human
Gaertner, B. A., Zegre, N., Warner, T., Fernandez, R., He, Y., & influences regulate streamflow response to climate change at long-
Merriam, E. R. (2019). Climate, forest growing season, and evapotrans- term ecological research sites. Bioscience, 62(4), 390–404.
piration changes in the central Appalachian Mountains, USA. Science Kelly, C. N., McGuire, K. J., Miniat, C. F., & Vose, J. M. (2016). Streamflow
of the Total Environment, 650, 1371–1381. response to increasing precipitation extremes altered by forest man-
Gannon, J. P., Bailey, S. W., & McGuire, K. J. (2014). Organizing groundwa- agement. Geophysical Research Letters, 43(8), 3727–3736.
ter regimes and response thresholds by soils: A framework for under- Kelsey, E., Green, M., & Evans, D. (2019). Hubbard Brook Experimental
standing runoff generation in a headwater catchment. Water Resources Forest: Flux Tower Data ver 2. Environmental Data Initiative. https://
Research, 50(11), 8403–8419. doi.org/10.6073/pasta/19bb57896cbdb686f93049b9b2d95c09
Gannon, J. P., McGuire, K. J., Bailey, S. W., Bourgault, R. R., & Ross, D. S. Kendall, M. G. (1938). A new measure of rank correlation. Biometrika, 30
(2017). Lateral water flux in the unsaturated zone: A mechanism for (1/2), 81–93.
the formation of spatial soil heterogeneity in a headwater catchment. Kirchner, J. W., & Allen, S. T. (2020). Seasonal partitioning of precipitation
Hydrological Processes, 31(20), 3568–3579. between streamflow and evapotranspiration, inferred from end-
Germann, P. F., Pierce, R. S., & Beven, K. (1986). Kinematic wave approxi- member splitting analysis. Hydrology & Earth System Sciences, 24(1),
mation to the initiation of subsurface storm flow in a sloping forest 17–39.
soil. Advances in Water Resources, 9(2), 70–76. Klemeš, V. (1979). Storage mass-curve analysis in a systems-analytic per-
Green, M. B., Bailey, A. S., Bailey, S. W., Battles, J. J., Campbell, J. L., spective. Water Resources Research, 15, 359–370.
Driscoll, C. T., Fahey, T. J., Lepine, L. C., Likens, G. E., Ollinger, S. V., & Kosiba, A. M., Schaberg, P. G., Rayback, S. A., & Hawley, G. J. (2018). The
Schaberg, P. G. (2013). Decreased water flowing from a forest surprising recovery of red spruce growth shows links to decreased acid14 of 15 GREEN ET AL.
deposition and elevated temperature. Science of the Total Environment, Reinhart, K. G., & Pierce, R. S. (1964). Stream-gaging stations for research on
637, 1480–1491. small watersheds (No. 268). US Department of Agriculture.
Kramer, R. J., Bounoua, L., Zhang, P., Wolfe, R. E., Huntington, T. G., Rhoads, A. G., Hamburg, S. P., Fahey, T. J., Siccama, T. G., Hane, E. N.,
Imhoff, M. L., Thome, K., & Noyce, G. L. (2015). Evapotranspiration Battles, J., Cogbill, C., Randall, J., & Wilson, G. (2002). Effects of an
trends over the eastern United States during the 20th century. Hydrol- intense ice storm on the structure of a northern hardwood forest.
ogy, 2, 93–111. Canadian Journal of Forest Research, 32(10), 1763–1775.
Landerer, F. W., Flechtner, F. M., Save, H., Webb, F. H., Bandikova, T., Rice, J. S., & Emanuel, R. E. (2019). Ecohydrology of interannual changes in
Bertiger, W. I., … Yuan, D. N. (2020). Extending the global mass change watershed storage. Water Resources Research, 55, 8238–8251.
data record: GRACE Follow-On instrument and science data perfor- https://doi.org/10.1029/2019WR025164
mance. Geophysical Research Letters, 47(12), e2020GL088306. Richardson, A. D., Bailey, A. S., Denny, E. G., Martin, C. W., & O'Keefe, J.
Lawrence, G. B., Hazlett, P. W., Fernandez, I. J., Ouimet, R., Bailey, S. W., (2006). Phenology of a northern hardwood forest canopy. Global
Shortle, W. C., Smith, K. T., & Antidormi, M. R. (2015). Declining acidic Change Biology, 12(7), 1174–1188.
deposition begins reversal of forest-soil acidification in the northeast- Searcy, J. K., & Hardison, C.H. (1960). Double-mass curves. Geological Sur-
ern US and eastern Canada. Environmental Science & Technology, 49 vey Water Supply Paper 1541-B. United States Government Printing
(22), 13103–13111. Office, Washington.
Leonard, R. E., & Reinhart, K. G. (1963). Some observations on precipita- See, C. R., Green, M. B., Yanai, R. D., Bailey, A. S., Campbell, J. L., &
tion measurement on forested experimental watersheds. Research Hayward, J. (2020). Quantifying uncertainty in annual runoff due to
Note NE-6. Upper Darby, PA: US Department of Agriculture, Forest missing data. PeerJ, 8, e9531.
Service, Northeastern Forest Experiment Station. 1–4, 6. Sen, P. K. (1968). Estimates of the regression coefficient based on
Likens, G. E. (2013). Biogeochemistry of a forested ecosystem. Springer Sci- Kendall's tau. Journal of the American Statistical Association, 63(324),
ence & Business Media. 1379–1389.
Likens, G. E., Driscoll, C. T., & Buso, D. C. (1996). Long-term effects of acid Siccama, T. G., Fahey, T. J., Johnson, C. E., Sherry, T. W., Denny, E. G.,
rain: response and recovery of a forest ecosystem. Science, 272(5259), Girdler, E. B., Likens, G. E., & Schwarz, P. A. (2007). Population and
244–246. biomass dynamics of trees in a northern hardwood forest at Hubbard
Lynch, J. A., & Corbett, E. S. (1990). Evaluation of best management prac- Brook. Canadian Journal of Forest Research, 37, 737–749.
tices for controlling nonpoint pollution from silvicultural operations. Smail, R. A., Pruitt, A. H., Mitchell, P. D., & Colquhoun, J. B. (2019). Cumu-
Journal of the American Water Resources Association, 26(1), 41–52. lative deviation from moving mean precipitation as a proxy for ground-
McGuire, K., Bailey, S., & Gannon, J. (2019). Water level recordings from water level variation in Wisconsin. Journal of Hydrology X, 5, 100045.
wells in Watershed 3 at the Hubbard Brook Experimental Forest, Szilagyi, J., Katul, G. G., & Parlange, M. B. (2001). Evapotranspiration inten-
2007 - present ver 3. Environmental Data Initiative. https://doi.org/10. sifies over the conterminous United States. Journal of Water Resources
6073/pasta/a7b6b61df98b65244eba64d8bc391582 Planning and Management, 127(6), 354–362.
McNamara, J. P., Tetzlaff, D., Bishop, K., Soulsby, C., Seyfried, M., Thomas, B. F., & Famiglietti, J. S. (2019). Identifying climate-induced
Peters, N. E., Aulenbach, B. T., & Hooper, R. (2011). Storage as a metric groundwater depletion in GRACE observations. Scientific Reports, 9(1),
of catchment comparison. Hydrological Processes, 25(21), 3364–3371. 1–9.
McVicar, T. R., Roderick, M. L., Donohue, R. J., Li, L. T., Van Niel, T. G., Thomas, B. F., Landerer, F. W., Wiese, D. N., & Famiglietti, J. S. (2016). A
Thomas, A., … Mescherskaya, A. V. (2012). Global review and synthesis comparison of watershed storage trends over the eastern and upper
of trends in observed terrestrial near-surface wind speeds: Implica- Midwestern regions of the United States, 2003–2015. Water
tions for evaporation. Journal of Hydrology, 416, 182–205. Resources Research, 52(8), 6335–6347.
Niinemets, Ü. (1997). Role of foliar nitrogen in light harvesting and shade Trenberth, K. E. (2011). Changes in precipitation with climate change. Cli-
tolerance of four temperate deciduous woody species. Functional Ecol- mate Research, 47(1–2), 123–138.
ogy, 11(4), 518–531. Tromp-van Meerveld, H. J., & McDonnell, J. J. (2006). Threshold relations
Nijzink, R., Hutton, C., Pechlivanidis, I., Capell, R., Arheimer, B., Freer, J., in subsurface stormflow: 2. The fill and spill hypothesis. Water
Han, D., Wagener, T., McGuire, K., Savenije, H., & Hrachowitz, M. Resources Research, 42(2), W02411.
(2016). The evolution of root-zone moisture capacities after deforesta- Tsuruta, K., Kosugi, Y., Katsuyama, M., Kosugi, K. I., Suzuki, M., & Tani, M.
tion: A step towards hydrological predictions under change? Hydrology (2020). Long-term effects of evapotranspiration on the flow duration
and Earth System Sciences, 20, 4775–4799. curve in a coniferous plantation forest over 40 years. Hydrological
O'Gorman, P. A., & Schneider, T. (2009). The physical basis for increases in Research Letters, 14(1), 1–8.
precipitation extremes in simulations of 21st-century climate change. USDA Forest Service, Northern Research Station. (2020a). Hubbard Brook
Proceedings of the National Academy of Sciences of the United States of Experimental Forest: Total Daily Precipitation by Watershed, 1956 -
America, 106(35), 14773–14777. present ver 12. Environmental Data Initiative. https://doi.org/10.6073/
Ollinger, S. V., Richardson, A. D., Martin, M. E., Hollinger, D. Y., pasta/3d093a09034c4863b3834f5db58fc0b2 .
Frolking, S. E., Reich, P. B., … Smith, M. L. (2008). Canopy nitrogen, car- USDA Forest Service, Northern Research Station. (2020b). Hubbard Brook
bon assimilation, and albedo in temperate and boreal forests: Func- Experimental Forest: Daily Streamflow by Watershed, 1956 - present
tional relations and potential climate feedbacks. Proceedings of the ver 11. Environmental Data Initiative. https://doi.org/10.6073/pasta/
National Academy of Sciences of the United States of America, 105(49), d10220595119b502fe2ac14833fa4b9b
19336–19341. Vadeboncoeur, M. A., Green, M. B., Asbjornsen, H., Campbell, J. L.,
Pascolini-Campbell, M., Reager, J. T., Chandanpurkar, H. A., & Rodell, M. Adams, M. B., Boyer, E. W., Burns, D. A., Fernandez, I. J.,
(2021). A 10 per cent increase in global land evapotranspiration from Mitchell, M. J., & Shanley, J. B. (2018). Systematic variation in evapo-
2003 to 2019. Nature, 593(7860), 543–547. transpiration trends and drivers across the northeastern United States.
Patric, J. H., & Reinhart, K. G. (1971). Hydrologic effects of deforesting Hydrological Processes, 32(23), 3547–3560.
two mountain watersheds in West Virginia. Water Resources Research, Van Doorn, N. S., Battles, J. J., Fahey, T. J., Siccama, T. G., & Schwarz, P. A.
7(5), 1182–1188. (2011). Links between biomass and tree demography in a northern
Regier, P., Briceño, H., & Boyer, J. N. (2019). Analyzing and comparing hardwood forest: a decade of stability and change in Hubbard Brook
complex environmental time series using a cumulative sums approach. Valley, New Hampshire. Canadian Journal of Forest Research, 41(7),
MethodsX, 6, 779–787. 1369–1379.You can also read