General-Purpose Monitoring during Speech Production
←
→
Page content transcription
If your browser does not render page correctly, please read the page content below
General-Purpose Monitoring during Speech Production

                                       Stéphanie Riès1, Niels Janssen1,2, Stéphane Dufau1, F.-Xavier Alario1,
                                                                  and Borís Burle1

                                                                                                                                                                                    Downloaded from http://mitprc.silverchair.com/jocn/article-pdf/23/6/1419/1775597/jocn.2010.21467.pdf by guest on 18 May 2021
                     Abstract
                     ■ The concept of “monitoring” refers to our ability to control                           detection process. However, in contrast to its original name,
                     our actions on-line. Monitoring involved in speech production                            advanced processing methods later revealed that this component
                     is often described in psycholinguistic models as an inherent part                        is also present after correct responses in visuomotor tasks. Here,
                     of the language system. We probed the specificity of speech                              we reported the observation of the same negativity after cor-
                     monitoring in two psycholinguistic experiments where electro-                            rect responses across output modalities (manual and vocal re-
                     encephalographic activities were recorded. Our focus was on a                            sponses). This indicates that, in language production too, the
                     component previously reported in nonlinguistic manual tasks                              Ne reflects on-line response monitoring rather than error de-
                     and interpreted as a marker of monitoring processes. The error                           tection specifically. Furthermore, the temporal properties of the
                     negativity (Ne, or error-related negativity), thought to originate                       Ne suggest that this monitoring mechanism is engaged before
                     in medial frontal areas, peaks shortly after erroneous responses.                        any auditory feedback. The convergence of our findings with
                     A component of seemingly comparable properties has been                                  those obtained with nonlinguistic tasks suggests that at least part
                     reported, after errors, in tasks requiring access to linguistic knowl-                   of the monitoring involved in speech production is subtended by
                     edge (e.g., speech production), compatible with a generic error-                         a general-purpose mechanism. ■

                     INTRODUCTION
                                                                                                              may be common to speech production and other control
                     The concept of “monitoring” refers to our ability to con-                                situations (e.g., manual responding in forced-choice tasks),
                     trol our actions on-line. Here we investigated the mech-                                 without discarding the possibility that speech-specific mon-
                     anism by which we monitor what we say. Speech is a                                       itoring may also be required.
                     seemingly effortless and highly efficient process: Usually                                  Consistent with Postmaʼs suggestion, functional imag-
                     speech production elicits around one error every 1000 words                              ing (fMRI or PET) of speech monitoring have reported
                     (Levelt, 1989). Yet, we continuously control what we are                                 activities specific to verbal monitoring tasks as well as ac-
                     saying and what we are about to say. This speech monitor-                                tivities common to speech and action monitoring. Most
                     ing ability has been investigated from a psycholinguistic                                of these studies have focused on monitoring of verbal audi-
                     perspective (for detailed reviews, see Postma & Oomen, 2005;                             tory feedback (i.e., the outer loop mentioned above) by
                     Postma, 2000). At stake in this research are issues related to                           manipulating the actual feedback that participants heard
                     the nature of the linguistic representations involved, the                               as they spoke. This research has highlighted the role of
                     possible automaticity of monitoring processes (central or                                the left temporal cortices (for a meta-analysis, see Indefrey
                     attention requiring vs. automatic), and the contrast between                             & Levelt, 2004). Activation of the superior temporal gyrus is
                     monitoring occurring before versus after sounds are actually                             modulated by the nature of distorted auditory feedback
                     produced. This last point has introduced a distinction be-                               (e.g., pitch elevation of the participantʼs own voice; Tourville,
                     tween, respectively, the inner loop, which monitors inner                                Reilly, & Guenther, 2008; Fu et al., 2006; Hashimoto & Sakai,
                     linguistic representations, and the outer loop, relying on                               2003; McGuire, Silbersweig, & Frith, 1996). When normal
                     auditory feedback (e.g., Postma & Oomen, 2005). Beyond                                   and pink-noise-masked feedback are contrasted, activation
                     these considerations, one implicit (occasionally explicit) as-                           in the superior temporal gyrus is attenuated in the normal
                     sumption that is commonly made is to consider speech                                     situation, whereas there is increased activity in other tem-
                     monitoring as an inherent part of the language processing                                poral regions and in the medial frontal cortex, including
                     system. For example, Postmaʼs (2000) review suggests that a                              the ACC and the SMA (Christoffels, Formisano, & Schiller,
                     central perception-based monitor (as defined in Levelt, 1989)                            2007). In another type of experiment, involving a verb gen-
                                                                                                              eration task where participants produced a verb of their
                                                                                                              choice in response to a noun, ACC activity was associated
                                                                                                              with verbal response conflict monitoring (Barch, Braver,
                     1
                      Aix-Marseille Université & CNRS, Marseille, France, 2Universi-                          Sabb, & Noll, 2000; for a full theoretical development, see
                     dad de La Laguna, Tenerife, Spain                                                        Botvinick, Braver, Barch, Carter, & Cohen, 2001). In the tasks

                     © 2011 Massachusetts Institute of Technology                                                    Journal of Cognitive Neuroscience 23:6, pp. 1419–1436
Downloaded from http://www.mitpressjournals.org/doi/pdf/10.1162/jocn.2010.21467 by guest on 08 October 2021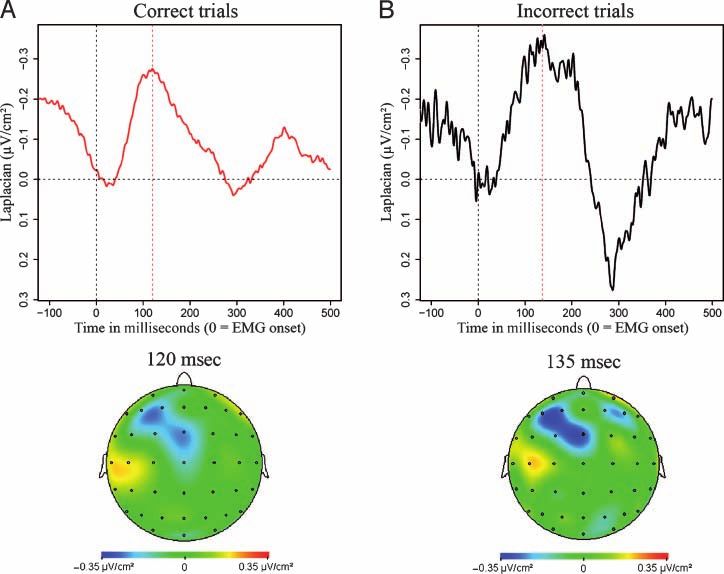
used in the study of Christoffels et al. (2007), investigations                              After the Ne, a positive component named the “error pos-
                 of functional connectivity between temporal and medial-                                      itivity” (Pe) was described. Contrarily to the Ne, the Pe is
                 frontal regions suggest that their activations are inversely                                 present only when the subject is conscious of his error
                 related (Van de Ven, Esposito, & Christoffels, 2009).                                        (Endrass, Reuter, & Kathmann, 2007; OʼConnell et al., 2007;
                    In manual nonlinguistic studies of response monitoring,                                   Nieuwenhuis, Ridderinkhof, Blom, Band, & Kok, 2001).
                 the involvement of medial frontal cortex has been repeat-                                    The Ne component was first reported on nonverbal erro-
                 edly observed (for a review, see Ridderinkhof, Ullsperger,                                   neous responses (Gehring et al., 1993; Falkenstein et al.,
                 Crone, & Nieuwenhuis, 2004). ACC activity appears to be                                      1991); accordingly, it was first related to an error-detection
                 modulated by the degree of competition between alter-                                        process. However, an Ne-like wave has been reported on
                 native responses and has been linked to response conflict                                    both correct and erroneous trials during nonverbal tasks

                                                                                                                                                                                 Downloaded from http://mitprc.silverchair.com/jocn/article-pdf/23/6/1419/1775597/jocn.2010.21467.pdf by guest on 18 May 2021
                 monitoring (Carter et al., 1998; see, however, Burle, Roger,                                 (Bartholow et al., 2005; Vidal, Burle, Bonnet, Grapperon, &
                 Allain, Vidal, & Hasbroucq, 2008). To our knowledge,                                         Hasbroucq, 2003; Vidal, Hasbroucq, Grapperon, & Bonnet,
                 the recruitment of the temporal cortices has solely been                                     2000). The Ne-like wave on correct trials was smaller, reached
                 reported when speech monitoring was involved. One                                            its maximum of negativity slightly earlier than on erroneous
                 plausible interpretation of these findings from speech                                       trials, and was typically followed by a second, generally
                 and manual nonlinguistic response monitoring is that me-                                     smaller negativity. The topographical distribution of Ne-like
                 dial frontal regions correspond to an aspecific monitoring                                   waves is fronto-central, just as it is on erroneous trials. The
                 process (as suggested by Christoffels et al., 2007; Barch                                    Ne-like waves observed on correct trials and errors were in-
                 et al., 2000), whereas the temporal cortex responds to audi-                                 terpreted to be of comparable origin (Roger, Bénar, Vidal,
                 tory linguistic processing (Hickok & Poeppel, 2000). How-                                    Hasbroucq, & Burle, 2010). This suggests that the Ne reflects
                 ever, activities in the temporal cortices and in the ACC                                     a response monitoring system, secondarily leading to error
                 seem both modulated by auditory feedback (Christoffels                                       detection rather than error detection in itself. The early onset
                 et al., 2007). Indeed, it is not clear from these studies which                              of this component, along with data collected on a completely
                 and whether these brain regions could be involved in inner                                   deafferented patient (Allain, Hasbroucq, Burle, Grapperon,
                 speech monitoring. Also, a limitation of some of these stud-                                 & Vidal, 2004), indicates that it is dissociated from sensory
                 ies is that acoustic distortions could promote enhanced                                      feedback.
                 aspecific cognitive control, which may not be present in                                        Under the previously formulated working hypothesis
                 normal speech monitoring.                                                                    that medial frontal response monitoring is subtended by
                    Our main aim in the current study was to test for the re-                                 a generic process involved in different cognitive functions,
                 cruitment of an aspecific monitoring system in speech pro-                                   including language, an Ne-like wave should be observed
                 duction using electroencephalography. Given the temporal                                     both on correct and incorrect speech utterances. In con-
                 precision of the method used, we also consider the type of                                   trast with this prediction, the Ne elicited in overt speech
                 representations (related to inner vs. outer speech) this type                                tasks has only been reported after errors (Ganushchak &
                 of common system might monitor. Secondarily, by compar-                                      Schiller, 2008a; Möller et al., 2007; Masaki et al., 2001). Al-
                 ing direct overt speech production to a manual linguistic                                    though this could be due to intrinsic differences between
                 task, we also look for EEG components that may reflect                                       manual and verbal tasks (direct long-term memory vs.
                 monitoring related to overt speech. We hypothesized that                                     arbitrary stimulus/response relationship, differences in re-
                 the study of electrophysiological correlates of speech mon-                                  sponse modalities, etc.), it is also possible that this ab-
                 itoring will help shed light on the specificity of the medial                                sence is related to methodological differences: First, most
                 frontal activity and on the nature of the representations it                                 studies reporting an Ne-like wave on correct nonlinguistic
                 monitors.                                                                                    trials used current source density analysis ( Yordanova,
                    The error negativity (Ne) or error-related negativity has                                 Falkenstein, Hohnsbein, & Kolev, 2004; Vidal et al., 2000,
                 been extensively studied in nonverbal tasks (first reports:                                  2003) that enhances the spatial resolution of the EEG sig-
                 Ne: Falkenstein, Hohnsbein, Hoormann, & Blanke, 1991;                                        nal (Babiloni, Cincotti, Carducci, Rossini, & Babiloni, 2001;
                 error-related negativity: Gehring, Goss, Coles, Meyer, &                                     Gevins, Leong, Smith, Le, & Du, 1995) and reveals small local
                 Donchin, 1993) and more recently in linguistic tasks also                                    activities by removing remote sources contributions (Vidal
                 (Ganushchak & Schiller, 2006, 2008a, 2008b, 2009; Möller,                                    et al., 2003). Because of volume conduction, overlapping
                 Jansma, Rodriguez-Fornells, & Münte, 2007; Sebastian                                         activities hinder the small negativity on correct trials, with
                 Gallés, Rodríguez-Fornells, de Diego-Balaguer, & Díaz,                                       conventional monopolar recordings. As a matter of fact,
                 2006; Masaki, Tanaka, Takasawa, & Yamazaki, 2001). The                                       studies that did not report an Ne-like wave on correct
                 Ne has been shown to originate in the ACC and/or the                                         trials were not based on the analysis of current source den-
                 SMA (e.g., Debener et al., 2005; Dehaene, Posner, & Tucker,                                  sity. Furthermore, because the Ne-like wave on correct
                 1994). It consists of an event-related negative potential start-                             trials tends to be smaller in amplitude than on errors, it
                 ing around the onset of the response-related EMG activity                                    is more likely to be masked by articulation-related arti-
                 and peaking between 100 and 150 msec later (the Ne starts                                    facts (Goncharova, McFarland, Vaughan, & Wolpaw, 2003;
                 to rise before response onset when time locked to this event,                                Brooker & Donald, 1980). Articulation-related artifacts are
                 e.g., Falkenstein, Koshlykova, Kiroj, & Hoormann, 1995).                                     probably the main reason why speech monitoring has been

                 1420         Journal of Cognitive Neuroscience                                                                                        Volume 23, Number 6
Downloaded from http://www.mitpressjournals.org/doi/pdf/10.1162/jocn.2010.21467 by guest on 08 October 2021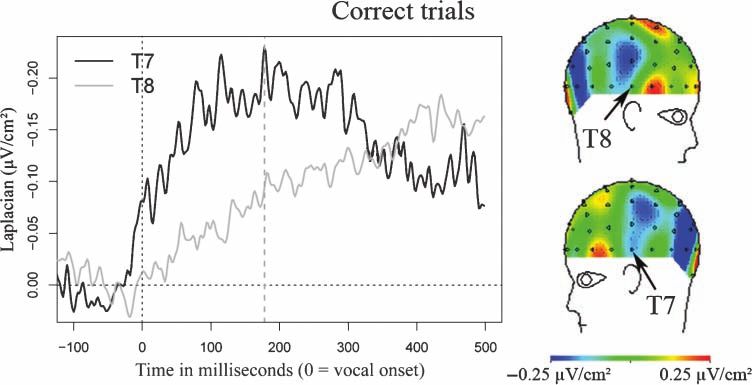
studied in paradigms avoiding overt speech and using man-                                used, in French and other languages, as an index of access
                     ual responses (e.g., Ganushchak & Schiller, 2006, 2008b,                                 to lexical information stored in long-term memory (e.g.,
                     2009). Although these tasks involve linguistic representa-                               Navarette, Basagni, Alario, & Costa, 2006; van Turennout,
                     tions stored in long-term memory, they differ from overt                                 Hagoort, & Brown, 1998). Here participants were asked
                     speech production. Indeed, it is uncertain that the pro-                                 to press a left or a right button depending of the grammati-
                     cesses they engage (including monitoring) are directly com-                              cal gender of the picture names. This task offers a direct
                     parable to those naturally occurring in speech production.                               comparison with nonlinguistic manual tasks and with pre-
                        In any event, an Ne-like wave (or CRN: correct response                               vious studies where it was used to investigate speech moni-
                     negativity) has been reported in two manual linguistic stud-                             toring. Note that in contrast with the two studies that used
                     ies (Ganushchak & Schiller, 2009; Sebastian Gallés et al.,                               manual linguistic tasks and reported an Ne-like wave in cor-

                                                                                                                                                                               Downloaded from http://mitprc.silverchair.com/jocn/article-pdf/23/6/1419/1775597/jocn.2010.21467.pdf by guest on 18 May 2021
                     2006). Both of these experiments tested bilingual sub-                                   rect trials (Ganushchak & Schiller, 2009; Sebastian Gallés
                     jects in elaborate experimental settings, designed to elicit                             et al., 2006), participants were not uncertain of what the
                     high error rates. Moreover, neither of these studies tested                              correct response for each trial was.
                     for the statistical presence of this negativity (see Methods
                     therein). Interestingly, however, both of these studies sug-
                                                                                                              Participants
                     gest that the amplitudes of the negativity reported in cor-
                     rect and erroneous trials increased in case of uncertainty                               Fifteen right-handed native French speakers (8 women)
                     of the response. This finding suggests that the Ne and the                               with normal or corrected-to-normal vision participated in
                     Ne-like wave could be components reflecting a similar pro-                               the experiment (mean age = 21.8 years). The data of five
                     cess, although this was not assessed in these studies.                                   participants were removed from the behavioral and electro-
                        We report below two experiments that test for the pres-                               physiological analysis because of problems during the EEG
                     ence of postresponse activities with a special focus on the                              recordings (too many artifacts around the response or too
                     Ne-like wave after correct trials. We used two distinct lin-                             much noise on fronto-central electrodes).
                     guistic tasks: a grammatical gender decision task (manual
                     responses) and an overt picture-naming task (speech pro-
                                                                                                              Materials and Design
                     duction). The fMRI results discussed above suggest that the
                     medial frontal cortex activity, reported in both speech and                              The stimuli were line drawings of common objects selected
                     nonspeech monitoring and supposedly reflected by the                                     from published collections (Bonin, Peereman, Malardier,
                     Ne, may be shared across different cognitive functions.                                  Mot, & Chalard, 2003; Alario & Ferrand, 1999) or designed
                     If the Ne reflects a generic monitoring system also used                                 by us for the experiment. Their name agreement was above
                     for speech monitoring, then an Ne-like wave should be                                    70%. The stimuli were presented in black on an 11 × 11-cm
                     observed on correct speech utterances, pending methodo-                                  white square, within a visual angle of 2.22°. The experi-
                     logical improvements (see below). Moreover, the timing of                                ment was controlled by a microcomputer running Tscope
                     theses waves may be informative about the distinction                                    (Stevens, Lammertyn, Verbruggen, & Vandierendonk, 2006).
                     usually made between inner and outer loops in speech                                     A total of 116 drawings were used: 108 were the experi-
                     monitoring tasks. For example, if the time course of this                                mental items and 8 were used in warm-up trials.1 Half of
                     negativity is comparable with that of the Ne reported in                                 the experimental items had a feminine grammatical gender
                     previous studies (the Ne starts to rise before the response),                            and half had a masculine grammatical gender (for more in-
                     it will be unlikely that it depends on auditory feedback link-                           formation, see Appendix).
                     ing it preferentially to inner speech monitoring (Postma,                                   Each experimental run comprised 110 trials: Two of the
                     2000). This would be consistent with the property of Ne                                  eight warm-up items were followed by the 108 experi-
                     observed in nonlinguistic tasks to be independent from                                   mental items. Each participant was tested on eight runs.
                     sensory feedback. Finally, given the fMRI results described                                 Within each experimental run, the order in which the
                     above, we will also look for EEG activities on electrodes lo-                            groups of items were presented was mixed pseudoran-
                     cated over the temporal cortices. However, this type of                                  domly using the software MIX ( Van Casteren & Davis,
                     activity has not yet been reported using current source                                  2006). There were never more than four identical expected
                     density analysis and will have to be more cautiously inter-                              responses (left thumb or right thumb, for picture names
                     preted than the better-known medial frontal activity.                                    having masculine or feminine grammatical gender, respec-
                                                                                                              tively) in a row, and two consecutive items were never
                                                                                                              phonologically related (i.e., two pictures in a row never
                     METHODS                                                                                  had the same initial phoneme).

                     Experiment 1
                                                                                                              Procedure
                     In French, nouns are either of masculine or of feminine
                     grammatical gender. To a large extent, this feature is an                                Overall, the experiment lasted for about 3 hours. Participants
                     arbitrary property of the nouns (Corbett, 1991). Accord-                                 were tested in a sound-attenuated dimly lit environment.
                     ingly, access to grammatical gender has been repeatedly                                  They were seated in a Faraday cage in front of a screen. They

                                                                                                                                                        Riès et al.    1421
Downloaded from http://www.mitpressjournals.org/doi/pdf/10.1162/jocn.2010.21467 by guest on 08 October 2021
held vertical handgrips on top of which response buttons Flachenecker, Daumer, & Wolf, 2001; Van Boxtel, Geraats,
were fixed. van den Berg-Lenssen, & Brunia, 1993).
Participants were asked to perform two tasks during No responses, that is, trials where the participant did
independent/separate blocks: an object orientation task, not answer within the 1500 msec limit, were removed
which will not be detailed here, and a grammatical-gender from further analysis. Trials were classified as correct or
decision task where participants had to press the right but- erroneous depending on whether the correct or the incor-
ton if the name of the picture was feminine and the left one rect button was pressed first. Among correct trials, those
if the name of the picture was masculine. Participants were containing only one EMG activation on the correct side
instructed to answer as fast and as accurately as possible (referred to as “pure correct” trials) were distinguished
and to keep their thumbs on the response buttons at all from those containing one EMG activation on the incor-
Downloaded from http://mitprc.silverchair.com/jocn/article-pdf/23/6/1419/1775597/jocn.2010.21467.pdf by guest on 18 May 2021
time to minimize RTs. They were also asked to remain as rect side preceding an EMG activation on the correct side
relaxed as possible and to avoid making movements that (partial errors, see, e.g., Burle, Possamaï, Vidal, Bonnet, &
could generate artifacts on the EEG recordings (e.g., eye Hasbroucq, 2002). Clear errors were defined as trials where
blinks, frowning) during the experimental trials. only one EMG activation was observed on the incorrect
A trial consisted of the following events: (1) a fixation side. RTs was taken as the time between stimulus pre-
point (“plus” sign) for 500 msec, (2) the picture appeared sentation and EMG onset (either correct or incorrect for,
and remained on the screen until the participants re- respectively, pure correct trials and errors). EEG data cor-
sponded or after a deadline of 1500 msec was reached, responding to pure error trials and to “pure correct” trials
and (3) a blank screen for 1000 msec. The next trial started were averaged separately, first for each subject, and then a
automatically. grand-average time locked to EMG onset was performed.
There were three parts in the experiment. First, partici- Laplacian transformation (which provides an estimate
pants were familiarized with the 116 drawings used in the of the current source density), as implemented in Brain-
experiment. These were presented one by one in a random Analyser™ (Brain Products, Munich, Germany), was ap-
order, and the participant was asked to name each picture. plied on the individual averages, and a grand average
The experimenter made verbal corrections when an in- was created from those individual averages. Laplacian
correct or an unexpected response was produced. Second, transformation has been shown to increase the spatial
there was a practice phase in which participants performed resolution of the signal providing a good estimation of
one block of the task they had to perform in the experi- the corticogram (Nuñez, 1981). The signal was first inter-
ment proper. Third, the experiment proper started and polated with the spherical spline interpolation procedure,
lasted for about an hour. then second derivatives in two dimensions of space were
computed (Legendre polynomial: 15° maximum). We
chose 3 for the degree of spline because this value mini-
Electrophysiological Recordings
mizes errors (Perrin, Bertrand, & Pernier, 1987). We as-
The EEG was recorded from 64 Ag/AgCl Active-2 pre- sumed a radius of 10 cm for the sphere representing the
amplified electrodes (BIOSEMI, Amsterdam; 10–20 system head. The resulting unit was μV/cm2. A 100-Hz low-pass fil-
positions). The sampling rate was 1024 Hz (filters: DC to ter was applied off-line on the EEG data.
208 Hz, 3 db/octave). The passive reference electrode
was placed over the left mastoid. The vertical EOG was
Analysis
recorded by means of two surface electrodes (Ag/AgCl) just
above and below the left eye, respectively. The horizontal The analysis included the factor “accuracy” (correct or
EOG was recorded with two electrodes positioned over error) and “participants” as random effect. The behavioral
the two outer canthi. For each hand, the EMG activity of data were analyzed using Studentʼs t tests or ANOVAs for
the flexor pollicis brevis was recorded by means of two sur- comparisons of more than two means. Concerning the ac-
face electrodes (Ag/AgCl) glued to the skin of the thenar curacy analysis, the pure correct trials were compared with
eminence. The distance between the two EMG electrodes the pure error trials.
was 2 cm. For the EEG data, analysis were performed on three
electrode sites of interest: FCz, where the Ne and Ne-like
waves have been described (Vidal et al., 2000), and T7 and
Data Processing
T8, over the left and the right temporal cortices because
After acquisition, the EEG and the EMG data were filtered these regions have also been proposed to be involved in
(EEG: high pass = 0.16 Hz; EMG: high pass = 10 Hz). speech monitoring. We performed statistical analysis on
Eye movement artifacts were corrected using the statistical three types of measures obtained from the Laplacian trans-
method of Gratton, Coles, and Donchin (1983). All other formed data: (1) the latency of the peaks of interest, (2)
artifacts were rejected after a trial-by-trial visual inspection the peak-to-peak amplitude (i.e., the difference between
of monopolar recordings. The onset of EMG was marked the amplitude of two consecutive peaks of activity), and
manually after visual inspection, a method that is noto- (3) the slopes of the activity in the windows of interest.
riously more accurate than automated algorithms (Staude, Latencies were measured on smoothed data (the length
1422 Journal of Cognitive Neuroscience Volume 23, Number 6
Downloaded from http://www.mitpressjournals.org/doi/pdf/10.1162/jocn.2010.21467 by guest on 08 October 2021of the smoothing window was 40 msec) to minimize the thermore, we addressed the problem of articulation-
impact of background noise. The peak-to-peak amplitude related artifacts (most notably, EMG activity) with a blind
was preferred over simple amplitude measurements as it source separation algorithm. This was expected to dis-
is independent from the chosen baseline. Let us consider criminate the bursts of EMG activity linked to articulation
the Ne: The peak-to-peak amplitude measured here is the from the EEG signal. This method has shown successful
difference between the considered negativity and the pre- results for tonic EMG activity induced by epileptic sei-
ceding positive peak. To reduce the impact of background zures (De Clercq, Vergult, Vanrumste, Van Paesschen, &
noise on the performed measures, peak-to-peak ampli- Van Huffel, 2006) and has been adapted to the situation we
tudes were measured as follows: The latencies of the Ne are facing here (De Vos et al., 2010; Vanderperren et al.,
and the preceding positive peak were measured for each 2008).
Downloaded from http://mitprc.silverchair.com/jocn/article-pdf/23/6/1419/1775597/jocn.2010.21467.pdf by guest on 18 May 2021
participant for correct and incorrect trials. A 40-msec fixed
time window was then determined around the averaged
latency for the positive dip (respectively, the negative Participants
peak), providing an identical baseline for errors and cor- A total of 16 right-handed native French speakers (7 wom-
rect trials. The surfaces between the curves and the base- en) with normal or corrected-to-normal vision participated
line were measured for each participant during this time in the experiment (mean age = 23.6 years). None of these
window. Finally, the difference between the surface mea- participants participated in Experiment 1. The data of four
sured around the preceding positivity and around the Ne participants were removed from the behavioral and the elec-
was computed, and it is this surface difference that we will trophysiological analysis because of problems during the
refer to as the peak-to-peak amplitude. Slopes were mea- EEG recordings (similar reasons to those of Experiment 1).
sured, by fitting a linear regression to the data, to attest for
the existence of a component by comparing them to zero.
This measure was chosen as it is also independent for Materials and Design
the baseline and it gives morphological information about
the data (see Carbonnell, Hasbroucq, Grapperon, & Vidal, Forty-five line drawings of common objects were used as
2004). They were measured on a time window between stimuli (Alario & Ferrand, 1999). They had a mean name
the average latency value of the first positive dip and the agreement of 96% and were displayed as in the previous
average latency value of the negativity. Such slope mea- experiment (for more information, see Appendix). There
sures were not made in the two linguistic manual tasks re- were 10 experimental runs. Each of the 45 experimental
porting an Ne-like wave on correct trials (Ganushchak & items appeared in a pseudorandom order twice per block
Schiller, 2009; Sebastian Gallés et al., 2006). What these such that two consecutive items were semantically and
authors reported are comparisons between surface mea- phonologically unrelated.
sures. However, the statistical existence of these surfaces
was not tested (i.e., significantly different from zero and
Procedure
therefore from background noise). Here, we wanted to
make the statistical presence of activities explicit. For the The experiment was controlled by the software Eprime 2.0
negativity observed at electrode T7, the same type of mea- (Psychology Software Tools, Inc., Pittsburgh, PA), which
sures were performed. allows on-line recording and voice-key triggering of the
All the abovementioned measures were compared using participantsʼ verbal responses. The participantʼs task was
exact Wilcoxon signed-rank tests (also known as Wilcoxon to name the pictures presented as fast and as accurately
T tests) because the measures were based on few error as possible. For the reasons stated in Vidal et al. (2000), par-
trials errors and the normality of the data could not be ticipants were informed that no correction was possible in
assumed. Following Siegel (1956), we reported Wilcoxon the case of errors.
T values, corresponding to the sum of the absolute values A trial consisted of the same events as in Experiment 1,
of the ranks of the least represented sign, and the asso- except that participants named the pictures aloud instead
ciated p values. of providing the grammatical gender. Response latencies
were measured from the onset of the stimulus to the be-
ginning of the vocal response by means of a voice key (con-
Experiment 2
tained in Eprime 2.0). The accuracy of this measure was
Overt picture naming requires lexical access and oral re- checked visually and corrected when necessary, with the
sponses. It is one of the most commonly used tasks to study software CheckVocal (Protopapas, 2005).
overt speech. Because we wanted to compare our results There were three phases in the experiment. First, par-
with those reporting the presence of an Ne-like wave on ticipants were familiarized with the materials as in Experi-
correct trials, we used a comparable methodology. We cal- ment 1. Second, the piezoelectric microphone sensitivity
culated the surface Laplacian transformation of the EEG was tested and adjusted to the voice of the participant
data, enabling to reveal small but consistent activities hin- while he or she was reading words presented on the screen.
dered by remote source in monopolar recordings. Fur- Third, the experimental instructions were delivered and
Riès et al. 1423
Downloaded from http://www.mitpressjournals.org/doi/pdf/10.1162/jocn.2010.21467 by guest on 08 October 2021the experiment started. The experimental session lasted for Analysis
about an hour. There was a short break after each run.
The behavioral and the EEG data were analyzed as in Ex-
periment 1, except that the only factor in the behavioral
analysis was “accuracy”.
Electrophysiological Recordings
They were as in Experiment 1, except for the following
points. The sampling rate was 512 Hz (filters: DC to
104 Hz, 3 db/octave). The passive reference was obtained RESULTS
by off-line averaging the signal recorded over the left and
Downloaded from http://mitprc.silverchair.com/jocn/article-pdf/23/6/1419/1775597/jocn.2010.21467.pdf by guest on 18 May 2021
right mastoids. Experiment 1
Behavioral Data
The average RT was 591 msec (σ = 109 msec) for “pure”
Data Processing correct trials and 595 msec (σ = 126 msec) for “pure”
Trials where recording failures occurred, for example, errors (defined in the Methods section). There was no
when the voice key triggered for a reason not linked to effect of accuracy on RTs, t(9) = −0.23. The average error
the participantʼs voice or when the participant did not rate was 9.3% (σ = 5.9%). On average, 91% of pure correct
answer within the 1500-msec limit, were removed from trials (σ = 9.3%) and 88% of clear errors (σ = 12%) were
further analysis. Trials were coded as errors when the left after artifact rejection.
participant produced any kind of verbal error: partial or
complete production of incorrect words, verbal disflu-
encies (stuttering, utterance repairs, etc.). These errors
Electrophysiological Data
were all coded in a single category. Incorrect trials could
also be made of two utterances, the first one being a par- On correct trials, Laplacians showed a clear negativity peak-
tial or complete error and the second one being correct ing on average 124 msec after EMG onset (σ = 26 msec;
in most cases. All were included in the general “error” Figure 1A). The Laplacian cartography indicates that this
category. Importantly, the marker indicating the onset negativity reaches its maximum fronto-centrally, around
of the error was always placed at the beginning of the electrode FCz. On the time window spanning from 30 to
sound waveform of the first utterance. 110 msec, post-EMG onset slopes were significantly dif-
After acquisition, filtering, and correction of eye move- ferent from 0, T(10) = 0, p < .01. On incorrect trials, we
ment artifacts, we used a blind source separation algorithm observed a negativity peaking on average 147 msec (σ =
on the basis of canonical correlation analysis (BSS-CCA; 30 msec) post-EMG onset (Figure 1B). The Laplacian car-
De Clercq et al., 2006) to reduce the EMG artifacts induced tography indicates that it reaches its maximum fronto-
by articulation. The suitability of BSS-CCA for distinguish- centrally, especially around electrode FCz. The slopes
ing articulatory EMG bursts from EEG signal with consid- measured on the same time window as on correct trials
erably improved signal to noise ratio is shown in De Vos were significantly different from 0, T(10) = 2, p < .01.
et al. (2010). In this application, the BSS-CCA method We then compared errors and correct trials. The laten-
was applied on nonoverlapping consecutive windows of cies measured were not significantly different for the con-
1.5 sec corresponding to the duration of a trial (by means sidered positivity (positive dip latency on errors: 14 msec
of the EEGLAB plug-in Automatic Artifact Removal imple- post-EMG onset, σ = 44 msec; on correct trials: 25 msec,
mented by Gómez-Herrero available at http://www.cs.tut.fi/ σ = 20 msec; T(10) = 21, p = .56; average = 20 msec
∼gomezher/projects/eeg/software.htm#aar). Components post-EMG onset; σ = 34 msec). However, the negativity
were separated on the basis of their degree of autocorrela- observed on correct trials peaked before the negativity
tion (EMG activity tends to have low autocorrelation), and observed on errors, T(10) = 0, p < .01 (average latency
EMG components were selected according to their power of the negative peak for correct trials = 124 msec, σ =
spectral density. Components were considered to be EMG 26 msec; average latency of the negative peak for errors =
activity if their average power in the EMG band was five 147 msec, σ = 30 msec), in agreement with previous
times bigger than the average power in the EEG band. This reports (e.g., Roger et al., 2010).
method provided satisfying results on our data (for details, The amplitude of the negativity on correct trials was
see De Vos et al., 2010; Vanderperren et al., 2008). smaller than the amplitude of the negativity observed
After applying the BSS-CCA, all other artifacts were man- on incorrect trials, T(10) = 3, p < .01 (average for correct
ually rejected (as in Experiment 1). Then, the remaining trials = −0.30 μV/cm2, σ = .16; average for errors =
monopolar recordings were averaged time locked to vocal −0.44 μV/cm2, σ = .16; see Figure 2 for individual data).
onset. Finally, Laplacian transformation was applied on these After the first negativity, we observed a positivity on
averages using the same parameters as in Experiment 1. A errors but not on correct trials (greater positive slope on
100-Hz low-pass filter was applied off-line on the EEG data errors: T(10) = 4, p < .05, time window = 170–270 msec
as for Experiment 1. post-EMG onset; see Figure 1).
1424 Journal of Cognitive Neuroscience Volume 23, Number 6
Downloaded from http://www.mitpressjournals.org/doi/pdf/10.1162/jocn.2010.21467 by guest on 08 October 2021Figure 1. Ne on correct trials
(A) and in errors (B) EEG
activity after surface Laplacian
transformation, recorded over
FCz on (A) correct trials and
(B) errors. Zero of time
corresponds to EMG onset.
Below the temporal data,
the cartographies of this
negativity time locked to EMG
onset. These cartographies
Downloaded from http://mitprc.silverchair.com/jocn/article-pdf/23/6/1419/1775597/jocn.2010.21467.pdf by guest on 18 May 2021
show the average of the spatial
distribution of this activity
on a 40-msec time window
centered around the maximum
of the peak of the grand average
(on correct trials, 125 msec
post-EMG onset; on errors,
136 msec post-EMG onset).
The baseline was the 100 msec
preceding the EMG onset
as the activity of interest
followed EMG onset. For
the topographies, the EEG
data were mirrored so that
the response given was
always right-handed. The
lateralized activity therefore
appears contralaterally to the
response as described in Roger
et al. (2010). Electrodes P7 and P8 were removed for all participants because they were too noisy for 1 of the 10 participants included in the
analysis, and they could have induced an incorrect spline interpolation.
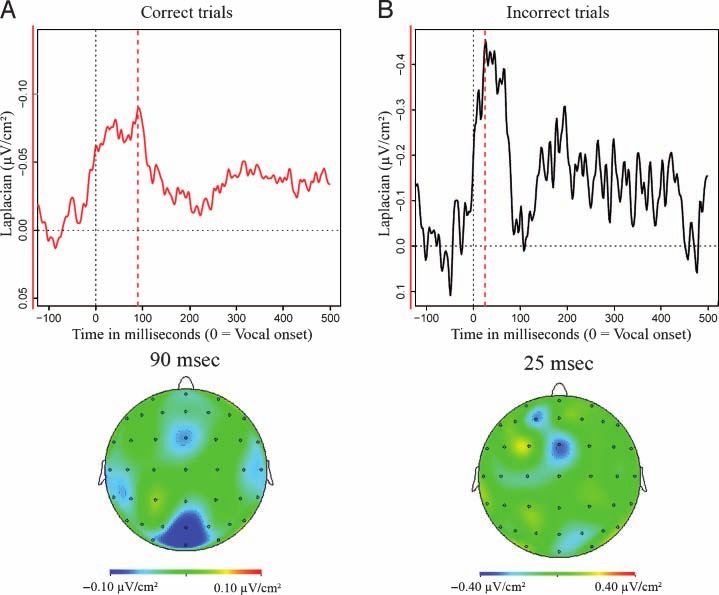
Experiment 2 onset (σ = 24 msec; Figure 3B). The Laplacian cartog-
Behavioral Data raphy showing the spatial distribution of this negativity at
its maximum on the grand average (25 msec) indicates that
Overall 0.48% of the trials were removed from further
analysis (due to no responses or voice key problems).
The average error rate was 1.31% (σ = 0.96%). Fifty-five
percent of errors were made of two or more responses
(e.g., hesitations with filler “hum” sounds). Three partici-
pants made less than five errors throughout the experi-
ment. They were therefore excluded from the error and
from the comparison between erroneous and correct trials
analysis. The average RT for correct trials was 651 msec (σ =
72 msec). The average RT for incorrect trials was 682 msec
(σ = 109 msec). The trend for errors to yield a longer RT
than correct trials was not significant, t(8) = −0.44, p = .674.
Electrophysiological Data
On correct trials, we observed a negativity peaking 44 msec
after vocal onset on average (σ = 41 msec; see Figure 3A).
The Laplacian cartography at the maximum of the negativity
on the grand average (90 msec) indicates that it reached its
maximum fronto-centrally, especially around electrode FCz.
We then tested the existence of this negativity on the time
window spanning from 40 msec prevocal onset to 40 msec
postvocal onset (determined as in Experiment 1). The slopes
were significantly different from 0, T(12) = 13, p < .05. Figure 2. Comparison of the amplitude of the negativity observed
On incorrect trials, a clear negativity was observed fronto- on correct trials (x-axis) to that observed on errors ( y-axis). Each
centrally (on FCz) peaking on average 34 msec after vocal point represents a participant.
Riès et al. 1425
Downloaded from http://www.mitpressjournals.org/doi/pdf/10.1162/jocn.2010.21467 by guest on 08 October 2021Figure 3. EEG activity after
surface Laplacian transformation,
recorded over FCz in (A) correct
trials and (B) errors. Zero of time
corresponds to vocal onset. To
see the activities more clearly,
a 3-Hz high-pass filter was
applied to the EEG data, and
the scale of the vertical axis is
three times bigger for correct
trials. Below the temporal data
Downloaded from http://mitprc.silverchair.com/jocn/article-pdf/23/6/1419/1775597/jocn.2010.21467.pdf by guest on 18 May 2021
are the average cartographies
corresponding to this activity
at the averageʼs maximum of
negativity on a 40-msec time
window centered around the
maximum of the peak of the
grand average. The baseline
was the 100 msec preceding
vocal onset as the activity of
interest followed vocal onset.
Electrodes P9 and P10 were
removed for all participants
as they were too noisy for
one of the 12 participants.
it is also maximum fronto-centrally, around the electrode but no clear maximum was reached within 500 msec after
FCz. Slopes were different from 0, T(9) = 6, p = .05, on vocal onset (see Figure 5). Unfortunately, on errors, the
the same window as considered for correct trials. EEG data at these electrode sites were too noisy to enable
To compare correct trials to incorrect trials, only the nine the observation of this type of activity.
participants who made more than five errors were consid-
ered. On correct trials, the negativity peaked about the
same latency, T(9) = 16, p = .50, after vocal onset as on
errors as well as the preceding positivity (on errors: 46 msec
before vocal onset, σ = 52 msec; on correct trials: 58 msec
before vocal onset, σ = 36 msec; T(9) = 15, p = .43; aver-
age: 53 msec before vocal onset, σ = 43 msec). As ex-
pected, the amplitude of the negativity on correct trials
was weaker than the amplitude of the negativity observed
on incorrect trials, T(9) = 0, p < .01 (average for correct
trials = −0.12 μV/cm2, σ = .07; average for errors =
−0.64 μV/cm2, σ = .77; see Figure 4 for individual data).
In this experiment, on errors, no positivity was visible
after the first negativity. Instead, we observed a second
negativity peaking at about 200 msec postvocal onset, we
will comment this component in the discussion.
Because temporal regions have also been proposed to be
involved in speech monitoring (e.g., Indefrey & Levelt,
2004), we investigated possible activities on electrodes
above those regions as they could correspond to speech
monitoring. A left-lateralized temporal activity at electrode
T7 was observed on correct trials (starting on average
48 msec before vocal onset, σ = 37 msec, and reaching its Figure 4. Comparison of the amplitude of the negativity observed
maximum 216 msec after vocal onset, σ = 85 msec). On the on correct trials (x-axis) to that observed on errors ( y-axis). Each
contra-lateral site, T8, there was a very slow negative slope point represents a participant.
1426 Journal of Cognitive Neuroscience Volume 23, Number 6
Downloaded from http://www.mitpressjournals.org/doi/pdf/10.1162/jocn.2010.21467 by guest on 08 October 2021Figure 5. EEG activity after
surface Laplacian transformation,
recorded over T7 (black line)
and T8 (gray line) in correct
trials (EEG data were too
noisy in errors). Zero of time
corresponds to vocal onset.
Below the temporal data, the
cartographies showing average
of the spatial distribution of
this activity on a 40-msec time
Downloaded from http://mitprc.silverchair.com/jocn/article-pdf/23/6/1419/1775597/jocn.2010.21467.pdf by guest on 18 May 2021
window centered around the
maximum of the peak of the
grand average (i.e., 270 msec
post-vocal onset on errors,
290 msec post-EMG onset,
electrodes P7 and P8 removed).
At electrode T7, the slope of the negativity was signifi- Ganushchak & Schiller, 2006, 2008b). Our observations
cantly different from zero on a time window going from further suggest that the negative component after correct
20 msec before vocal onset until 80 msec after response trials is the Ne-like wave reported mainly in nonlinguistic
onset (time window corresponding to the part of the manual tasks (Roger et al., 2010; Bartholow et al., 2005;
curve that had the strongest slope on the grand average), Vidal et al., 2000, 2003) and incidentally in linguistic tasks
T(12) = 13, p < .05. At electrode T8, the slope of the (Ganushchak & Schiller, 2009; Sebastian Gallés et al., 2006).
EEG data on the same time window was not significantly In Experiment 2, the negativity observed on correct trials
different from zero, T(12) = 24, p = .26. was clearly smaller than on erroneous trials, matching pre-
vious results (see earlier references). The negative wave
after incorrect utterances peaked in the same latency range
as in Ganushchak and Schiller (2008a) and Masaki et al.
DISCUSSION
(2001), that is, between 50 and 100 msec postvocal on-
In line with our main prediction, electrophysiological data set. The peak of the negativity was reached earlier in Ex-
revealed the presence of a post-response fronto-central periment 2 than in Experiment 1; this difference likely
negative wave on both errors and correct trials. The shape, stems from the response marker on which the EEG data
latency, and local topography of this negativity were quite were averaged (vocal onset in Experiment 2, EMG onset
similar for errors and correct trials. Moreover, the local in Experiment 1). In the correct trials of this experiment,
topographies of both negativities were fronto-central (Fig- we also observed a left temporal activity starting to rise
ures 1 and 3). Surface Laplacian transformation indicated slightly before vocal onset and reaching its maximum about
a delimitation of this topography around FCz, which can 200 msec after vocal onset (data were too noisy on errors).
correspond to the SMA/ACC origin as suggested by Möller Here again, the characteristics of the fronto-central nega-
et al. (2007) and by Dehaene et al. (1994). Finally, as had tive wave observed on errors correspond to the Ne re-
previously been observed in nonlinguistic tasks, the negativ- ported previously in overt speech errors (Ganushchak &
ity on correct trials was smaller than on errors (Bartholow Schiller, 2008a; Möller et al., 2007; Masaki et al., 2001).
et al., 2005; Vidal et al., 2000, 2003). These observations We will therefore refer to this component as the Ne wave.
were made in both experiments, with minor variations As above, our observations on correct trials strongly sug-
across experiments detailed below. gest that the negative component is the Ne-like wave re-
In Experiment 1, the negative wave observed after cor- ported in nonlinguistic manual tasks.
rect trials peaked earlier than after errors, consistently with To our knowledge, this is the first observation of an Ne-
nonlinguistic studies (see Roger et al., 2010; Vidal et al., like wave on correct trials in an overt speech production
2000). The difference in amplitude between correct trials experiment. We suggest two methodological explana-
and errors was smaller in our study than in previous stud- tions. First, in covert and overt language studies where
ies. However, as discussed later on, a rather large error rate the Ne was reported, heavy low-pass filters have been ap-
could account for this observation. The negative com- plied on the EEG data (e.g., 1–12 Hz band-pass filters in
ponent observed on errors is undoubtedly the well-known Ganushchak & Schiller, 2006, 2008a, 2008b; 10 Hz low pass
Ne seen in numerous nonlinguistic studies (e.g., Vidal et al., in Masaki et al., 2001). Such severe low-pass filtering is
2000; Falkenstein et al., 1991, 1995; Gehring et al., 1993) and known to distort the EEG signal (Luck, 2005) and especially
in linguistic tasks with manual response modality (e.g., reduces the amplitude of phasic evoked potentials. It is not
Riès et al. 1427
Downloaded from http://www.mitpressjournals.org/doi/pdf/10.1162/jocn.2010.21467 by guest on 08 October 2021surprising that the Ne observed on errors could still be ob- (e.g., Falkenstein et al., 1991; for a review, see Overbeek,
served after such filtering because it generally involves Nieuwenhuis, & Ridderinkhof, 2005). The Pe is clearly pres-
a rather large deflection. By contrast, the Ne observed on ent in Experiment 1 (see Figure 1), but it is absent in Experi-
correct trials, which appears to be smaller, might have been ment 2. Instead, we observed a second negativity peaking
filtered out. The use of such heavy filters was motivated about 200 msec postvocal onset. Remarkably, a similar sec-
in overt language experiments where contamination of ond negativity is also visible in the other studies reporting an
the EEG signal by articulation-induced artifacts was feared. Ne after overt speech errors (Masaki et al., 2001, Figure 2B;
In our study, we did not use such heavy filters because we Ganushchak & Schiller, 2008a, Figures 2 and 3), although it
were able to successfully reduce EMG bursts with the BSS- is not discussed. This suggests that the second negativity
CCA algorithm. Second, the current source density analysis might be a reliable phenomenon.
Downloaded from http://mitprc.silverchair.com/jocn/article-pdf/23/6/1419/1775597/jocn.2010.21467.pdf by guest on 18 May 2021
(Laplacian transformation), acting as a spatial high-pass One tentative interpretation could be that this second
filter, has been shown to remove the low spatial frequency negative component is linked to auditory feedback as the
contribution of remote sources, hence revealing local, well-documented feedback-related negativity (i.e., FRN,
higher spatial frequency activities (Vidal et al., 2003). e.g., Holroyd & Coles, 2002). Indeed, this component is
not observed on incorrect responses of Experiment 1,
where no auditory feedback is available. However, this sec-
ond negativity seems present even when the voice of the
Different Amplitude Ratios between Ne on Errors
subject is masked by pink noise (Masaki et al., 2001), mak-
and Correct Trials
ing this hypothesis less likely. A more plausible explana-
The Ne amplitude ratio between correct and incorrect trials tion might be linked to error correction phenomena. In
was relatively small in Experiment 1 and relatively large in three studies where the Ne is reported in overt speech
Experiment 2. Previous observations have reported large (Ganushchak & Schiller, 2008a; Masaki et al., 2001; and
amplitude ratios ( Vidal et al., 2000, 2003; Falkenstein, our study), incorrect trials included both completely in-
Hoormann, Christ, & Hohnsbein, 2000; Luu, Flaisch, & correct utterances (without any overt self-correction) and
Tucker, 2000). In nonlinguistic tasks, error rate is one partially incorrect utterances followed by an overt self-
of the parameters that affects the amplitude of the Ne: correction. Masaki et al. (2001) mentioned this explicitly.
lower error rates induce larger Ne after incorrect responses We can suppose it is also the case in Ganushchak and
(Falkenstein et al., 2000; Gehring et al., 1993). In manual Schillerʼs (2008a) study, as it is difficult to imagine that their
linguistic studies of speech monitoring, the amplitude of participants made no such errors (no mention of the re-
the Ne is similarly affected by error rate (Ganushchak & moval of trials of this kind, e.g., including two utterances,
Schiller, 2006, 2009) and by time pressure (lower under is made). Notice also that this second negativity is not visi-
time pressure). In the two manual linguistic tasks where ble in the Möller et al. (2007) data, where self-corrected
an Ne-like wave on correct trials was reported, the amplitude trials were not included in the analysis. In a nonlinguistic
was affected by the error rate and by the certainty of the manual task (i.e., Flanker task), Fielher, Ullsperger, and
response (Ganushchak & Schiller, 2009; Sebastian Gallés von Cramon (2005) reported that the Ne is followed by a
et al., 2006). In a phoneme-monitoring task, Ganushchak negativity peaking between 200 and 240 msec in the case
and Schiller (2006) observed a decrease in the amplitude of corrected errors. They interpreted this negativity as an
of the Ne (on errors) under severe time pressure, where error correction process. It is thus possible that the sec-
error rate was higher. Modulations of the Ne-like wave am- ond negativity reported on speech production errors re-
plitude on correct trials have been less studied. We can flect such an error correction process that could mask
speculate that increasing error rates will lead to an ampli- the Pe. Unfortunately, this account is not fully straight-
tude decrease in the Ne on errors and an increase in the forward either. For example, the grand averages in Figure 3
Ne-like wave on correct trials (indeed, with 50% of errors seem to indicate that the second negativity observed on
in a two alternative choice, errors and correct trials would errors is larger than the one observed on correct trials. It
become indistinguishable). Our two studies are com- would remain to be seen whether the accuracy of self-
patible with this tentative proposal because the higher corrections modulates this second component. Our data
error rate in Experiment 1 (compared with Experiment 2) do not allow this detailed analysis.
coincides with an important modulation of the observed Determining whether a Pe follows overt speech errors is
amplitude ratio. Such a link, however, deserves a specific an important but difficult question. Indeed, as reviewed
investigation. above, in all three studies that reported the second nega-
tivity, a Pe might have been masked by this second nega-
tivity. It might also be, however, that the Pe is smaller than
that in manual linguistic tasks or even absent in speech pro-
Post-Ne Activity
duction. As a matter of fact, there is a debate regarding the
On overt errors, the Ne is usually followed by a positivity awareness of the detection and self-correction of speech
peaking about 300 msec post-EMG onset. This positivity, errors (for a review, see Postma, 2000). Because in manual
known as the Pe, is specific to overt and detected errors tasks the Pe occurs only on consciously detected errors
1428 Journal of Cognitive Neuroscience Volume 23, Number 6
Downloaded from http://www.mitpressjournals.org/doi/pdf/10.1162/jocn.2010.21467 by guest on 08 October 2021(Endrass et al., 2007; OʼConnell et al., 2007; Nieuwenhuis The Ne observed in speech production therefore appears
et al., 2001), it might not always be present in speech if to be a valuable tool to study speech monitoring.
some errors are not detected consciously. This would lead The similarity between our findings and previous obser-
to its amplitude reduction on the grand averages. vations suggests that the mechanism reflected by the Ne is
In Experiment 2, we also observed a slowly rising nega- the same in linguistic tasks, which require access to long-
tivity over the left temporal cortex. On the contra-lateral term memory, and in nonlinguistic tasks, which often in-
site, the activity was virtually absent. Similarly to the Ne volve more arbitrary stimulus-response associations. This
and Ne-like wave, this activity started to rise slightly before means that the monitoring process reflected by the Ne
vocal onset. This activity could only be studied on correct can operate over representations involving access to differ-
trials because, on errors, the data were too noisy to assess ent types of memory. This interpretation is in agreement
Downloaded from http://mitprc.silverchair.com/jocn/article-pdf/23/6/1419/1775597/jocn.2010.21467.pdf by guest on 18 May 2021
its existence. We cannot therefore decide whether this with the prediction stated in the Introduction that at least
component is specific to correct trials. However, the fact part of the monitoring involved in speech may not be spe-
that this negativity was clearly observed in the overt cific to speech but may instead be shared across different
picture-naming task but not in the gender decision task is cognitive functions.
of interest. Indeed, the presence of this component could Our data do not rule out that other brain regions may be
be linked to the production of overt speech. A vocalization- implied in speech monitoring. As a matter of fact, we also
related cortical potential has been described (e.g., Wohlert, reported activity in the left-temporal area in the overt
1993; Schafer, 1967). However, this component starts to speech task that seems to be specific to this task. The me-
rise long before vocal onset and its generators (SMA and dial frontal region as well as the temporal cortices has been
bilateral laryngeal motor areas; Galgano & Froud, 2006) associated with verbal self-monitoring in several fMRI stud-
have been identified in regions somewhat incompatible ies (see Introduction). The Ne has been shown to stem
with the topography we reported. An alternative inter- from ACC/SMA region (Roger et al., 2010; Debener et al.,
pretation of this left-lateralized component is to relate it 2005; Van de Veen & Carter, 2002; Dehaene et al., 1994)
to overt speech monitoring, as postulated in the outer- but certainly not from the temporal cortices. Moreover,
loop component of speech monitoring models (Postma, activity in the temporal cortices has not been associated
2000). The topography of this component is in agreement to monitoring outside linguistic studies. Our results would
with the brain regions identified in fMRI studies of speech thus support the hypothesis that speech monitoring com-
monitoring manipulating auditory feedback (see Intro- prises two components: aspecific processes, stemming
duction). The fact that this negativity starts to rise before from the medial-frontal cortex (reflected by the Ne and
the actual vocal onset (20 msec before), however, moder- the Ne-like), which are shared with general action moni-
ates this interpretation. It is possible that this component toring, and language-specific processes originating from
reflects monitoring of both inner representations (e.g., the left temporal cortex.
phonological) and outer speech. However, we are not A critical issue in the study of speech monitoring is to
aware of previous EEG study having reported this type of determine when monitoring takes place. As stated in the
component in overt speech. Possible reasons being again Introduction, most theories of speech monitoring assume
of a methodological order (use of BSS-CCA and Laplacian the involvement of both an inner and an outer loop. The
transformation in our study but not in other language pro- inner loop can detect errors before the utterance is actu-
duction EEG studies). Because we did not assess what ally articulated, as it relies on inner representations. The
parameters could affect this component, we cannot be outer (or auditory) loop goes through the auditory system
certain of the interpretation proposed, and further re- as it depends on auditory feedback to detect errors (e.g.,
search will be needed to clarify this finding. Postma & Oomen, 2005). In their meta-analysis of brain
imaging studies, Indefrey and Levelt (2004) proposed the
left temporal cortex to be the cerebral basis of external
speech monitoring. They argue that the most economical
Implications of Our Observations
assumption would be that the same brain region would
Experiment 1 extended to a linguistic task the observation subserve inner speech monitoring as well. As described
of an Ne-like on correct trials (for previous incidental find- in Introduction, most functional imaging studies (fMRI
ings, see Ganushchak & Schiller, 2009; Sebastian Gallés and PET) have focused on the monitoring of verbal audi-
et al., 2006). More importantly, Experiment 2 extended this tory feedback and do not provide strong arguments for
observation to overt speech production. In the two experi- distinguishing inner and outer speech monitoring.
ments, a fronto-medial negative component after both cor- Electrophysiological evidence may be more appropriate
rect and incorrect trials was observed, at similar latencies, to settle this issue. Masaki et al. (2001) masked the voice of
with similar local topography and with variable amplitudes. their participants by a loud pink noise to avoid the con-
As suggested for nonlinguistic tasks (Roger et al., 2010; tamination of their data by voice-related cortical potentials.
Vidal et al., 2000), this can be taken as an indication that They observed incorrect partial utterances followed by
the Ne observed in linguistic tasks reflects a monitoring corrections, despite the fact that participants could not
mechanism rather than an error-detection phenomenon. hear themselves, suggesting that inner loop monitoring
Riès et al. 1429
Downloaded from http://www.mitpressjournals.org/doi/pdf/10.1162/jocn.2010.21467 by guest on 08 October 2021You can also read