Active Voice Authentication
←
→
Page content transcription
If your browser does not render page correctly, please read the page content below
Active Voice Authentication
                                                Zhong Meng, M Umair Bin Altaf, and Biing-Hwang (Fred) Juang
                                                          Georgia Institute of Technology, Atlanta, GA 30308, USA
arXiv:2004.12071v1 [eess.AS] 25 Apr 2020

                                           Abstract
                                           Active authentication refers to a new mode of identity verification in which
                                           biometric indicators are continuously tested to provide real-time or near real-
                                           time monitoring of an authorized access to a service or use of a device. This is
                                           in contrast to the conventional authentication systems where a single test in
                                           form of a verification token such as a password is performed. In active voice
                                           authentication (AVA), voice is the biometric modality. This paper describes
                                           an ensemble of techniques that make reliable speaker verification possible us-
                                           ing unconventionally short voice test signals. These techniques include model
                                           adaptation and minimum verification error (MVE) training that are tailored
                                           for the extremely short training and testing requirements. A database of 25
                                           speakers is recorded for developing this system. In our off-line evaluation
                                           on this dataset, the system achieves an average windowed-based equal error
                                           rates of 3-4% depending on the model configuration, which is remarkable
                                           considering that only 1 second of voice data is used to make every single
                                           authentication decision. On the NIST SRE 2001 Dataset, the system pro-
                                           vides a 3.88% absolute gain over i-vector when the duration of test segment
                                           is 1 second. A real-time demonstration system has been implemented on
                                           Microsoft Surface Pro.
                                           Keywords:
                                           Active voice authentication, Continuous speaker verification, Hidden
                                           Markov model, Minimum verification error

                                           1. Introduction
                                               User authentication refers to the process of validating a user’s claim of
                                           identity in order to grant or deny the user access to a device or service.
                                           The prevalent method for user authentication operates in predominantly the
                                           so-called gatekeeper mode, in that the guarding system asks the user to

                                           Preprint submitted to Digital Signal Processing                          April 28, 2020
present what he/she knows (e.g., a password), what he/she has (e.g., a key
or a fob), or what he/she is (e.g., fingerprints, iris scan) for examination in
order to render the decision. Once the access is granted, the device or service
remains “active” until it is signed off or terminated. During the active session,
no action is taken by the guarding system even though the user may have
changed, resulting in security compromises.
An active authentication (AA) system seeks to actively and continuously
validate the identity of the person by making use of his or her unique bio-
metric identifiers without repetitively prompting the user for credentials or
requiring the user to change his/her work-flow during the use of the device or
service. The AA framework differs from a conventional authentication sys-
tem in that it provides a continuous and real-time monitoring of the user’s
identity rather than just a one-shot authentication in form of verifying a test
token as in the gatekeeper mode.
Many biometric identifiers including physiological and behavioral indica-
tors can be used as human characteristics to actively verify the identity of a
user [1]. As the intrinsic attributes, the facial appearance [2], the iris pat-
tern [3], the finger-print [4], the voice pattern [5], the hand geometry [6] and
body’s electric pulse response [7] are widely used as the physiological identi-
fiers while the manner people walk [8], write [9], and type [10] are commonly
used as the behavioral identifiers.
The target modality in this paper is the voice. The voice of a person is
unique. This is because the construction of the articulatory apparatus and
its use that generate and modulate the voice of a talker—the lungs, the vocal
cords, the articulators, etc.—are uniquely configured for a given individual
and this configuration is naturally embedded in the person’s voice charac-
teristics. Thus, in addition to language, voice conveys the latent identity
of its speaker. Human voice is ideally suited for AA as it provides contact-
less authentication; it is straightforward to acquire authentication data from
ubiquitous microphones available on all platforms. An active voice authenti-
cation (AVA) system uses the voice of a person to achieve AA, as the person
uses the phone or any other voice application on a mobile or desktop device.
The AVA system does not interfere with other active authentication methods
on the device and can work in the background with already-installed voice
applications, such as Skype, Voice note or the Phone to provide real-time
continuous monitoring of the user’s identity. AVA can effectively strengthen
the security of the existing voice assistants such as Amazon Alexa, Microsoft
Cortana, Apple Siri and Google Home [11, 12] and enable services which
2involve money transfers. On top of the initial speaker verification using the
starting anchor (wake) word, AVA continues to repeatedly authenticate the
user’s voice as the conversation goes on and reserves the right to overturn its
initial decision at any time.
Recently, voice has been successfully used to assist the other biometrics
such as body-surface vibrations [13], touch gestures [14] and a combination
of face, mouse and keystroke [15] in performing continuous authentication.
In these works, the voice is authenticated in form of voice commands which
are first stored as audio files and are then verified through support vector
machine (SVM) [13, 14] or vector quantization [15]. Although these systems
perform further authentications after the session is activated, voice only plays
an auxiliary role in protecting the system because the decisions are still made
at utterance (command)-level as in conventional speaker verification with a
low resolution of 3 seconds or more. The other biometrics are necessary for
AA especially when the speaker is not talking. Therefore, these voice-assisted
authentication systems do not meet the requirement of AVA.
As with any AA system, AVA involves two phases, the registration phase
and the authentication phase. During registration, the user being registered
is asked to utter some standard speech material. A set of statistical models is
trained a adapted to signify the user’s voice identity. At active authentication
stage, once AVA system detects a valid voice signal through a voice activity
detector (VAD), it starts continuously evaluating real-time confidence scores
given the speech signal. Depending on the score, the system can grant or
deny the user’s access to the device. If silence is detected to be long than the
latency, AVA can report an authentication score that indicates impostor.
AVA is significantly different from traditional speaker verification task di-
rected and organized by NIST Speaker Recognition Evaluation (SRE). The
goal of AVA is to continuously authenticate the speaker identity with the as-
sumption that change of talker can potentially occur at any instance whereas
in most SREs, such an abrupt change of talker does not happen and its goal is
to produce a final decision after the entire test utterance is obtained. Because
of the large distinction between AVA and the traditional speaker verification,
a new design framework is necessary for the AVA system which we will elab-
orate in Section 2.2. The AVA system integrates the techniques of sequential
training and testing, maximum a posteriori (MAP) adaptation, cohort selec-
tion and minimum verification error (MVE). The major contributions of this
paper are the following:
3• Propose a novel AVA framework that continuously verifies the speaker’s
identity and instantaneously reports verification decisions.
• Propose a window-based short-time sequential testing scheme to ac-
commodate the real-time requirement of AVA.
• Propose a window-based short-segment training scheme to model the
short-time statistics of a speaker’s voice through an HMM and to match
the real-time testing condition.
• Apply MAP adaptation of an speaker-independent (SI) HMM to min-
imize the enrollment data needed for reliable short-time speaker mod-
eling.
• Apply MVE training to further minimize the speaker verification er-
ror on top of MAP. Propose cohort selection method to address the
imbalanced target and impostor data for MVE training.
AVA performs speaker verification using second-long speech signals and
achieves a performance of 3-4% average window-based equal error rate (WEER),
depending on the model configuration. This level of performance, being able
to reasonably authenticate a talker’s claimed identity with 1 second voice,
outperforms conventional techniques, as will be reported in later sections,
and outstrips human capabilities based on the informal observation of our
research group members. A separate talker authentication evaluation on hu-
man performance is necessary to formally establish the comparison. We also
evaluate the proposed methods on NIST SRE 2001 dataset with a large num-
ber of speakers and the proposed system provides a 3.88% absolute gain over
i-vector on the when the duration of test segment is 1 second.
The rest of the paper is organized as follows. In Section 2.1, we briefly
discuss the conventional formulation of the problem of speaker identification
and verification. We explain how the differences between AVA and the tradi-
tional talker verification paradigm would call for a new design methodology.
In Section 2.2, we introduce the challenge of real-time voice authentication,
how it is performed, and why the speaker models need to be trained to match
the test statistics. In Section 2.3, we use window-based EER to evaluate the
performance of the proposed AVA system. In Section 3, we discuss the reg-
istration and the data collection procedure. In Section 4, we evaluate the
i-vector technique for the AVA task. In Section 5, we introduce the archi-
tecture of the training and registration modules of the AVA system and the
4algorithms that are applied to its major components. In Section 6, we discuss
sequential testing in the AVA system. In Section 7, we provide the evaluation
results of the AVA system with different configurations and algorithms.
2. System Description and Technical Issues
2.1. Conventional Voice Authentication
Use of a person’s voice as a biometric indicator requires processing of the
signal to retain a salient representation of the speaker-specific characteristics.
Traditionally, these may include the talker’s source parameters (e.g., range
and dynamics of the pitch contour [16], stress patterns) and the tract pa-
rameters (e.g., the mean behavior of formant frequencies, vocal tract length
[17, 18]). Overall, since these biometric parameters of the voice production
system represent a talker’s intrinsic articulatory characteristics, a substantial
duration of the speech signal is necessary, often in tens of minutes or even
hours [19], to support reliable estimation.
With advances in statistical modeling techniques, such as the hidden
Markov model (HMM), spectral features have become the dominant choice
to discriminate talker-specific voice characteristics [20, 21]. This has allowed
a relative decrease in the duration of the speech material required for training
and testing, though it still remains impractical for real-time monitoring ap-
plications. To address this problem, the traditional authentication approach
is to use a likelihood ratio test with MAP adapted universal background mod-
els (UBM) [22, 23] which are built using Gaussian mixture models (GMMs).
Adaptation techniques are used to update the parameters of a pre-trained
model using the new speech signal. Further, discriminative training meth-
ods are applied to refine the speaker models with the goal of maximizing the
speaker verification performance. In [24], MVE training is proposed to jointly
estimate the target and anti-target speaker models so that the expected num-
ber of verification errors (miss detection and false alarm) on enrollment and
training set are minimized. Similarly, in [25, 26], minimum classification er-
ror (MCE) criterion [27] is used for speaker recognition and identification.
Based on these, the application of SVM in a speaker’s GMM supervector
space [28, 29] yields interesting results by performing a nonlinear mapping
from the input space to an SVM extension space.
More recently, factor analysis methods such as joint factor analysis (JFA)
[30, 31] and i-vectors [32, 33] become the dominant approach for speaker ver-
ification. These approaches try to model the speaker and channel variability
5by projecting speaker dependent GMM mean supervectors onto a space of
reduced dimensionality. In recent years, deep vector (d-vector) [34] approach
has achieved state-of-the-art performance in NIST SREs, in which a deep
neural network (DNN) is trained to classify speaker identities given their
voice at the input. A d-vector is extracted per utterance by averaging the
DNN hidden units to represent a registered speaker or a test utterance for
subsequent speaker verification. Further, an end-to-end loss [35] and a triplet
loss [36] are introduced to learn more relevant embeddings to the speaker ver-
ification task. An attention mechanism is applied to dynamically summarize
the DNN hidden units into speaker embeddings [37]. To improve the noise
robustness, DNN-based speaker embedding is further extended to x-vector
in [38] by performing data augmentation. More recently, adversarial learning
[39] with gradient reversal network [40] has been applied to domain adapta-
tion [41, 42] and domain-invariant training [43, 44, 45] of the DNN acoustic
model [46]. Similarly, it can effectively improve the robustness of the speaker
embeddings by jointly optimizing the DNN speaker classifier and an auxiliary
disriminative network to mini-maximize an adversarial objective [47, 48].
However, these methods are specifically designed and well suited only
for speaker verification tasks within the NIST SRE framework, in which
long speech utterances are used as the material for single individual tests,
ranging in duration from 10s to a few minutes depending on the specific
task (e.g., see the NIST speaker verification tasks in the years 2000-2010
[49].). More specifically, these techniques work well only for modeling the
long-term statistical characteristics of a speaker, which does not coincide
with the short-time testing condition required by the AVA task. In Section
4, we show that the AVA system based on i-vector achieves an excellent
authentication performance when the duration of the test window is long
enough. But the performance degrades rapidly as the test window duration
decreases. In general, many i-vector based systems exhibit sharp performance
degradation [50, 51, 52, 53], when they are tested with short duration (below
5s) utterances. This is understandable as the covariance matrix of the i-vector
is inversely proportional to the number of speech frames per test utterance
and the variance of the i-vector estimate grows directly as the number of
frames in the test utterance decreases [31].
Recently, many approaches have been proposed for speaker verification
with short-duration utterances. By borrowing the idea from speaker-adaptive
training, the authors of [54] propose phone adaptive training (PAT) to learn
a set of transforms that project features into a phoneme-normalized but
6speaker-discriminative space and use the normalized feature to improve speaker
modeling given short-duration enrollment data. To alleviate the large esti-
mation variation of i-vector due to short-duration utterances, uncertainty
propagation is introduced to both the PLDA classifier [55] and the i-vector
extraction [56]. However, these methods only show their effectiveness on test
utterances of about 3 seconds duration and can hardly meet the real-time re-
quirement of AVA. To further overcome the mismatched prior distributions of
the data used to train UBM and short-duration enrollment data, [57] divides
the speech signal into several subregions defined by speech unit and perform
speaker modeling and verification within each subregion. A good improve-
ment is achieved over GMM-UBM baseline for test utterances no longer than
2 seconds. However, these systems are rather complicated which entail large
computations during testing and may lead to non-negligible delays in making
real-time decisions of AVA.
2.2. Challenges in Real-Time Voice Authentication
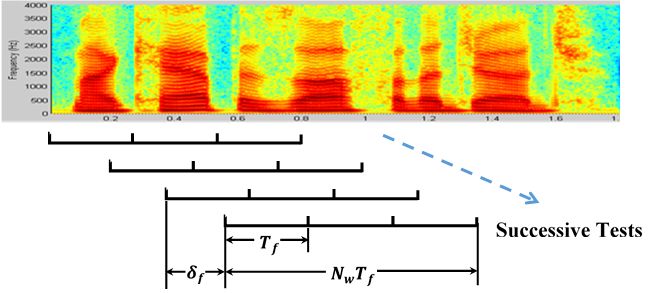
Most speech processing systems follow the convention of the short-time
analysis (STA) framework, in which segments of signal, each being called a
speech frame with a duration (denoted by Tf ) of 20 − 40 ms, are successively
extracted for analysis. The successive analysis is performed at a predefined
rate, called the frame rate denoted as rf , a prevalent choice of which is 100
per second. The frame rate can be converted to frame shift, δf , which is the
reciprocal of rf .
The continuous monitoring mode of AVA dictates that it must be text-
independent, and it must perform real-time authentication sequentially, con-
tinuously reporting the near-instantaneous authentication results in prepa-
ration for possible breach of prior authentication at any moment. The major
challenge in designing such a system is to effectively train talker-specific
models, using as little enrollment speech as possible, for accurate, continu-
ous and instantaneous text-independent speaker verification, with very short
test signals.
Since a talker change may happen abruptly, the authentication decision
cannot be based on a long memory of both the signal representations and the
prior decisions. However, it is well known in statistical analysis that more
data means better test results. A trade-off is thus necessary in determining
the duration of data, which is subject to successive authentication tests. This
duration will involve multiple aforementioned frames as the typical analysis
frame length of 20−40 ms is known to be far too short for reliable hypothesis
7testing. We shall call the test segment a “window”, which is expressed in
number of frames, Nw , and is equivalent to (Nw − 1)δf + Tf of signal in
time. As the system slides the test “window” through the sequence of frame-
based representations and obtain the corresponding test scores, the reporting
interval then defines how often these scores need to be reported. In other
words, the temporal resolution for authentication test may not be identical
to that for reporting. Fig. 1 illustrates the concept of analysis frames and
test windows.
Figure 1: An illustration of the successive tests performed with data windows on a short-
time spectrogram.
To make accurate decisions, we need to model the speaker characteris-
tics within the specified short-time test windows. An unconventional speaker
modeling concept is in order here due to the aforementioned short-test con-
dition. In the usual hidden Markov modeling of speech for speaker identifica-
tion or verification, the model is implicitly assumed to be a characterization
of the general statistical behavior of the signal source, without any regard to
the test duration, and the likelihood calculation is a mere accumulation of the
frame likelihoods over whatever length of the given utterance might be. This
means the models so trained in the conventional manner, without a definitive
duration of data, will have an inherent mismatch condition in the captured
statistical knowledge, and may not lead to the most reliable likelihood test
results. To deal with this problem, we have to match the training and testing
condition by extracting short-time speech segments with a matching dura-
tion from the training and enrollment speech feature sequence. The speech
segment within a sliding window at each time will serve as a training token
for HMM. In this case, the talker-specific HMM, which includes a pair of
target and anti-target models, is able to model the short-time characteristics
8of a speaker that is required by the real-time testing process.
To meet the challenge of minimal enrollment, we adapt a speaker-independent
(SI) model with the MAP adaptation technique [58] to make use of the limited
adaptation data and to obtain a decent estimation of the model parameters
with prior knowledge about the target model distribution. In addition, the
method of MVE training [24] is applied so that the total verification error
is minimized. MVE in [24] must be adapted to the current operating setup
of short test signals. It means that the notion of empirical error estimate
in discriminative methods must now be based on an implicitly different test
sampling scheme. It is no longer an utterance-based sampling and thus the
inherent test statistics must be interpreted differently. We first address these
design changes from the viewpoint of performance metric in Section 2.3. We
also address the problem of data imbalance typical of MVE based systems
by pre-selecting a cohort set consisting of the most confusing impostor data.
This balances the amount of target and impostor data and expedites the
time required for MVE training.
2.3. Performance Metrics
In traditional speaker verification (e.g., NIST SREs), the error counts
are accumulated from the utterance-level decisions: a “miss” occurs when a
legitimate talker is denied for the entire test utterance and a “false alarm”
occurs when an impostor is incorrectly accepted for the utterance. The EER
is defined as the rate at which the “miss” rate and the “false alarm rate”
are equal [59]. This utterance-based error counting is obviously not suitable
for the AVA task because it bears the imperative assumption that the entire
test speech signal is uttered by one and only one talker. It produces a single
verification decision over the entire utterance without considering the possible
change of speaker identity within the test signal. As noted above, AVA has
to be prepared to detect a change of talker at any moment, and a user
authentication error may occur at every test window slided over the signal
continuously.
For AVA, we evaluate window-based EER (WEER) because each real-
time decision about the user identity is made on a test window anchored at
that time instant. A window-based miss detection error (WMDE) occurs if
a “reject” decision is made while the authorized talker is actually speaking
within that window. A window-based false alarm error (WFAE) occurs if an
“accept” decision is made while an impostor is speaking within that window.
After all the window-based testings are performed, the WMDE rate and the
9WFAE rate can be evaluated against a chosen testing threshold. The WEER
is reached when the threshold is chosen to make the two error rates equal.
Obviously, calculation of the WMDE and WFAE rates is conditioned on the
voice activity detector; when there is no speech, no decision is to be included.
Note that WEER differs from the conventional utterance-based EER only in
that the error counts are collected from window-level decisions instead of
utterance-level ones. It becomes the traditional EER when each window of
speech is treated as a separate test utterance.
With WEER as the performance metric, training of the models in AVA
must match the short-time testing condition, particularly when discrimi-
native modeling methods are used. The purpose of discriminative model
training is to minimize the empirical error rate. For an AVA system, such
an empirical error rate is calculated from a combination of the WMDEs the
WFAEs (See Eq. (18)). All these authentication errors are based on the
window-based tokens. Therefore, the sample tokens for training and en-
rollment must each correspond to a segment of speech signal within a test
window. This is one of the crucial differences in modeling for an AVA system
and for a conventional utterance based authentication system.
3. AVA Database and Pre-Processing
Since AVA is a different task from the conventional speaker verification
directed by NIST SRE, we collect a new voice database, which we call the
AVA database, from 25 volunteers (14 females, 11 males) for performance
evaluation. A Microsoft Surface Pro tablet with a built-in microphone was
used to record the data and the sampling rate was set to 8000 samples/s.
Each talker speaks at any position relative to the device as he or she feels
comfortable; we consider this a natural use configuration of the device. The
data collected from each person consists of four parts: the rainbow pas-
sage [60], a user-chosen pass-phrase, 20 randomly selected sentences from
the phonetically balanced Harvard sentences [61] (5.5 s on average) and 30
digit pairs (each digit is randomly selected from 0 to 9). The speaker repeats
the same pass-phrase 8 times. In total, the recording amounts to 2.5 hours
of voice signal from all talkers.
For each speaker, we choose the enrollment data from the Rainbow pas-
sage, the pass-phrases and digits while the testing data is chosen from the
Harvard sentences. The enrollment and test data sets do not overlap. The
duration of each test set is configured to provide at least 1000 decisions per
10speaker in any given configuration. In all the experiments of this paper, the
audio signal is converted to the conventional 39-dimension MFCC features
with frame duration Tf = 25 ms and δf = 10 ms. For the AVA task, the
enrollment or test window moves forward 10 ms each time. Successive tests
are performed with each shift over a segment of the specified durations. The
durations of the enrollment and test windows are equal. The cepstral mean
of speech frames within each enrollment and test window is subtracted to
minimize the channel variability.
4. AVA with I-Vector
I-vector analysis, a new front end factor analysis technique, is the pre-
dominant tool for conventional speaker verification. In this section, we inves-
tigate if this widely applied technique can achieve satisfactory performance
for AVA.
The i-vector is a projection of a speech utterance onto a low-dimensional
total variability space that models both the speaker and the channel vari-
ability. More specifically, it is assumed that there exists a linear dependence
between the speaker adapted (SA) GMM supervectors µ and the SI GMM
supervector m [32].
µ = m + Uw (1)
where U is a low rank factor loading matrix representing the primary di-
rection of variability, and w is a random vector of total factors having a
standard normal distribution N (0; I). The i-vector is an MAP estimate of
w.
We first apply i-vector to the conventional speaker verification task under
the assumption that each test utterance is from only one speaker. We train
a GMM UBM with all the enrollment data in the AVA database. With the
EM algorithm, an SI factor loading matrix U SI is trained on the statistics
collected from the UBM. An i-vector is then extracted for each speaker using
his or her enrollment data and U SI . During testing, an i-vector is extracted
from the each test utterance using U SI . The i-vector dimension is fixed at
400. A cosine distance between the i-vector of each test utterance and that of
the hypothesized speaker is used as the decision score. The EER is computed
with all the utterance-level decision scores. In AVA database, the i-vector
11achieves 0.00% EER for the utterance-based speaker verification task under
all UBM configurations.
We then apply i-vector for the AVA task. We adopt the same training
method as in the traditional speaker verification except that the training
and enrollment tokens are generated by a sliding window with a prescribed
duration. During testing, a test window of the same duration is slided over
the test utterance at the rate of 100 per second and an i-vector is extracted
from the speech signal within each test window using U SI . The cosine dis-
tance between the i-vector of each test window and that of the hypothesized
speaker is used as the decision score.
The AVA dataset described in Section 3 is used for the performance eval-
uation. We fix the duration of enrollment data at an average of 240 s per
speaker and randomly select two Harvard sentences for use as the testing data
for each speaker. For AVA task, the window duration ranges from 1.01 s to
3.01 s. We show the WEER results with respect to the test window duration
and the number of mixtures in the UBM in Table 1.
Table 1: WEER (%) of AVA using i-vector on AVA database with different test window
durations and UBM configurations. The enrollment data is 240 s long on average for each
speaker.
Number Test Window Duration (s)
of Mixtures 1.01 1.51 2.01 2.51 3.01
64 14.82 7.97 4.31 1.96 0.87
128 13.72 7.24 3.72 1.56 0.58
256 13.89 7.29 3.69 1.43 0.35
512 12.91 6.92 3.79 1.44 0.52
1024 14.54 8.02 3.99 1.62 0.64
For each UBM configuration, the i-vector based AVA system achieves5. AVA Training and Registration
The AVA system consists of three parts: a training module, a registration
module and an authentication module. In this section, we introduce the
major components of the training and registration module which train and
adapt the models to the enrollment data of each speaker.
Fig. 2 shows the training and registration stages of the AVA system.
First, in the training stage, a SI ergodic HMM is trained on a sufficient
pool of data from a general collection of speakers in the training set. The
speech signal is converted to mel-frequency cepstral coefficients (MFCCs)
[62] through the front-end processing component. The parameters of the SI
HMM are initialized with the K-means clustering algorithm. The final SI
HMM is obtained by applying the Baum-Welch re-estimation algorithm in
the maximum likelihood (ML) training component. Then, in the registration
stage, the model adaptation component adapts the SI model parameters to
the voice of the target speaker upon receipt of the new registration data and
generates the SA model based on the MAP adaptation technique [58]. Then
for the target data, an equivalent and most confusing set of data is selected
from the impostor set by the cohort selection component for MVE training.
Finally, the MVE training component generates the MVE trained target and
anti-target model by directly minimizing a combination of the WMDEs and
WFAEs. We elaborate the algorithms and procedure in Section 5.1, 5.2, 5.3
and 5.4.
5.1. Speaker-Independent (SI) Model Training
In the training stage, an SI ergodic HMM, also called the UBM, for use as
the seed model for later adaptation is trained. The parameters of this HMM
are estimated by the Baum-Welch re-estimation algorithm after having been
initialized with the K-means clustering algorithm.
Let γj (t) denote the occupation probability of being in state j of the
ergodic HMM at time t which can be calculated efficiently using the Forward-
Backward algorithm [63]. The above-mentioned short-time requirement in
sequential training implies that γj (t) be accumulated differently from the
conventional utterance-based training approach. This is because each test in
AVA involves a voice segment within a test window of duration, Nw δf , and
this condition should be matched during training. Therefore, we modify the
accumulation of γj (t) as follows.
13Figure 2: The components of the AVA training and registration stages.
14Let us denote an entire training utterance by X = {x1 , . . . , xT }, where T
is the number of frames within the training utterance. Xta ,tb = {xta , . . . , xtb }
is the speech segment extracted from X, where ta and tb are the start and
end times, respectively, and 1 ≤ ta ≤ tb ≤ T . Each Xta ,tb is used as a training
token for Baum-Welch re-estimation as is elaborated above. Assume that the
number of frames within each window is Nw and st is the state that frame xt
is aligned with at time t. In short-time sequential training, the occupation
probability γjshort (t) of being in state j at time t becomes
Nw
1 X
γjshort (t) = P (st = j|Xt+τ −Nw +1,t+τ ), (2)
Nw τ =1
Nw
1 X P (Xt+τ −Nw +1,t+τ |st = j)P (st = j)
= . (3)
Nw τ =1 P (Xt+τ −Nw +1,t+τ )
In Eq. (3), γjshort (t) is calculated through the average likelihood of all the
speech segments of window duration Nw δf which include the frame xt .
For the conventional utterance-based training, the state occupation is
γjconv (t) = P (st = j|X1,T ), (4)
P (X1,T |st = j)P (st = j)
= . (5)
P (X1,T )
In Eq. (5) γjconv (t) is computed through the likelihood of the entire utterance
X, which is much longer than the window duration. Each term of the summa-
tion in Eq (3) falls back to the conventional utterance-based state occupation
probability in Eq (5) when Nw = T and τ = T − t because the window covers
the duration of the entire utterance. In other words, γjshort (t) is affected by
the statistics of the window-duration speech segment which contains frame
xt while γjconv (t) is affected by the entire training utterance even when only
a small portion of the utterance is correlated with xt statistics.
After obtaining the occupation probability, we update the HMM param-
eters with the average of the window-wise sufficient statistics weighted by
γ short (t) in a standard way.
5.2. Model Adaptation
When a registration procedure is initiated, the SI model is assumed to
have been well-trained as described in Section 5.1. As the first step of reg-
istration, the model adaptation component in Fig. 2 adapts the SI model
15to the new registration data of the authorized target speaker using MAP
estimation.
Assuming speech segment X = {x1 , . . . , xT } within a sliding window
from a registered user to be a training token for MAP adaptation, the like-
lihood of X given HMM with J states and parameter λ = {πj , aij , θj }Ji,j=1
is
X T
Y K
X
p(X|λ) = π s0 ast−1 st wst m N (xt |µst m , Σst m ) (6)
s t=1 m=1
where s = {s1 , . . . , sT } is the unobserved state sequence, πj is the initial
probability of state j, aij is the transition probability from state i to state
j, θj = {wjk , µjk , Σjk }, k = 1, . . . , K, where wjk , µjk , Σjk are the weight,
mean vector and covariance matrix, respectively, for the k th component of
the Gaussian mixture which is the probability output of state j. The MAP
estimate θM AP is aimed at maximizing the posterior probability denoted as
f (λ|X), i.e.,
θM AP = arg max f (λ|X) = arg max p(X|λ)g(λ) (7)
λ λ
where g(λ) is the prior distribution of λ.
The MAP estimate is obtained as follows. The probability of being in
state j at time t with the kth mixture component accounting for xt is
wjk N (xt |µjk , Σjk )
γj,k (t) = γj (t) PK (8)
m=1 wjm N (xt |µjm , Σjm )
For mixture k in state j, the occupation likelihood and the 1st and 2nd
moment of the observed adaptation data can be estimated by
T T
X 1 X
njk = γj,k (t), E[xt ] = γj,k (t)xt (9)
t=1
njk t=1
T
> 1 X
E[xt xt ] = γj,k (t)xt x>
t (10)
njk t=1
Thus, the MAP update formula for mixture k in state j of an HMM is
w njk w
ŵjk = αjk + (1 − αjk )w̄jk (11)
T
m m
µ̂jk = αjk E[xt ] + (1 − αjk )µ̄jk (12)
v
Σ̂jk = αjk E[xt x> v 2 2
t ] + (1 − αjk )(Σ̄jk + µ̄jk ) − µ̂jk (13)
16where {w̄jk , µ̄jk , Σ̄jk }, k = 1, . . . , K, j = 1, . . . , J are the mixture parameters
ρ
of the SI HMM. The adaption coefficient αjk , ρ ∈ {w, m, v} is defined for each
ρ
mixture component in each state as αjk = njk /(njk + η ρ ) where η ρ accounts
for the weight of prior knowledge for ρ.
The MAP adaptation is performed during sequential training on each
training token X. As is explained in Section 5.1, the MAP adapted model
also characterizes the short-time statistics of the registration speech data
since the statistic γj (t) in Eq. (8) is accumulated through the likelihoods of
the adaptation speech segments which have the same duration as the test
window.
5.3. MVE Training
As registration stage, the MVE training is performed after the speaker
model adaptation. The SA HMM and the SI HMM serve as the initial target
and initial anti-target model, respectively, for the MVE training. In the
MVE training component in Fig. 2, all parameters are optimized with the
enrollment and training data, according to the criterion to minimize the total
number of authentication errors (which is the total number of WMDEs and
WFAEs) on the corpus.
Let us define the enrollment data of the target speaker as the target set
D0 , and define the training data excluding the speech of the target speaker as
the impostor set D1 . For a window-duration MVE training token Xn from
either D0 or D1 , g(Xn |λ0 ) and g(Xn |λ1 ) denote the log-likelihoods of Xn
given the target HMM with parameters λ0 and the anti-target HMM with
parameters λ1 , respectively. The log-likelihoods are calculated by aligning
Xn against the states of the target and the anti-target models using the
Viterbi algorithm and are normalized with respect to the total number of
frames T within the utterance Xn . As the training tokens are generated
by sliding a window of size Nw frames every δf duration on the training
utterance, the likelihood can be calculated more efficiently by modifying the
Viterbi algorithm. Instead of resetting the trellis and initializing it anew each
time we evaluate the log-likelihood of a new window of voice segment within
the same utterance, we reset the trellis only at the beginning of a training
utterance and let the trellis grow until the end of the utterance. The log-
likelihood of an incoming window of voice segment is accumulated directly
from the part of the fully grown trellis which starts from the very beginning
of the utterance. This new implementation is equivalent to performing a
partial traceback of the trellis structure within each sliding window so that
17the consistency is maintained in training and testing based on short window
of data. The partial traceback also speeds up the MVE training procedure
by a factor of Nw .
To count the verification errors based on the log-likelihood of the tokens,
the misverification measure is further defined for each class
d0 (Xn |λ0 , λ1 ) = −g(Xn |λ0 ) + g(Xn |λ1 ), if Xn ∈ D0 , (14)
d1 (Xn |λ0 , λ1 ) = g(Xn |λ0 ) − g(Xn |λ1 ), if Xn ∈ D1 . (15)
The two types of verification errors, WMDE and WFAE, can be approxi-
mated as l0 and l1 , respectively, by embedding the two misverification mea-
sures into smooth loss functions below
A0
l0 (Xn |λ0 , λ1 ) = , if Xn ∈ D0 , (16)
1 + exp [−d0 (Xn |λ0 , λ1 )]
A1
l1 (Xn |λ0 , λ1 ) = , if Xn ∈ D0 , (17)
1 + exp [−d1 (Xn |λ0 , λ1 )]
where the weights A0 and A1 emphasize the respective error types.
Finally, we obtain the MVE loss as an approximation of the total number
of verification errors on the training and enrollment corpus as follows.
X X
L(λ0 , λ1 ) = l0 (Xn |λ0 , λ1 ) + l1 (Xn |λ0 , λ1 ) (18)
Xn ∈D0 Xn ∈D1
In Eq. (18), the total number of verification errors are expressed as a con-
tinuous and differentiable function of the model parameters, and hence, can
be minimized with respect to all parameters by using the generalized prob-
abilistic descent (GPD) algorithm [64].
In the short-time sequential training framework, each Xn is a speech seg-
ment sequentially extracted from the training utterance via a sliding window.
The likelihoods of the speech segments are computed with the same duration
as the test window and then utilized to calculate the gradient and the steps
size of GPD update at each iteration. Therefore, a speaker model accurately
matched to the testing condition is estimated through short-time sequential
training.
5.4. Cohort Selection
From Eqs. (14), (15), (16) and (17), we notice that an MVE training frame
from the target speaker updates the model such that the WMDE decreases
18and a training token from the impostor speaker updates the model such that
the WFAE decreases. The impostor speaker can be any speaker other than
the target speaker and the number of data tokens from the impostors in the
database will obviously be greater than the number of tokens of the target
speaker. Since we choose WEER as the performance indicator, we need a
balanced data set of target and impostor speech. Therefore, to maintain a
balance in the amount of target and impostor data without sacrificing the
discriminability between the two, we pick from the impostor set D1 a most
confusing set of data for use in MVE training for each target speaker. This
selected set is called the cohort set.
In the cohort selection component of Fig. 2, a screening test is run with
the MAP adapted target model and the SI model to select possible cohort
impostor set for MVE training. A log-likelihood ratio (LLR) is computed for
each window-duration segment of the impostor data D1 using Eq. (6), where
the log-likelihoods are calculated efficiently through the modified Viterbi al-
gorithm described in Section 5.3. We further rank the segments by their
LLRs in descending order and pick the top r speech segments as the cohort
set for subsequent MVE training, where r is the number of segments in the
target dataset. This does not affect the overall performance as the speech
segments with lower LLRs naturally contribute less to the gradient in GPD
optimization (see Eqs. (14), (15), (16), (17) and (18)). With cohort selec-
tion, D1 in Eq. (18) becomes the cohort set and the following MVE training
is performed in the same way as described in Section 5.3. Cohort selection
proves useful in reducing the time needed to train the speaker models with
MVE as it reduces the data that the MVE algorithm needs to process.
6. Short-Time Sequential Testing
In the authentication stage of AVA, the system performs sequential test-
ing (note: the sequential testing here is to be differentiated from the Wald’s
sequential test [65]) and makes decisions in real-time. The testing needs
both the target and anti-target models for each registered speaker that are
obtained after MVE training. During operation, the sequential testing pro-
cedure continuously takes a sliding window of speech frames, accumulates
the log-likelihood with respect to both target and anti-model for the speaker,
and then reports the LLR confidence scores periodically to the system. Fig. 3
shows the block diagram for short-time sequential testing. The LLR scores
19Figure 3: Diagram of the AVA authentication module.
are calculated using the following equations
Γ(X) = log p(X|λ0 ) − log p(X|λ1 ) (19)
where X = {x1 , . . . , xT } is a window of voice frames. λ0 and λ1 are the
parameters of the target and anti-target models defined in , respectively.
The likelihoods p(X|λ0 ) and p(X|λ1 ) are computed using Eq. (6) through
the modified Viterbi algorithm described in Section 5.3.
As discussed, a speech signal inevitably contains silence gaps. These
silence gaps do not contain any voice biometric information and need to be
excluded from testing. We use a voice activity detector (VAD) to modulate
the WEER results by ignoring the test scores from silent frames. We use the
VAD algorithm suggested in the European Telecommunications Standards
Institute (ETSI) Distributed Speech Recognition front-end [66]. The VAD
makes a binary voice/silence decision for every frame. Each VAD decision
is made based on the average log mel energy of its 80 neighboring frames.
We ignore the speaker authentication decision for a given testing window if
the corresponding anchor frame (the frame at the middle of window) is silent
according to the VAD.
7. Experiments
For the performance evaluation in Sections 7.1, 7.2, and 7.3, we use the
enrollment and test data in AVA dataset as is described in Section 3.
207.1. Performance with test window duration
Our first investigation focused on the trade-offs between the duration of
the test window and the authentication performance. The duration of test
window directly affects the system delay and the real-time requirement. We
fix the duration of enrollment data at an average of 240 s per speaker, but
vary the duration of the test speech segment from Nw δf = 0.1 s to 5.01 s
corresponding to Nw = 1, . . . , 501 frames. We select part of the Harvard
sentence set for use as the testing data for each speaker. Two Harvard
sentences are randomly selected for each speaker for the window durations
from 0.1 s to 1.01 s, while 4 Harvard sentences are selected for 2 s and 5 s
testing windows. Fig. 4 shows the baseline WEER for each window duration.
We note that the WEER based on just 0.1 s of test data is quite poor at
approximately 24%, but it improves as we increase the duration of the data
for each decision epoch.
15
WEER (%)
10
5
0
0.1 1 2 3 4 5
Window duration in seconds.
Figure 4: The WEER as a function of the duration of the decision window. The WEER
values are based on the MAP adapted model as the target model and the SI model as the
anti-target model with 1 state and 128 mixtures.
As expected, the WEER performance monotonically decreases with the
duration of the test data. Furthermore, a knee point can be observed at
around 1 s, which can serve as a designing parameter to meet the real time
requirement. We also note that the WEER with 5 s of sequential test data is
210.78%. This is quite low and in need of careful considerations as it may incor-
rectly imply that the system would perform flawlessly if the test window is
sufficiently large. In our evaluation, we perform a test evaluation on each suc-
cessive window of data which comes from the same utterance. For example,
a 10 s long utterance will produce nearly 1000 test decisions; in the conven-
tional utterance-based evaluation, it would have been just one test decision.
This gives rise to the issue of statistical significance in the error probability
estimate for the talker verification performance. It is fair to note that in the
conventional utterance-based evaluation, the evaluation sample size tends to
be rather limited, which weakens the statistical significance of the test re-
sult, while in the new window-based evaluation, the test sample size makes
the error probability estimate more statistically trustworthy but it contains
a sampling bias as the tests are performed on successive data windows that
are not independent. This contrastive consideration, while interesting, does
not affect the determination of the trade-off here. We thus choose 1 s as the
nominal duration of the test data window, used in subsequent evaluations.
7.2. Performance as a function of model configuration
We fix the duration of the enrollment data at an average of 240 s per
speaker and randomly select 2 or 4 Harvard sentences for each speaker as the
test set when the test window duration is 1.01 s or 2.01 s. With 25 speakers
in total, more than 25,000 or 35,000 trials are generated from the 50 Harvard
sentences or 100 Harvard sentences by sliding the test window. In Table 2,
we provide the performance evaluations for the average WEER (after VAD
modulation) with a 1.01 second decision window duration over the various
model configurations and two algorithms, MAP and MVE (the number in
bold means the best performance in the column). We notice that the average
WEER for MAP adapted models is 4.10% while MVE training decreases the
absolute WEER to 3.00%, on average. Depending on the complexity of
the model and the algorithm, the WEER ranges between 2.6-4.5%. The
models with one state represented by 1024 Gaussian mixtures achieves the
best performance. Table 3 shows the evaluation results with VAD for different
configurations with the decision window durations set at 2.01 seconds.
7.3. Performance with enrollment data duration
It is desirable to use as little enrollment data as possible while maintaining
a similar performance as in Table 2. In the following, we evaluate our system
on the minimum amount of enrollment voice data necessary to achieve an
22Table 2: WEER performance under different HMM model configurations after VAD. The
decision window duration is 1.01 seconds. The enrollment utterance is 240 seconds long
on average for each speaker (full enrollment data).
Number of Number of
MAP WEER (%) MVE WEER (%)
States Mixtures
1 128 4.51 3.17
8 16 4.50 3.21
1 256 4.13 2.89
16 16 4.14 2.96
1 512 3.76 2.85
32 16 3.97 3.04
1 1024 3.56 2.66
32 32 4.22 3.22
Average 4.10 3.00
Table 3: WEER performance under different HMM model configurations after VAD. The
decision window duration is 2.01 seconds. The enrollment utterance is 240 seconds long
on average for each speaker (full enrollment data).
Number of Number of
MAP WEER (%) MVE WEER (%)
States Mixtures
1 128 2.10 1.55
8 16 2.15 1.45
1 256 2.06 1.25
16 16 2.04 1.20
1 512 2.07 1.29
32 16 1.97 1.12
1 1024 2.31 1.87
32 32 2.26 1.39
Average 2.12 1.39
23acceptable performance which bears directly on the time it takes for a talker
to register for AVA for the first time.
In Table 5 and 4, we use 180 and 105 seconds of enrollment voice data,
respectively. Two Harvard sentences from each speaker are selected to form
the test set. With 25 speakers in total, more than 25,000 trials are generated
from the 50 Harvard sentences by sliding a test window with a duration of
1.01 s. When we compare the results in Table 4 with the results in Table 2,
where the average enrollment data duration is 240 seconds, we notice that
using 25% less enrollment data reduces the MVE performance to an average
WEER of 4.64% from 3.00%. Similarly, in Table 5 we are using 56% less
enrollment voice data than in Table 2 which reduces the average WEER
performance with MVE to 6.31%. In the case of reduced enrollment voice
data, the degradations may still be acceptable as the WEER stays in the
vicinity of 5-6%.
Table 4: WEER performance under different HMM model configurations after VAD. The
decision window duration is 1.01 seconds. The enrollment utterance is 180 seconds
long for each speaker.
Number of Number of
MAP WEER (%) MVE WEER (%)
States Mixtures
1 128 5.56 4.65
8 16 5.38 5.03
1 256 4.81 4.51
16 16 4.55 4.44
1 512 5.15 4.72
32 16 4.59 4.31
1 1024 5.02 4.72
32 32 5.11 4.71
Average 5.02 4.64
7.4. Performance of conventional speaker verification using AVA real-time
decisions
In the scenario of conventional speaker verification, each test utterance
is assumed to include the speech of only speaker with a claimed identity.
A decision is made on the speaker identity by comparing a threshold with
the log-likelihood score of the entire test utterance given the claimed speaker
24Table 5: WEER performance under different HMM model configurations after VAD. The
decision window duration is 1.01 seconds. The enrollment utterance is 105 seconds
long for each speaker.
Number of Number of
MAP WEER (%) MVE WEER (%)
States Mixtures
1 128 6.85 6.15
8 16 6.56 6.49
1 256 6.40 5.94
16 16 6.27 5.76
1 512 6.73 6.53
32 16 6.51 5.83
1 1024 7.81 7.54
32 32 7.76 6.21
Average 6.86 6.31
model, while in the case of AVA, a decision needs to be made on each short-
duration test window in real-time because the test utterance may undergo
change of speaker at any time instant.
Here, we are interested in exploring the performance of the window-
based modeling and testing scheme of AVA in a conventional utterance-based
speaker verification task. Under the assumption that each utterance is spo-
ken by a single talker, we form the verification decision for the entire utter-
ance by instituting a majority vote from the AVA short-time window-based
decision sequence. Specifically, for a test utterance of duration T , if more
than bT /δf c/2 of the decisions for the window-based tests are “true speaker
(impostor)”, the final decision for this utterance will be “true speaker (im-
postor)”. With the utterance-level ground truth, EER can be computed in
the way as described in Section 2.3 by varying the threshold.
With the AVA real-time decisions in Section 7.2, an EER of 0.00% is
achieved under all HMM configurations for the utterance-based conventional
speaker verification task using the AVA database.
7.5. Statistical validation of performance
Cross validation is an effective statistical method to test the generalizabil-
ity of a model to new or unseen data [67]. In the text-independent real-time
speaker verification task, in which the data is randomly divided into roughly
equal K subsets and for each validation trial, one of the K subsets is used as
the testing set while the rest of the K-1 subsets are put together to form a
25Table 6: Average WEERs with 95% CR for the model configuration shown with 5 runs
each of the 3-fold validation of the MAP and MVE algorithms on the AVA database.
All results include VAD decision modulation. The testing window duration is set at 1.01
second.
Number of Number of Average MAP Average MVE
States Mixtures WEER ± CR(% ) WEER ± CR (% )
1 512 2.42 ± 0.09 2.01 ± 0.12
32 16 2.29 ± 0.11 1.79 ± 0.12
enrollment set. The enrollment set is fit to a model and predictions are made
on the testing data based on the trained model. In each round, the validation
is repeated K times and results are then averaged over the K validation trials
or folds.
To ascertain the statistical significance of the obtained performance, we
use K-fold cross validation to systematically check the accuracy of the speaker
models for unseen data. We set K=3 to keep the duration of the enrollment
set for each speaker to 240 seconds, on average, which makes the results
comparable with the evaluations in Section 7.2. We run 5 rounds of the 3-
fold cross validation and average over the results for the folds and rounds.
The results are shown in Table 6, in which we give the average WEER of the
rounds and the 95% confidence range (CR) to indicate the variation of the
WEER. We notice that the CR for the MAP algorithm are smaller than for
MVE algorithm.
Furthermore, when comparing the results in Table 6 with the results in
Table 2, we notice that the WEER is less than that achieved for the same
model. This is because the enrollment and testing datasets, in contrast to the
evaluations done in the preceding section, are more matched in terms of the
material, despite being selected randomly. As is mentioned in Section 7, the
dataset for each speaker consists of four parts: rainbow passage, 8 repeated
pass-phrases, Harvard sentences and digit pairs. For 3-fold validation, we
randomly select roughly a third of the utterances from each part, combine
them to be the testing set and use the rest two-third as the enrollment set.
This means that some of the repeated pass-phrase utterances will be shared
between the enrollment and test sets. A similar sharing may occur for the
digit pairs. Thus, a lower WEER is obtained in this case.
267.6. Performance evaluation on NIST SRE
The NIST SRE Training and Test Sets are widely used to evaluate the
performance of speaker verification systems. In NIST SRE, the decisions
are made on each test utterance based on the speaker models trained with
the provided training data and the performance is evaluated with respect
to the ground truth. We notice that cross-talk components exist in these
datasets, i.e., even though a test utterance is labeled as coming from a certain
speaker in the label, some portion of the utterance is actually from another
speaker (e.g., see 2001 NIST SRE). Although these crosstalk components
may not substantially affect the performance evaluation designed for NIST’s
utterance-based authentication, it does not suit the evaluation of the real-
time, window-based AVA system as the real identity of each sliding window
of the speech signal is not known. To verify the effectiveness our method on
large and publicly available datasets, we sift out the cross-talk components
in NIST SRE 2001 dataset [68] and evaluate the performance of AVA using
both i-vector and the proposed method with the remaining speech signal.
In NIST SRE 2001, there are 100 female target speakers and 74 male
target speakers with around 2 minutes of enrollment data for each speaker. In
addition, there are 2038 test segments, each of which has a duration varying
between 15 to 45 seconds. Each test segment will be evaluated against 11
hypothesized speakers of the same gender as the target speaker. One of the
11 hypothesized speakers is the true speaker present in the test segment and
rest of them are impostors.
Since the cross-talk components in NIST SRE 2001 has significantly lower
energy per frame than the speech signal from the target speaker, a decision
of “cross-talk” is made for a speech frame if its log mel energy is below a
certain threshold. The decision for each window of frames is then made by
taking the consensus of the threshold decisions within that window. The
windows labeled as “cross-talk” are eliminated in both the enrollment and
test utterances and ignored in the experiments. After sifting, we kept about
75% of windows in the enrollment data and 95% of windows in the test data.
We first evaluated the i-vector technique in both the utterance-based
conventional speaker verification task and the AVA task in exactly the same
way as described in Section 4. The WEER results with respect to the number
of mixtures are listed below.
We then apply the proposed training and testing method described in
Sections 5 and 6 to the AVA task on NIST SRE 2001 and obtain the WEER
27Table 7: WEER (%) of AVA and EER (%) of conventional speaker verification (SV)
using i-vector on NIST SRE 2001 dataset with different UBM-GMM configurations. The
decision window duration for AVA is 1.01 seconds.
Number of
AVA WEER (%) SV EER (%)
Mixtures
64 28.02 7.51
128 26.96 6.67
256 26.53 7.26
512 26.74 7.90
1024 27.66 8.44
results below. We also compare the performance difference between MAP
and MVE training.
Table 8: WEER (%) of AVA using MAP and MVE on NIST SRE 2001 with different
HMM model configurations. The decision window duration is 1.01 seconds.
Number of Number of
MAP WEER (%) MVE WEER (%)
States Mixtures
1 128 24.29 23.67
8 16 24.07 23.54
1 256 24.12 23.55
16 16 23.66 22.91
1 512 24.27 23.34
32 16 23.55 22.65
1 1024 24.55 23.63
32 32 23.73 22.77
By comparing Tables 7 and 8, we see that the proposed method achieves
3.88% absolute gain over i-vector for the AVA task when the window duration
is 1.01s. For the conditional speaker verification, our i-vector based system
achieves 6.67% EER, which is 1.61 % absolutely better than the UBM-GMM
baseline EER 8.28 % reported in [69] on NIST 2001 SRE.
As a cross reference, for conventional speaker verification task, the i-vector
achieves 6.02%-7.07% and 4.77%-5.15% EERs for the male and female parts,
respectively, of telephone data in the core condition of NIST SRE 2008 [70]
(the condition most similar to NIST SRE 2001); it achieves an EER of 22.01%
on NIST SRE 2008 core condition when the test utterances are truncated to
2 seconds [51].
28You can also read